

Hello Tariffs, My Old Friend
A distraction from the oil shock

Last month, the Supreme Court invalidated the “reciprocal tariffs” from April 2, 2025, holding in Learning Resources v. Trump that the International Emergency Economic Powers Act does not authorize the president to impose tariffs.
But tariffs as a policy are more important to the president’s agenda than any specific legal authorization is to the tariffs, so they will likely be back soon, under different and likely just-as-challengeable authorities. There is not much sense in trying to predict which authorities, or which tariffs exactly, since the point of the tariffs is to produce a reaction, not so much to be understood.
Over the seven months the “Liberation Day” tariffs were in force, reactions were more or less constant, but only rarely impacted long-term business decisions. The chaos of implementation and the randomness of incidence meant that the economic impact was closer to the supply-side price rationing of the pandemic era, where specific inputs suddenly and significantly changed prices.
We can seesome evidence of this in the responses to Fed manufacturing surveys while the tariffs were in force: higher uncertainty about the policy environment led firms to delay or cancel investments in new capacity while waiting for the demand-side impacts to become clear. In effect, the scattershot Trump II tariffs produced a kind of mini-pandemic-supply-chain-crisis — one that is now over, and which may even be rebated if the administration can figure out the required administrative infrastructure.
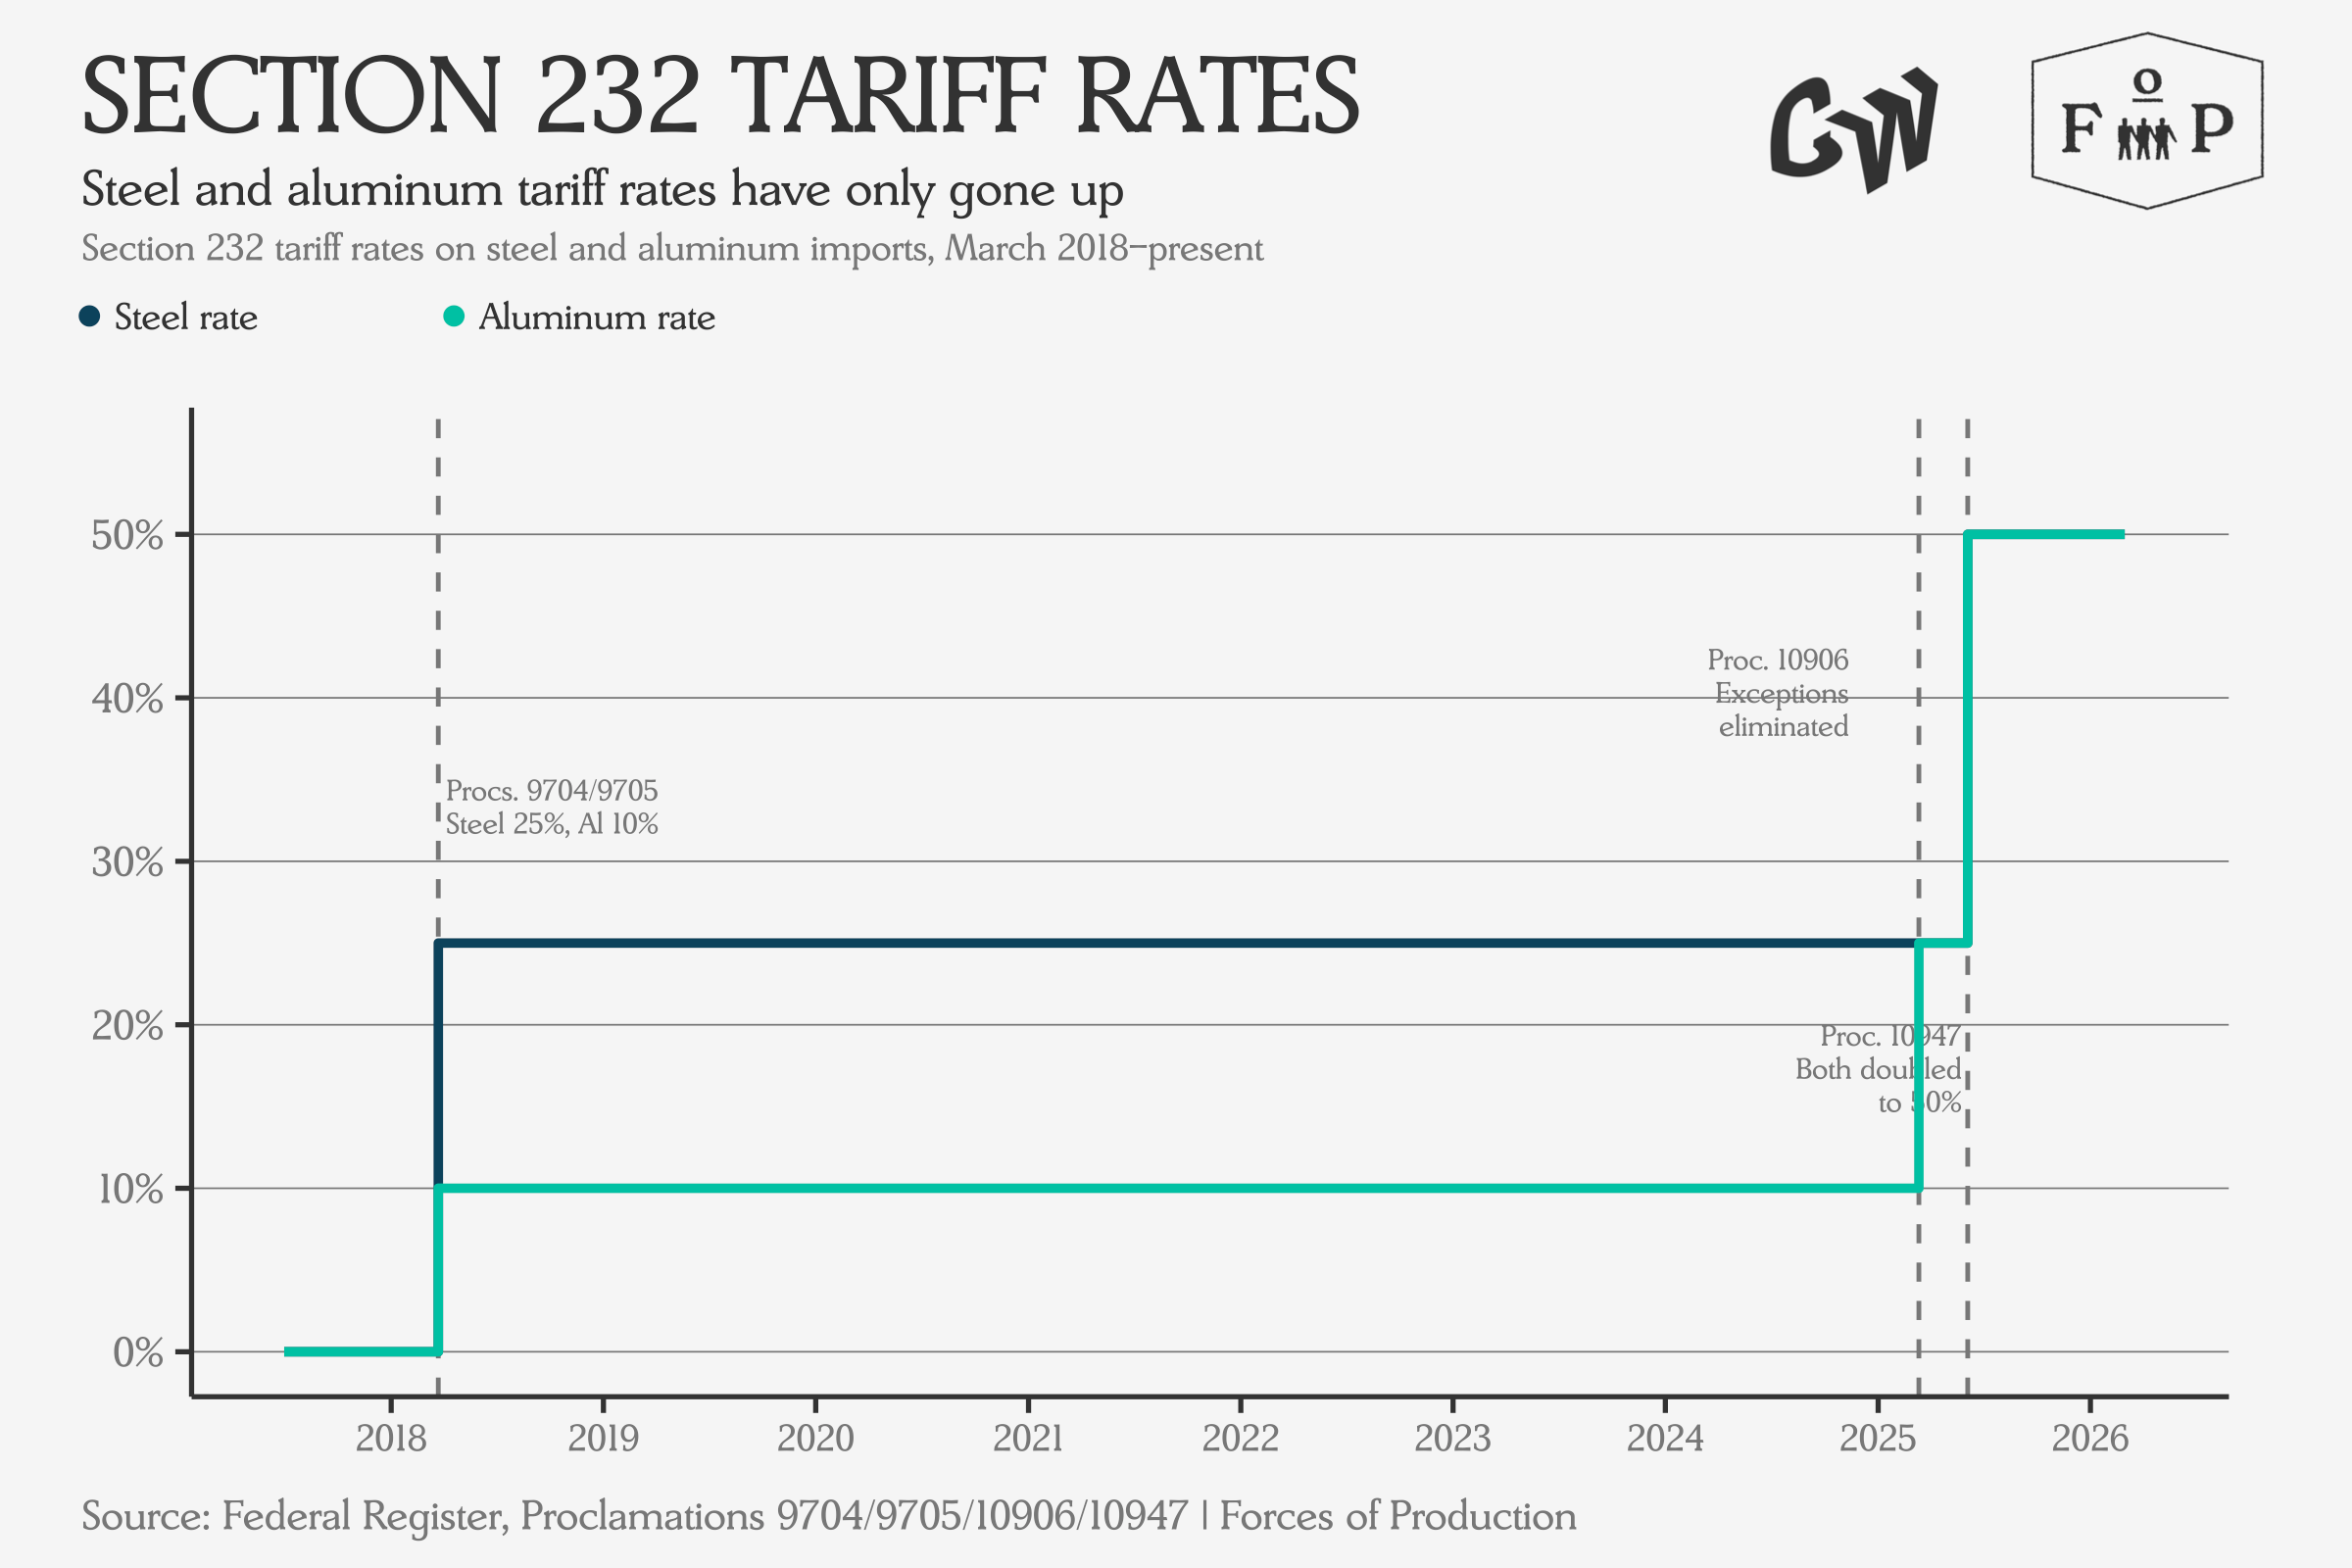
Yet there is one group of tariffs that survived the Supreme Court’s ruling, which have in fact been in force since the first Trump administration: the Section 232 tariffs on steel and aluminum. These tariffs were put in place nearly eight years ago, and the rates have only gone up since then — from 25 percent on steel and 10 percent on aluminum in March 2018, to 25 percent on both when country exceptions were eliminated last March, to 50 percent on both when the rate doubled in June.
Tracking the Wily Tariff
So, instead of memorializing tariffs lost, let’s take a closer look at the tariffs that have stuck around and think through where to look for their impact. Tariffs work by changing the cost of imported goods through an extra tax, for households and businesses alike. In the consumer case — say, ordering LPs online from the UK to the US — this is relatively easy to understand: the consumer pays an extra tax on the goods they ordered.
But the Section 232 tariffs are taxes on intermediate goods used by industry. I don’t know about you, but I do not order a lot of raw steel from China to the house these days. This means that the tariffs will have some kind of impact on the relative cost structure across different industries: different sectors buy steel and aluminum, to use for different things, and that will affect profitability, competitiveness, and on a long enough timeline maybe even capital structure for the downstream industries most exposed. But which industries? And how exposed are they? To answer these questions, we have to turn to the input-output tables.
The IO tables are one of the less well-known products of the national accounts. The Bureau of Economic Analysis (BEA) produces detailed benchmarks every five years — most recently for 2017 — whichcover the linkages between 402 individual industries, mapping how many dollars flow from one industry (the seller) to another (the buyer). The diagram below shows this whole system: every arc represents a transaction between two sectors.
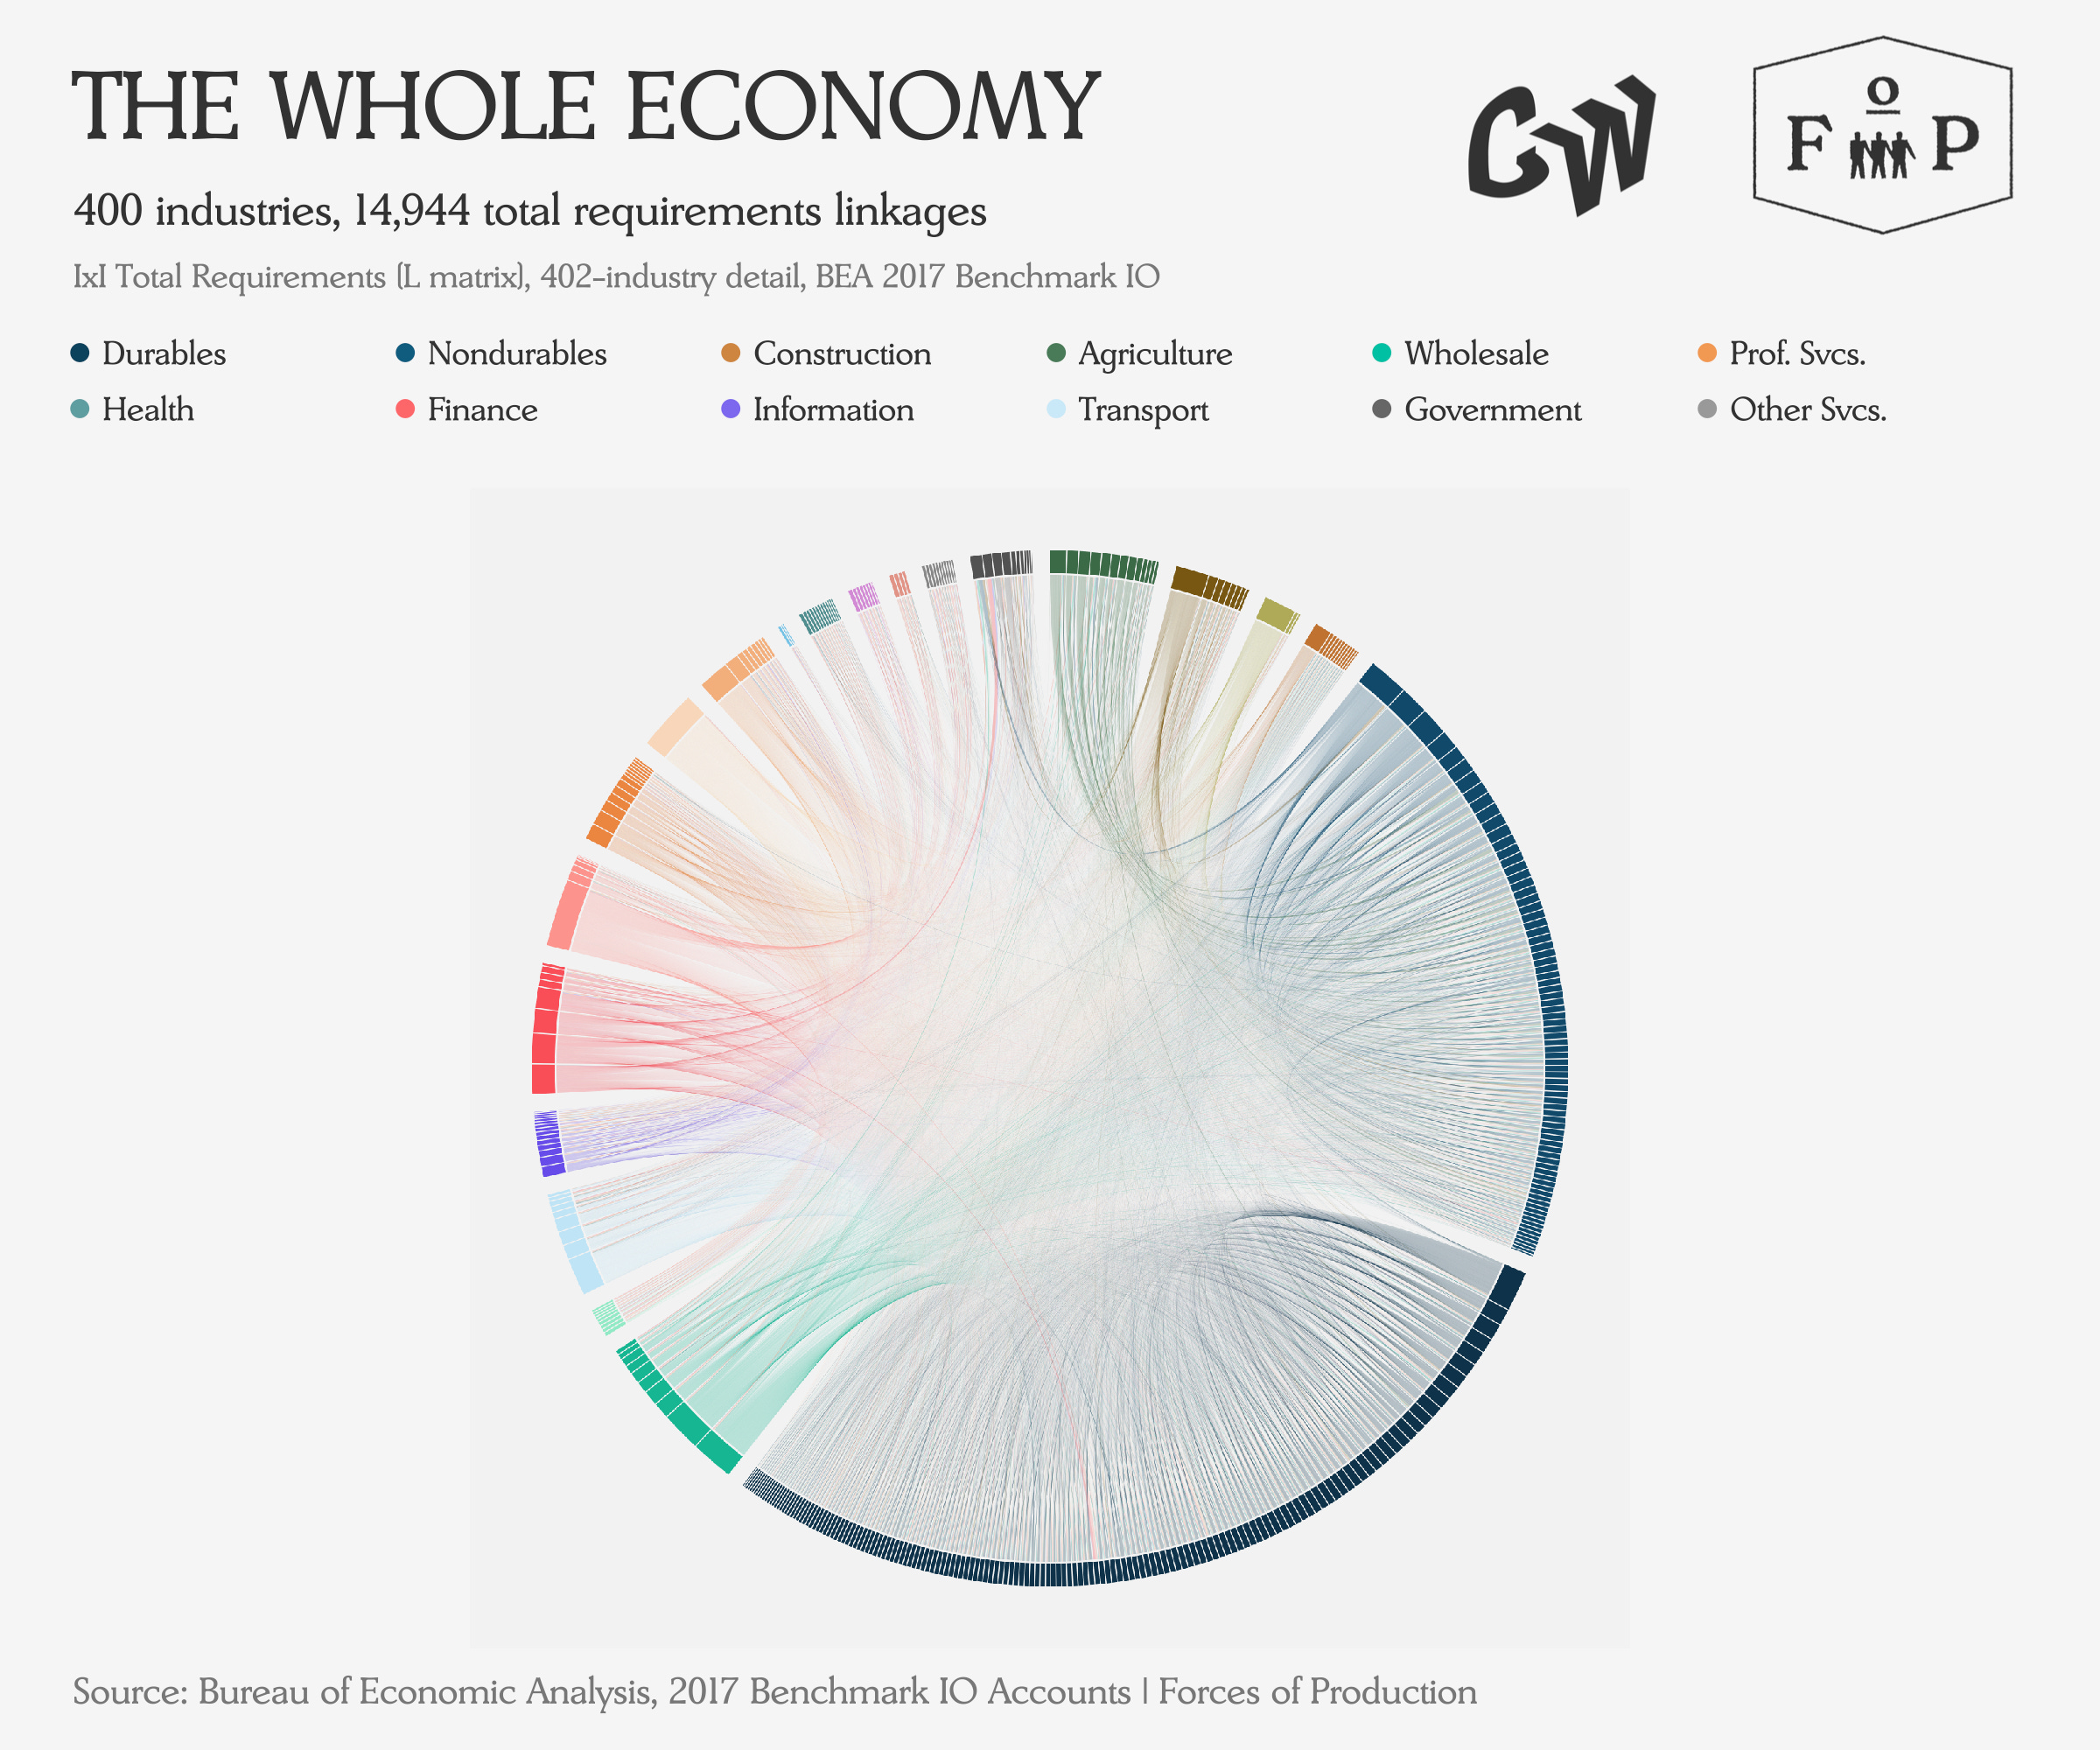
This is not the clearest chart in the world, but it does give a real sense of the complexity involved. The IO tables are a bit like a map of the supply side. So for our purposes, we can use the fact that the economy is coordinated through a network of purchase relationships to track how a tariff on one product propagates through the whole network to every industry that buys it, and then onwards to every industry that buys from them, onwards.
Upstream and Downstream
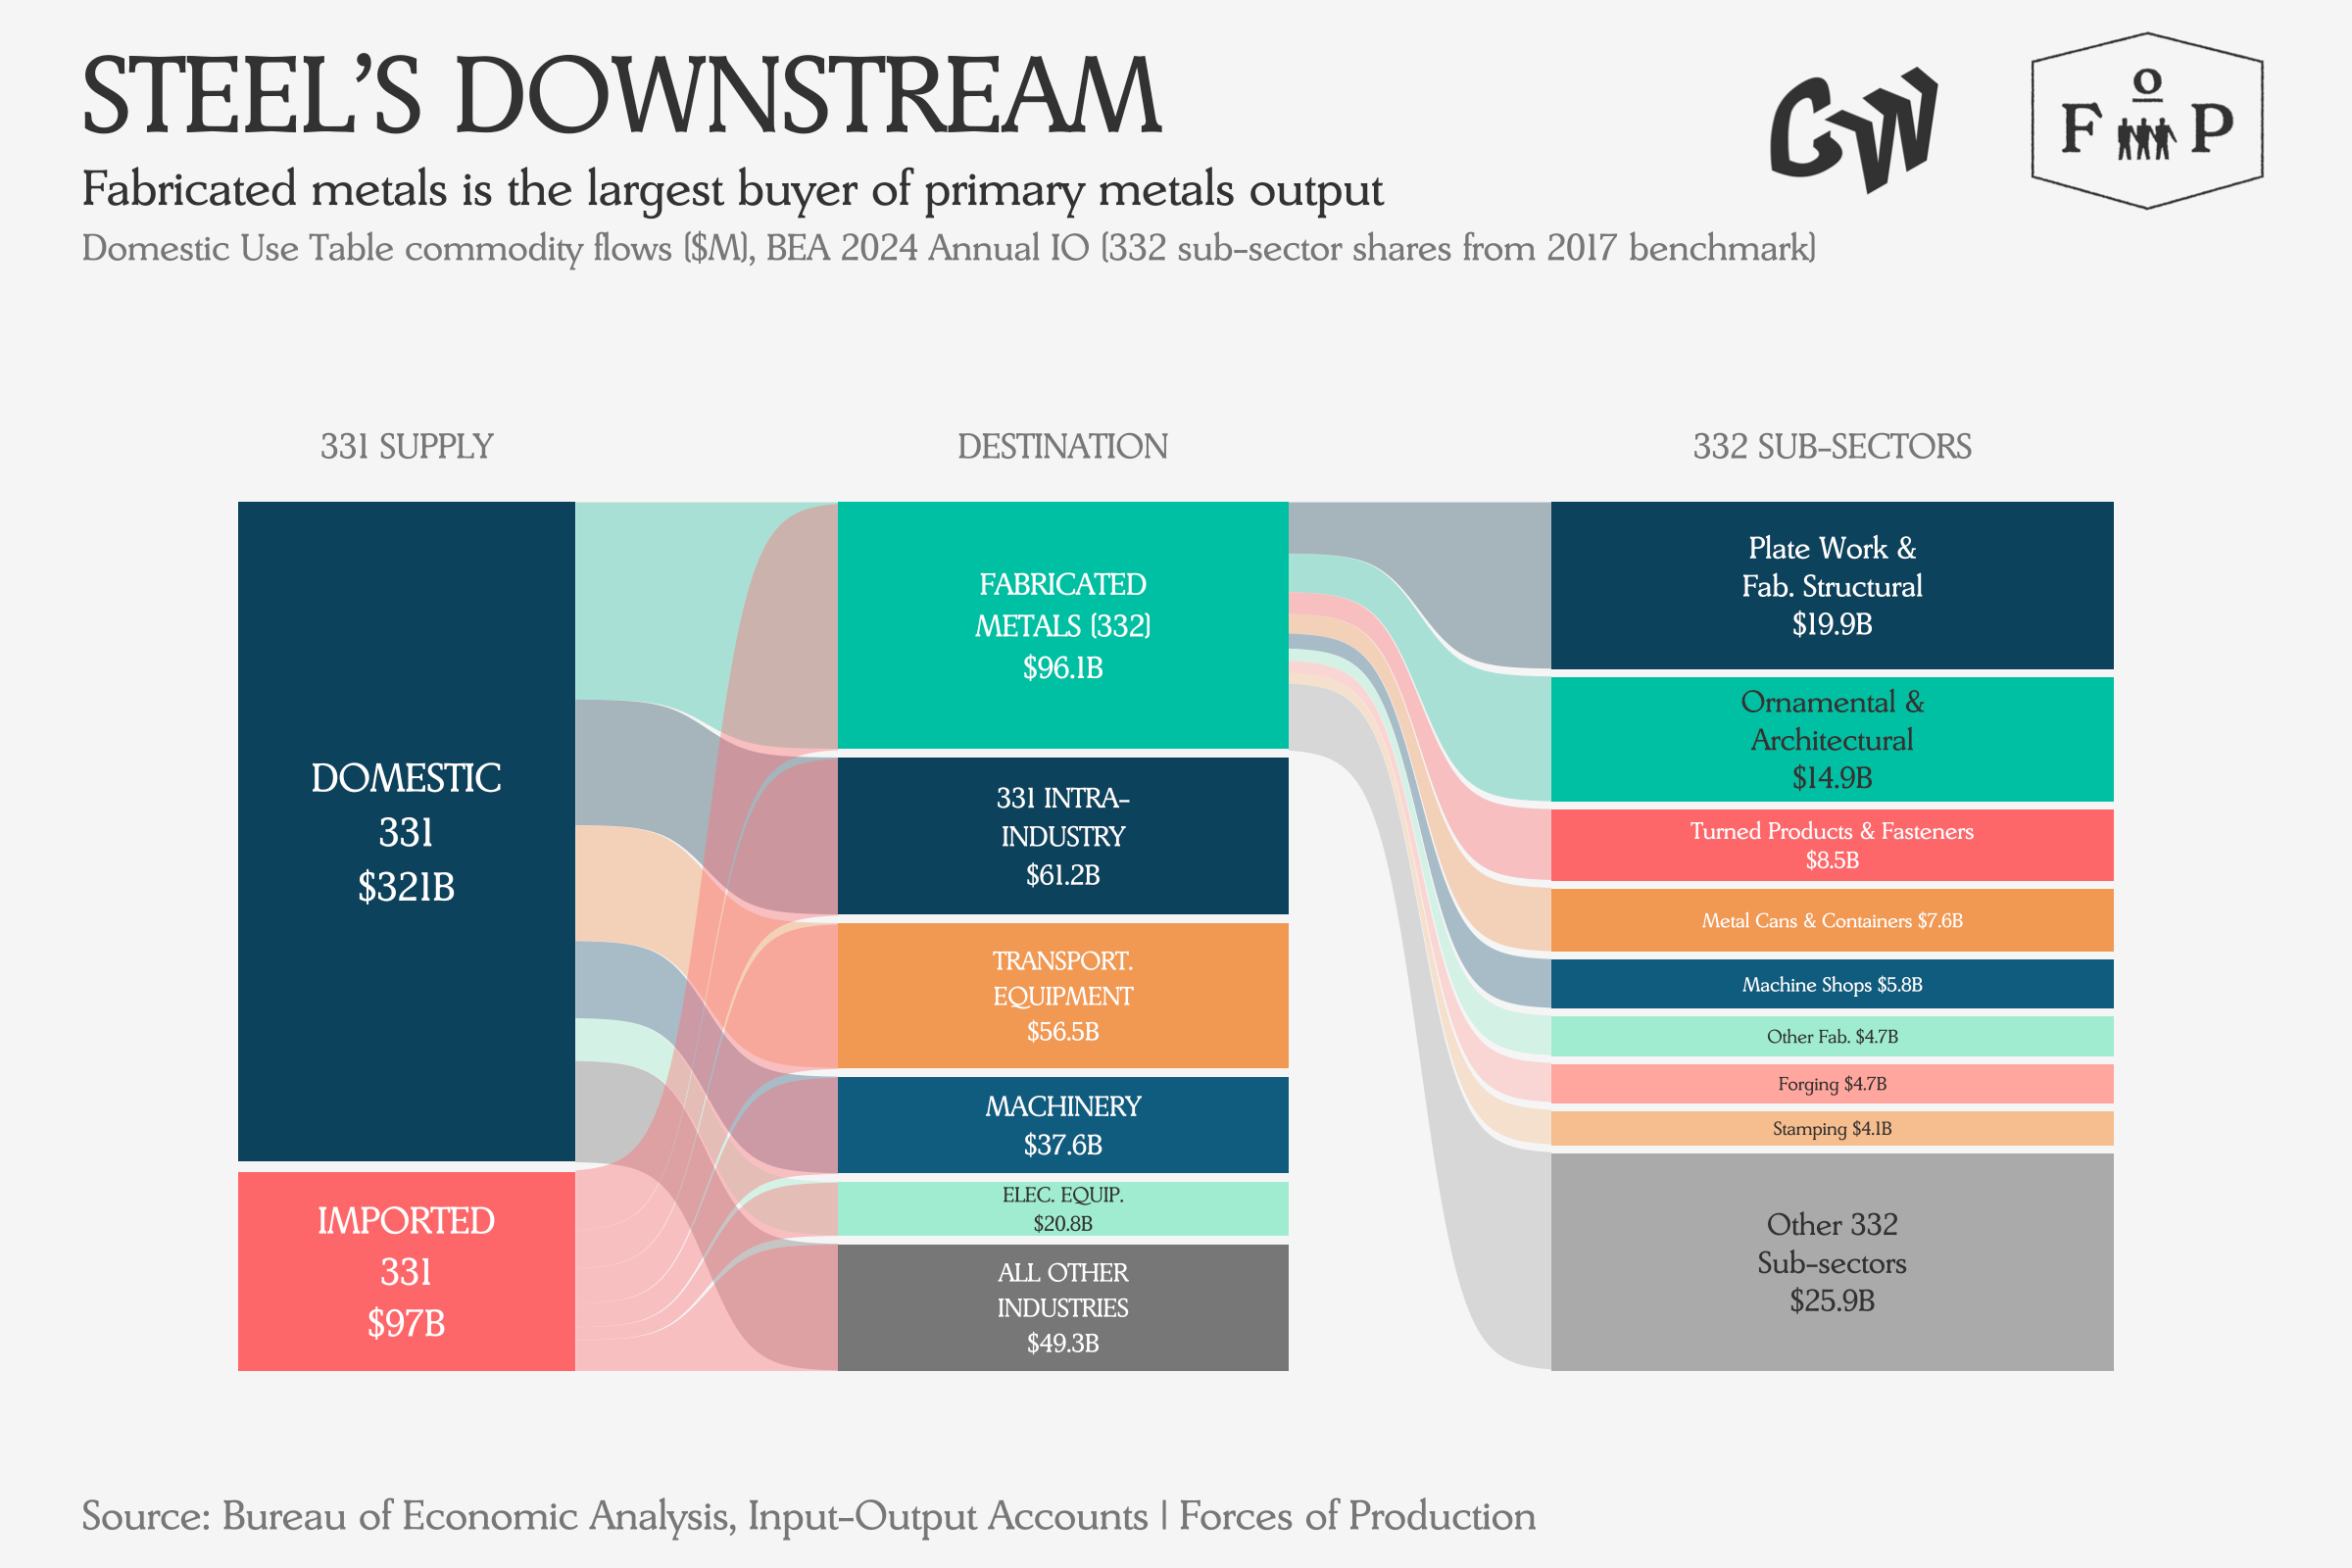
The Section 232 tariffs cover commodities primarily sold by the Primary Metals Production industry — NAICS 331, which includes iron and steel mills, aluminum smelting, and related subsectors. Who buys from 331? The single largest downstream customer is fabricated metals, NAICS 332: the 49,000 firms that turn steel plate, aluminum sheet, and metal bar stock into structural beams, pipe fittings, springs, machine parts, and hardware. Here is that flow as a Sankey diagram, roughly sized by dollar volume.
The IO tables give us a “direct requirements coefficient” for each buyer-seller pair — the fraction of each dollar of output that an industry spends on a particular input. For fabricated pipe and fittings (NAICS 332996), the coefficient for steel inputs is 0.197: about twenty cents of every dollar of output goes to buying steel. For plumbing trim (332913), it is half a cent, as trim is more often made from copper than steel. Steel intensity varies enormously across the 20 subsectors of fabricated metals.
To take a naive estimate of the tariff burden on a given sector, we can multiply three numbers: the IO coefficient for steel and aluminum inputs, the share of those inputs that are imported (and therefore subject to the tariff), and the tariff rate itself. This gives us an effective tariff cost per dollar of output — what we can call the tariff burden, measured in basis points.
These estimates are admittedly rough. The IO coefficients are from the 2017 benchmark, so nearly a decade old and measured before the tariffs were implemented. Import shares do shift and firms do substitute – especially as the Inflation Reduction Act drove investments into clean steel production lines – so, take these calculations with a grain of salt. But the order of magnitude is still an informativeway to connect macro and micro to see behind the headline numbers.
On the upstream side: ten primary metals subsectors, their Section 232 coverage, and how much of their own output they source from within the 331 Primary Metals sector.
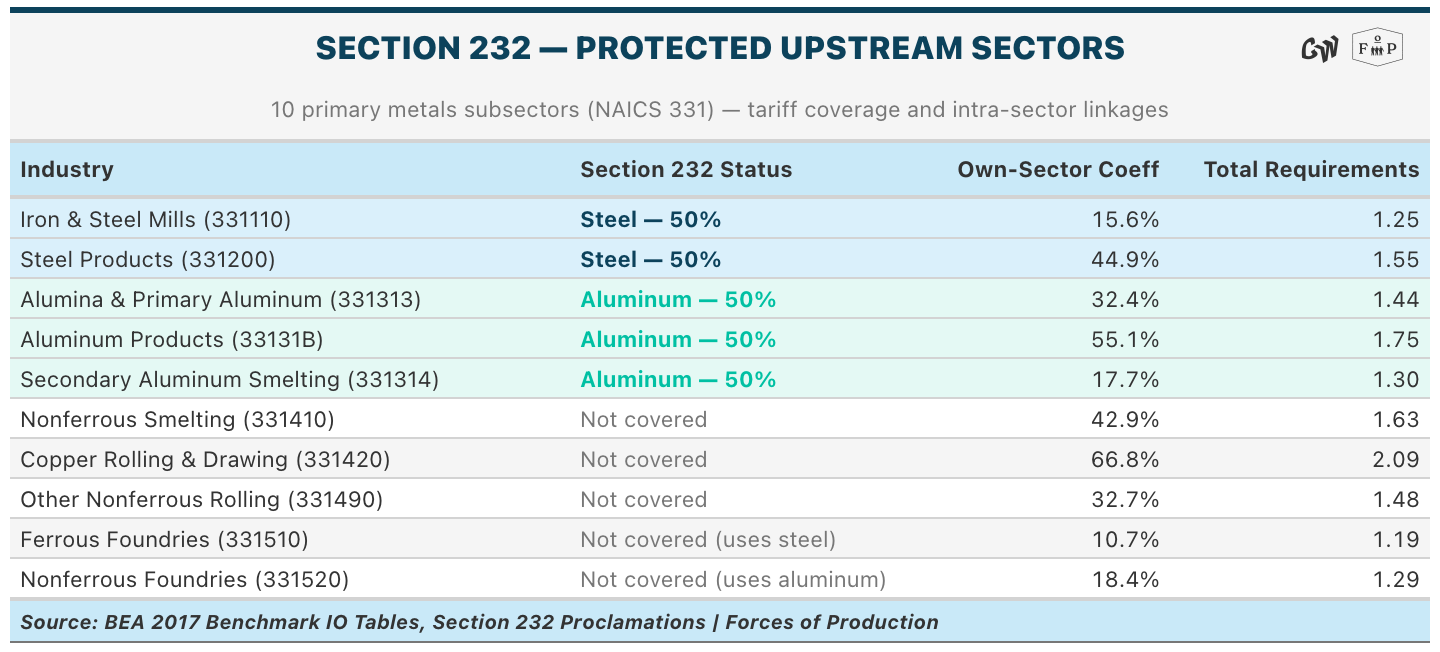
Five of these ten subsectors are directly covered by Section 232: iron and steel mills, iron and steel forging, steel wire drawing, aluminum production, and aluminum foundries are all covered at the full 50 percent rate. The remaining five — copper, nonferrous foundries, other rolling and drawing — are not covered, but do purchase from the covered subsectors, so they still likely face some amount of tariff indirectly through higher input costs. The “own-sector coefficient” column shows how tightly linked these industries are to each other: copper rolling and drawing sources 67 percent of its output value from within primary metals, though nearly all of that is untariffed copper.
And on the downstream side: the twenty fabricated metals subsectors, ranked by their estimated effective tariff burden.

The range is substantial, from 4 cents on the dollar, to four-hundredths of a cent on the dollar. Metal containers are the most exposed, driven almost entirely by aluminum content. Fabricated pipe fittings bear 356 basis points, mostly steel. At the bottom, plumbing trim bears only 4 basis points — the fact plumbing trim is largely copper means the tariff is essentially invisible in its cost structure. Between these extremes, every subsector has a specific, calculable exposure that depends on three things: how much steel and aluminum it uses per dollar of output, how much of that steel and aluminum is imported, and which of its primary metals purchases are actually covered by Section 232.
Did It Work?
None of this information can tell you whether these tariffs were a good idea. That depends on what you think they were supposed to accomplish, which is a longer conversation. What it does tell you is that “the steel tariff” is not a simple cost like a consumer tariff, nor one cost borne equally across sectors. It is a whole manifold of different costs, ranging from negligible to substantial, distributed across the economy’s production network in a pattern that the IO tables make visible and that would otherwise be invisible.
These are the kinds of cross-industry impacts that need to inform policy, especially as we confront the challenge of decarbonization. In essentially every case, the real work of decarbonization is to bring down the carbon output of a sector by swapping in different equipment. How this work is sequenced and flows through the existing productive structure is critical to its short and long term success.
This Month’s Data
This last month saw new GDP data, in addition to the usual data for employment, prices, production, and trade. But first, before the charts, the key takeaways.
Key Takeaways
2025Q4 GDP has come in soft due to the government shutdown, but the continued growth in consumer spending, especially on services, means the macroeconomy in 2025 did not run into any of the “sudden stops” many commentators had expected.
Instead, there was a simple and steady degradation of the growth outlook, as investment narrowed to a small number of “winner” sectors while the labor market continued to downshift on hiring, with hires rates approaching early-2010s Great Recession lows.
Services continue to drive economic growth, in both low-margin sectors like Health Care, and high-margin sectors like Software. It would be interesting to dig in on recent rule changes that have increased the share of software work that can be counted as capital expenditures, rather than operational expenditures, to see how much that is changing the measured composition of the boom in spending on large language models and other AI-related software.
The Iran war is already showing up as an inflationary energy shock, as oil, gasoline, and especially diesel prices have ramped up in recent days. The question now is how long the disruption will last for, and what the knock on effects will be.
For context, a geostrategically significant amount of global oil and gas flows through the strait — roughly 20 percent of daily global supply — and in order for markets to balance if the strait remains closed, we will probably have to see prices go above $200 a barrel to see durable demand destruction at the scale of 20 million barrels per day. Oil hovered around $120/barrel in the late 2000s on strong global commodity price growth. It briefly touched the $130s during the 2022 shock, which only represented a disruption of 1-2 million barrels per day. Already, since I have started drafting this newsletter edition, oil has moved from around $60/barrel to almost ping $120/barrel spot in overnight trading. This has started pulling up the oil futures market as well as the market begins reckoning with how long the war will last.
If they don’t sort this one out, there may not be much else to talk about besides oil in next month’s issue.
GDP
Headline GDP growth fell to 1.4 percent annualized in Q4, down sharply from 4.4 percent in Q3. The single largest drag was the federal government, which subtracted 1.15 percentage points from growth as the shutdown drove a 16.6 percent annualized plunge in federal government consumption and investment for the quarter. Absent the shutdown, growth would land around 2.5 percent — not spectacular, not weak, but a step down from stronger mid-year growth.
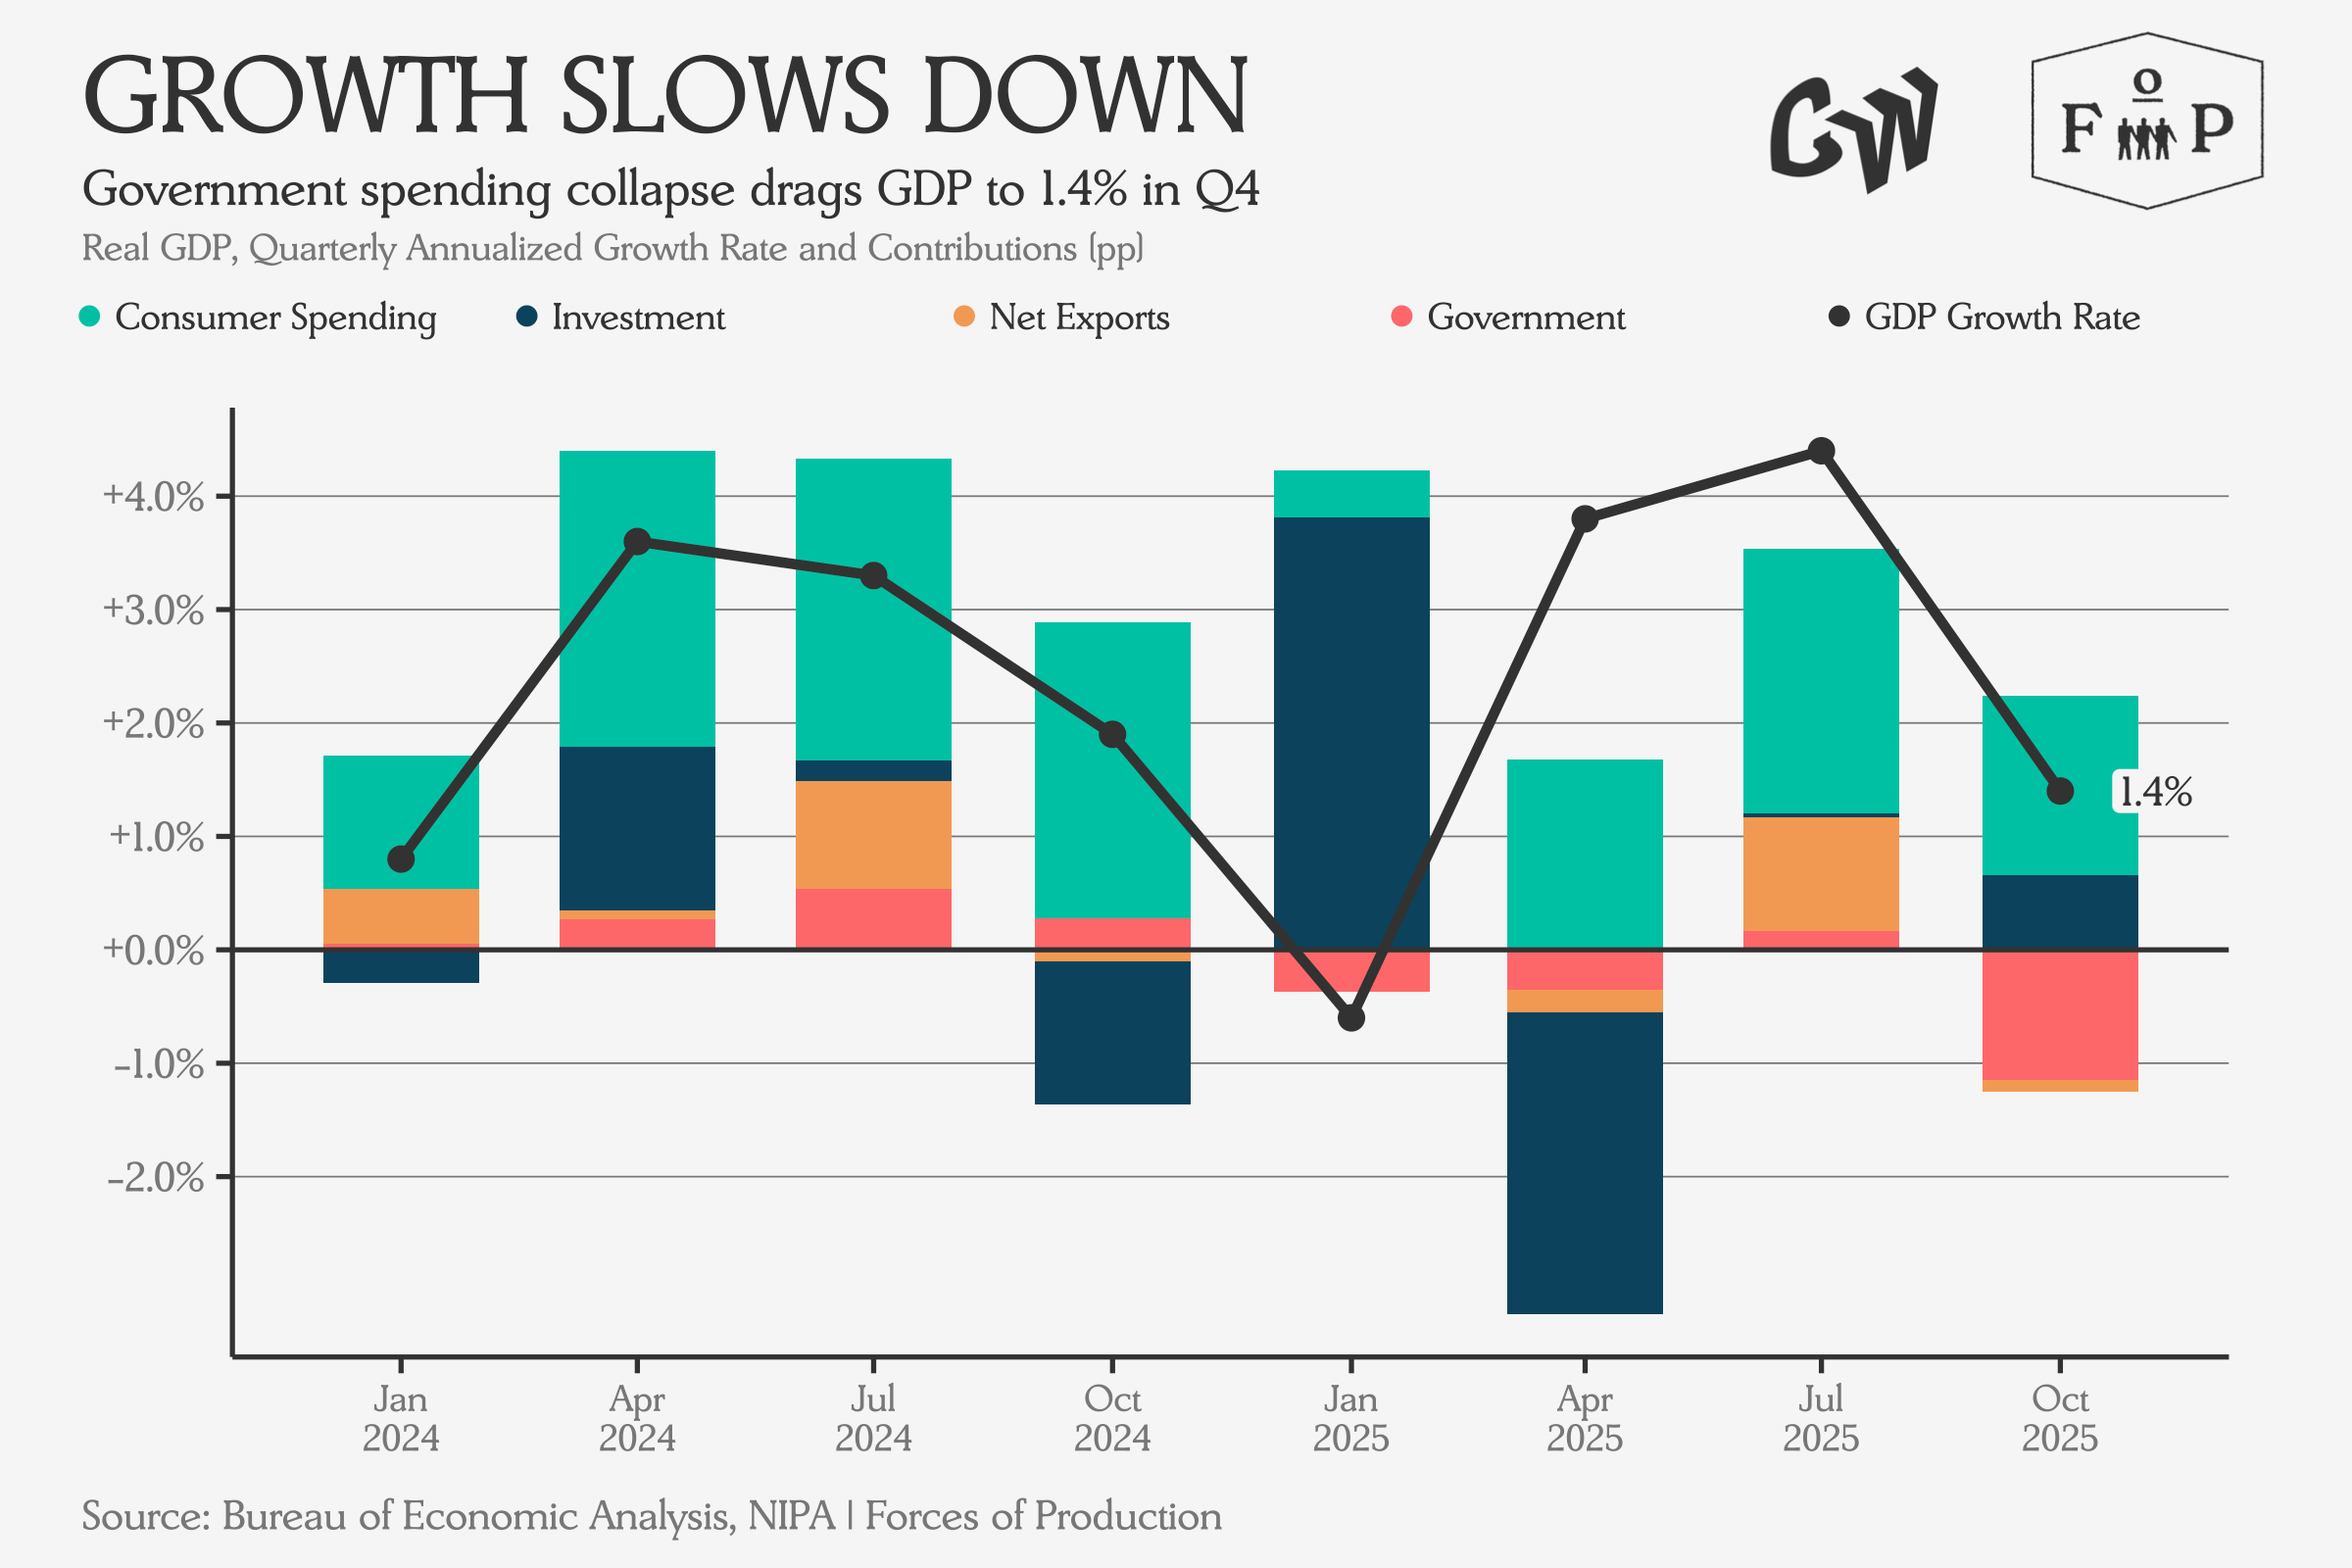
Consumer spending growth held steady at 2.4 percent, contributing 1.58 percentage points to headline growth. Almost all of it came from growth in services (+1.59pp); goods spending contributed essentially nothing (-0.01pp). This is in line with what we have been seeing for most of 2025: the consumer economy runs on services, not stuff. Net exports were roughly flat (+0.08pp). Inventories added 0.2 percentage points. Full year 2025 growth came in at 2.2 percent, a step down from 2.8 percent the year before. Investment in intellectual property products grew 7.4 percent, the strongest component by far, driven by AI-related software and R&D, while equipment investment grew a more modest 3.2 percent. Structures contracted for the eighth straight quarter at -2.4 percent, and residential investment fell 1.5 percent, declining in all four quarters of 2025. The investment mix continues to narrow in recent quarters: intellectual property products and equipment carry the total, while construction — factories and housing alike — continue to contract. This narrowing is broadly in line with the slow slide in investment we flagged as likely last month.
Industrial Production
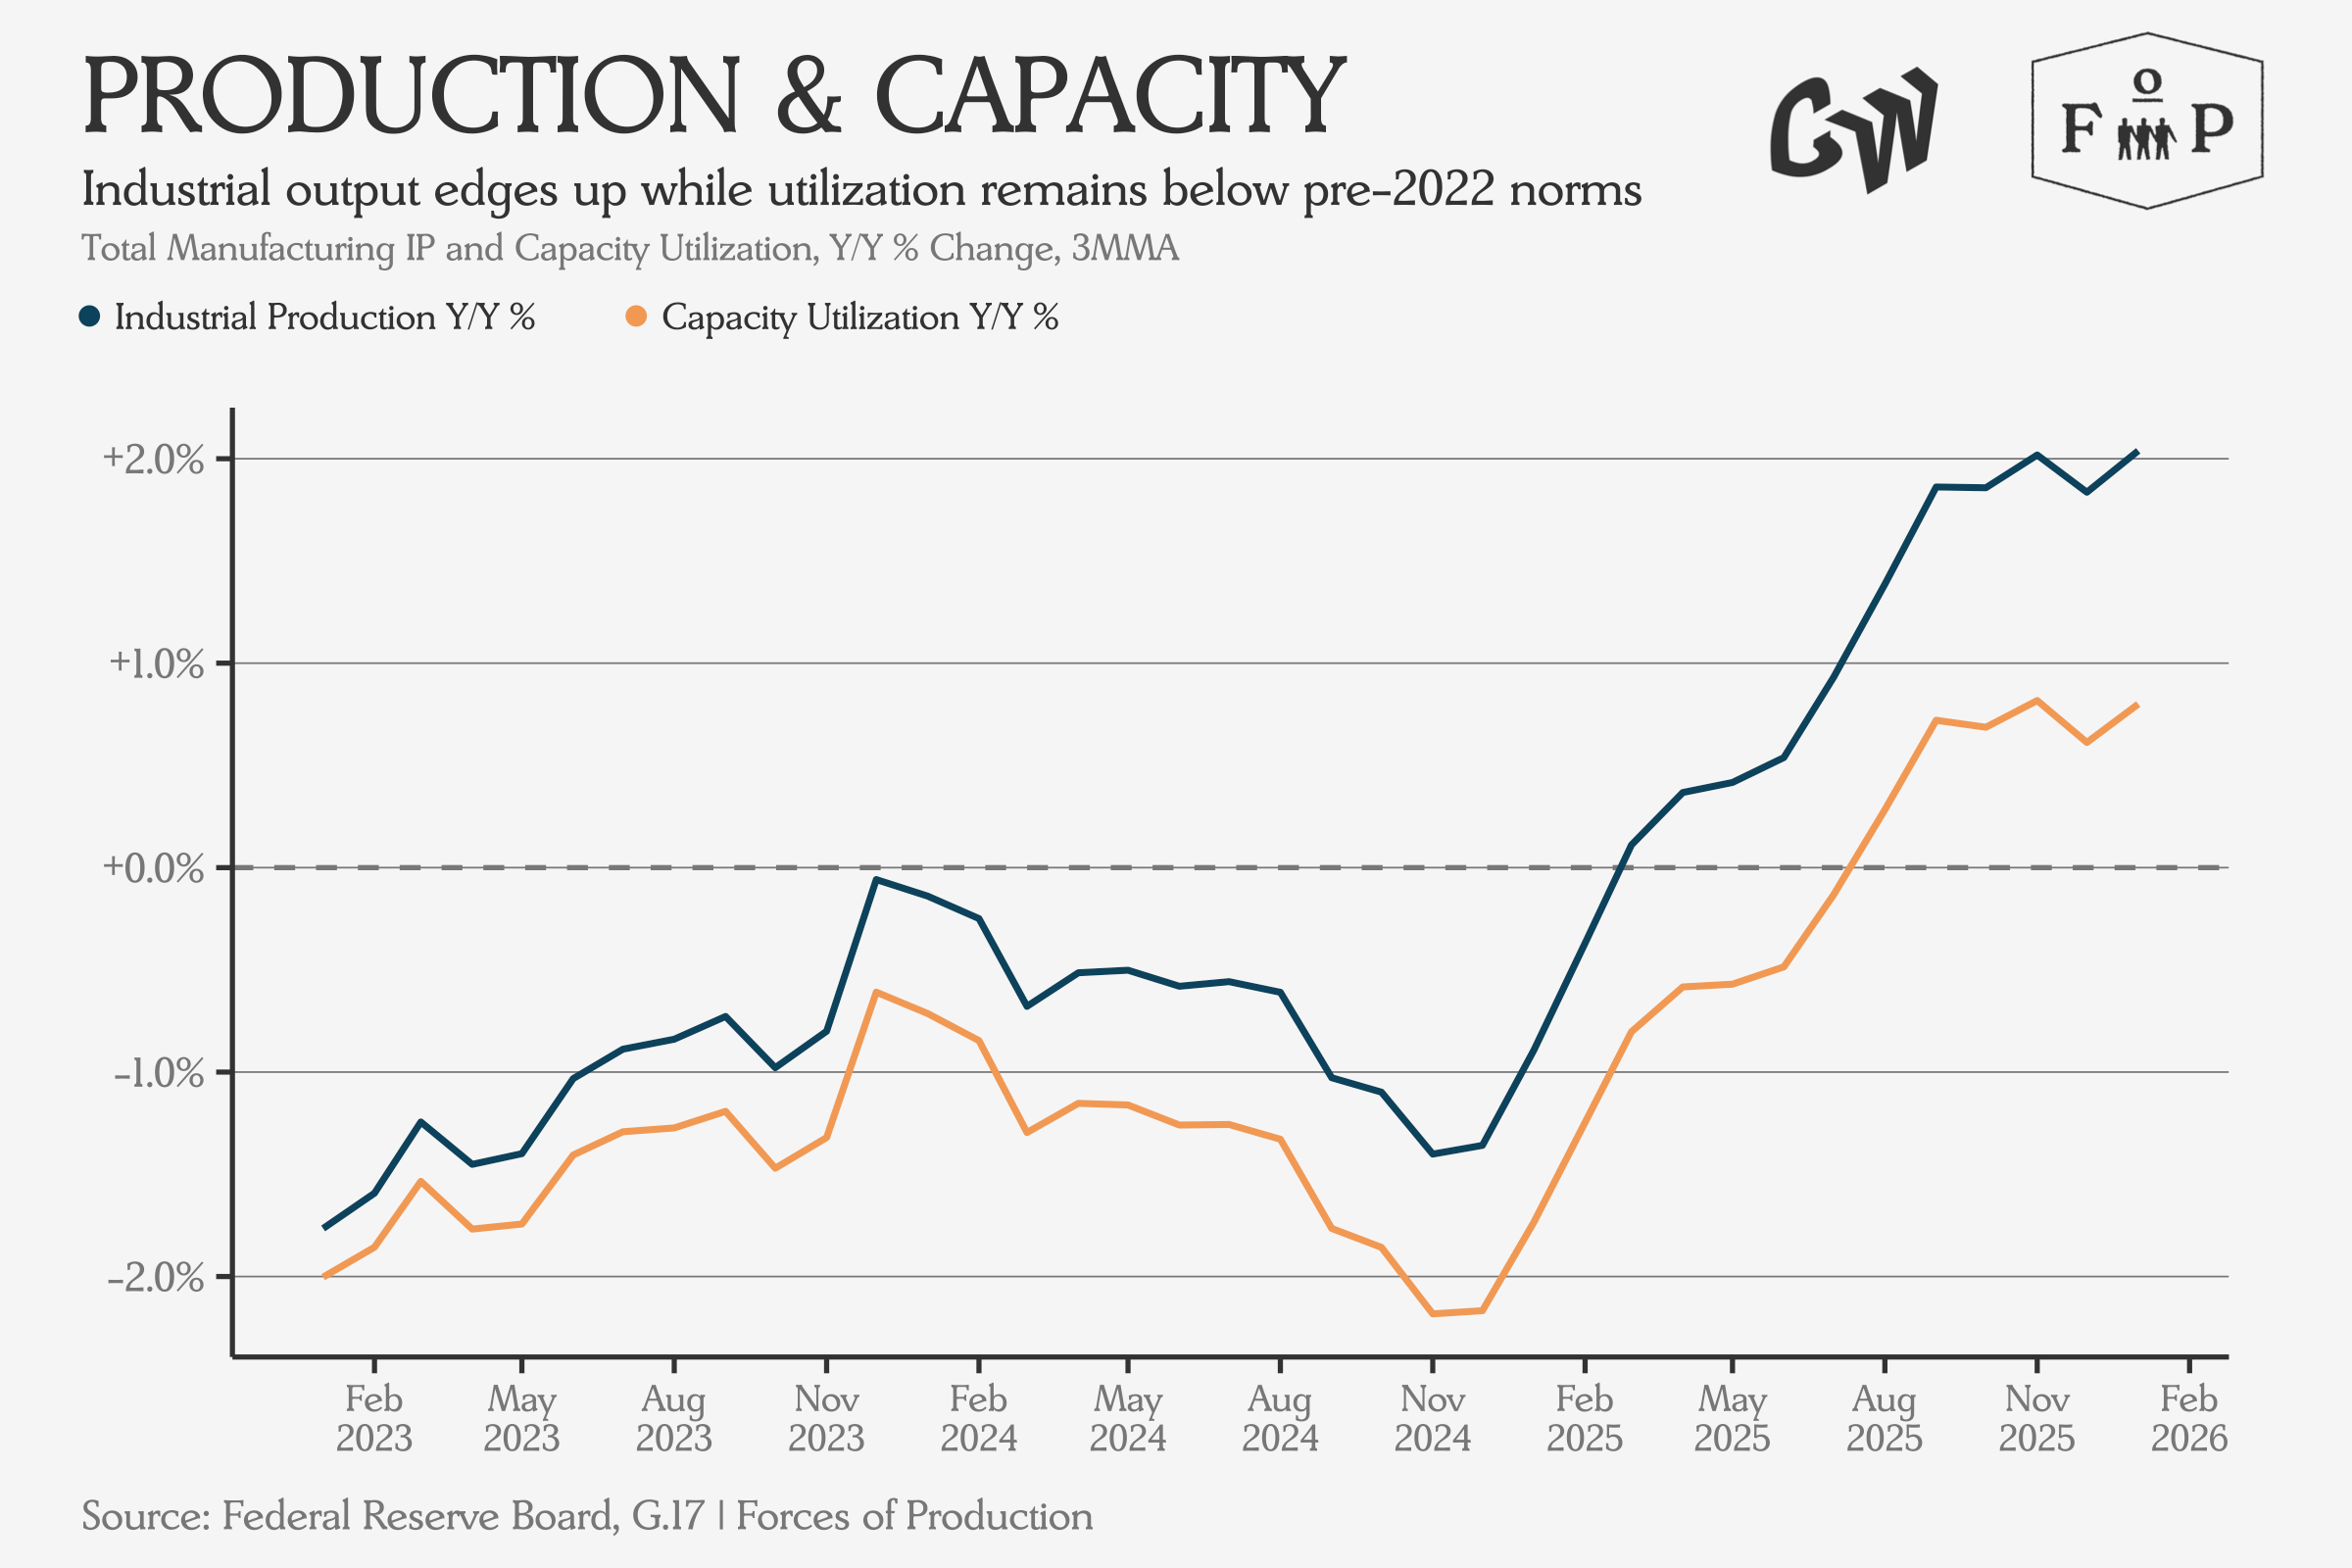
Industrial production continues to grow in the most recent data, though capacity utilization still lags, and has only just begun growing in the last six months, after years of contraction.
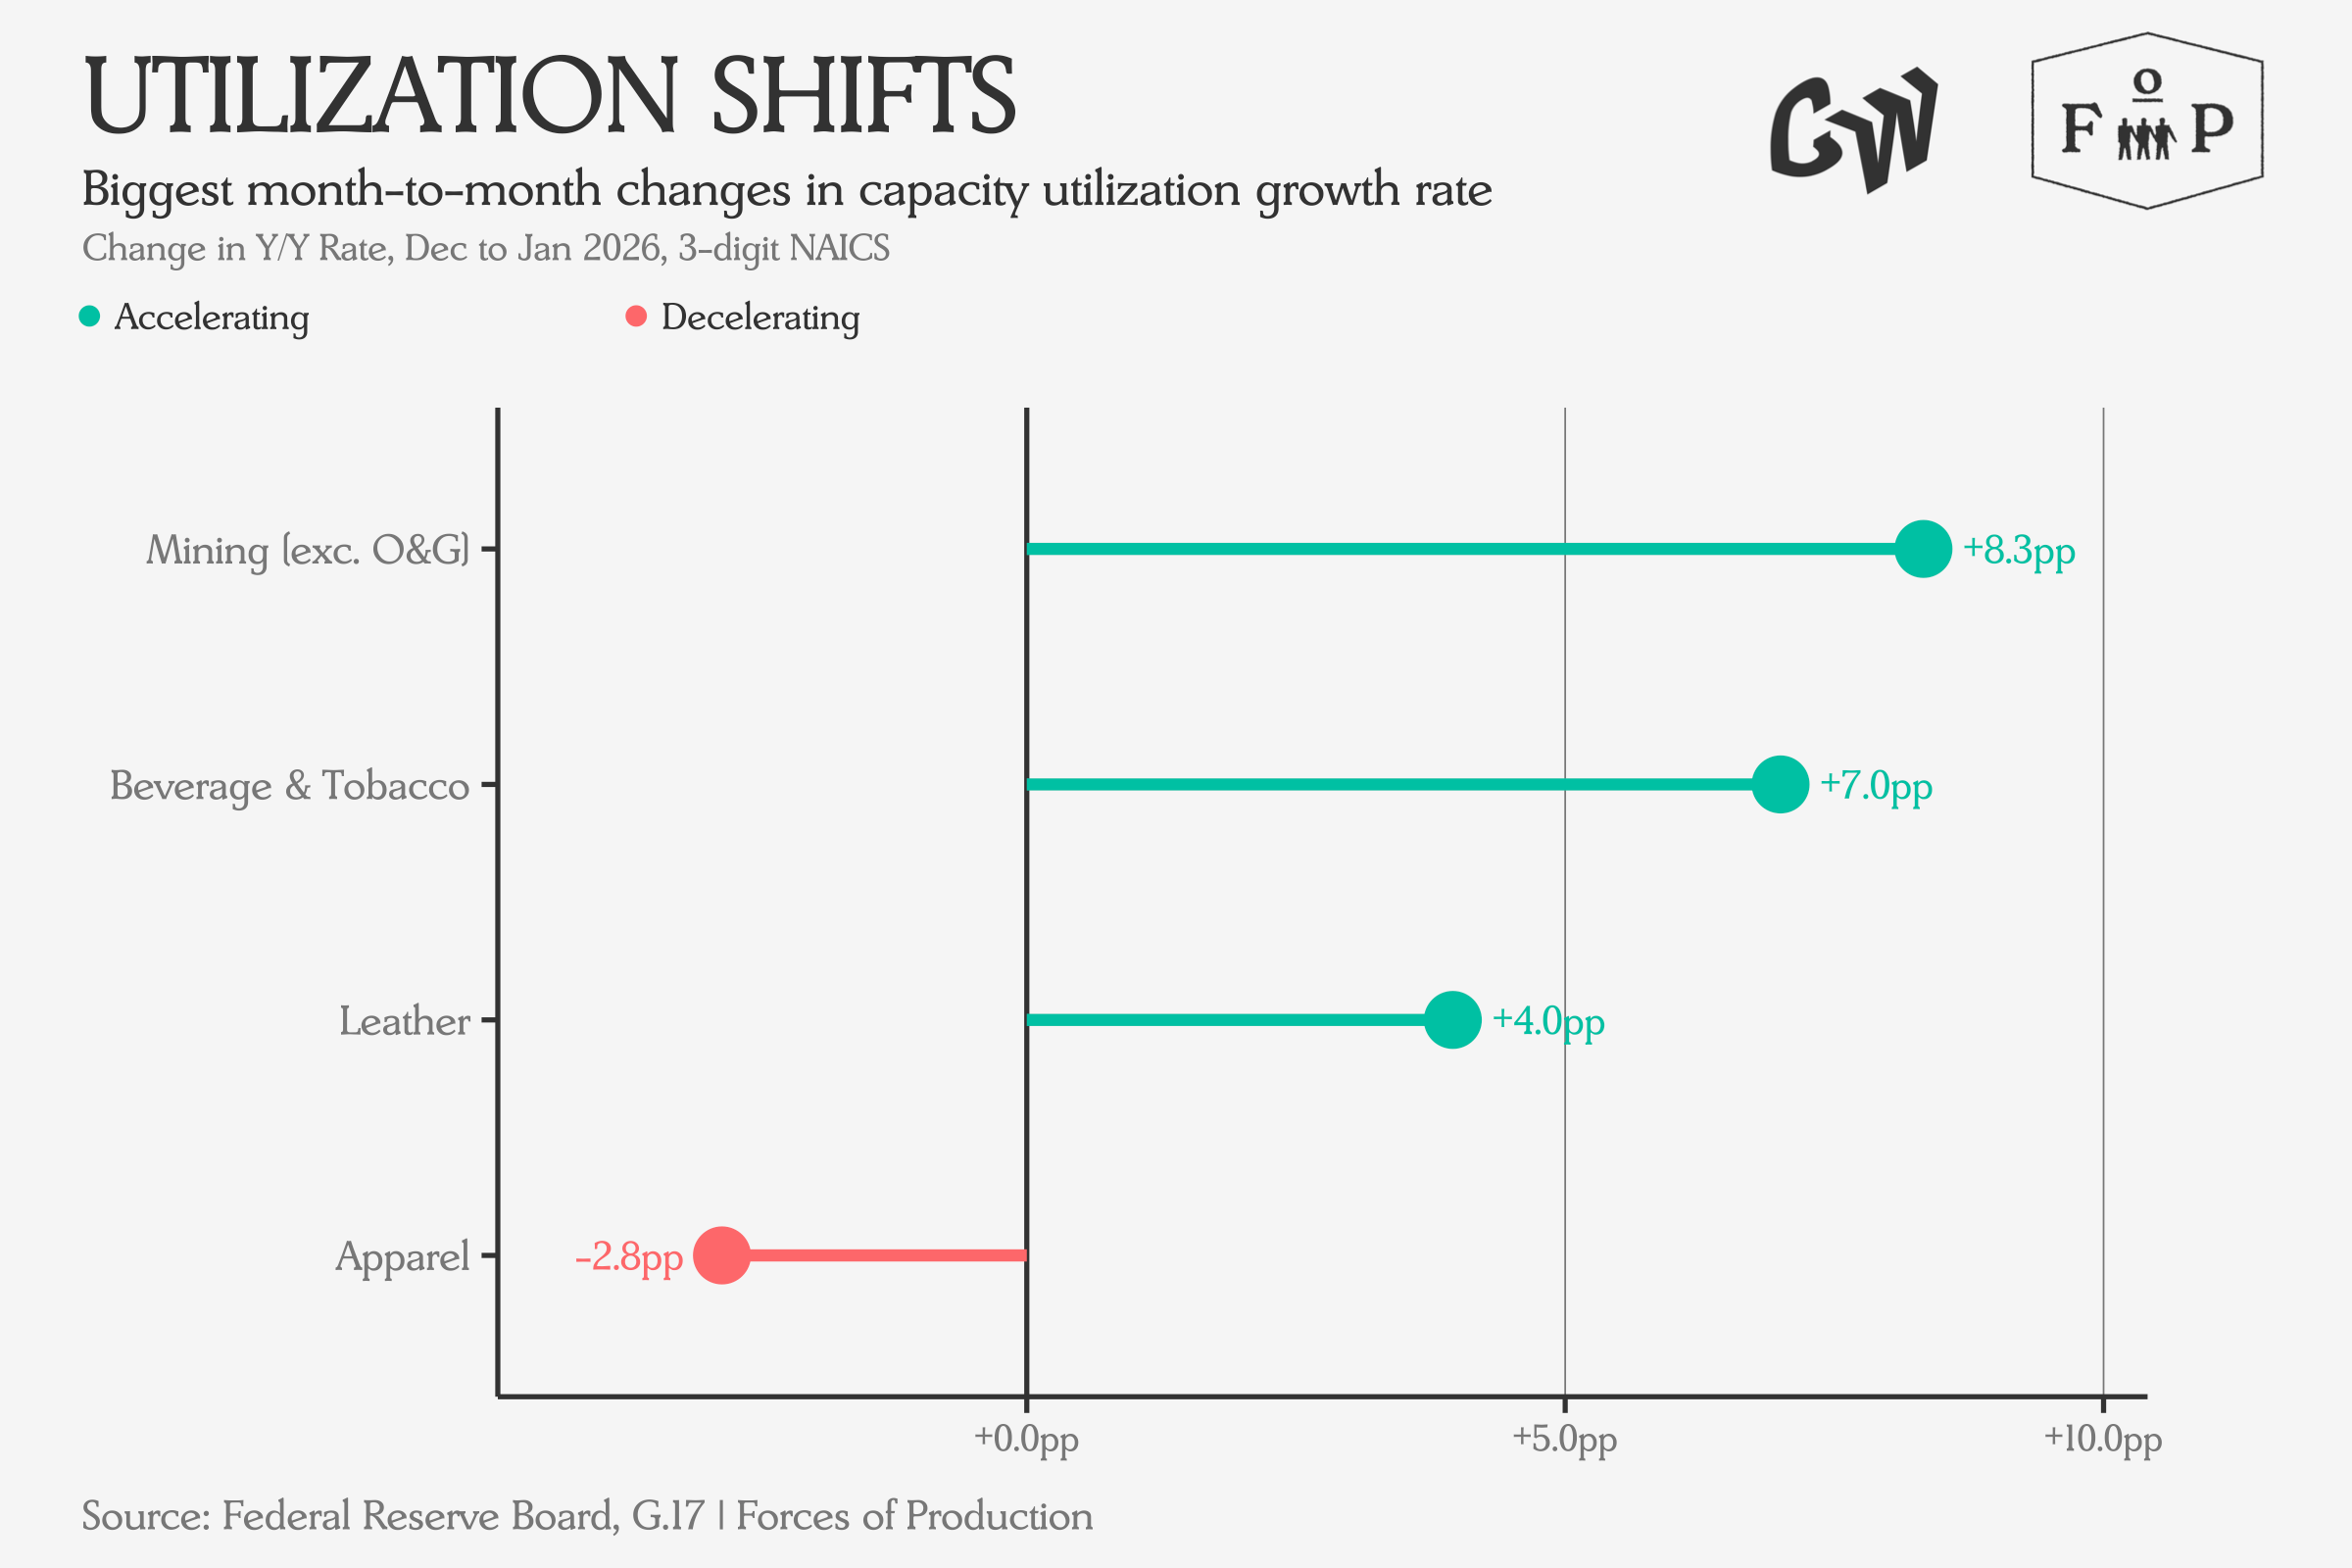
Capacity utilization shifts were mostly positive: mining ex oil and gas accelerated by 8.3 percentage points, beverages and tobacco by 7.0. Apparel was the notable decline, losing 2.8 percentage points of output year-over-year.
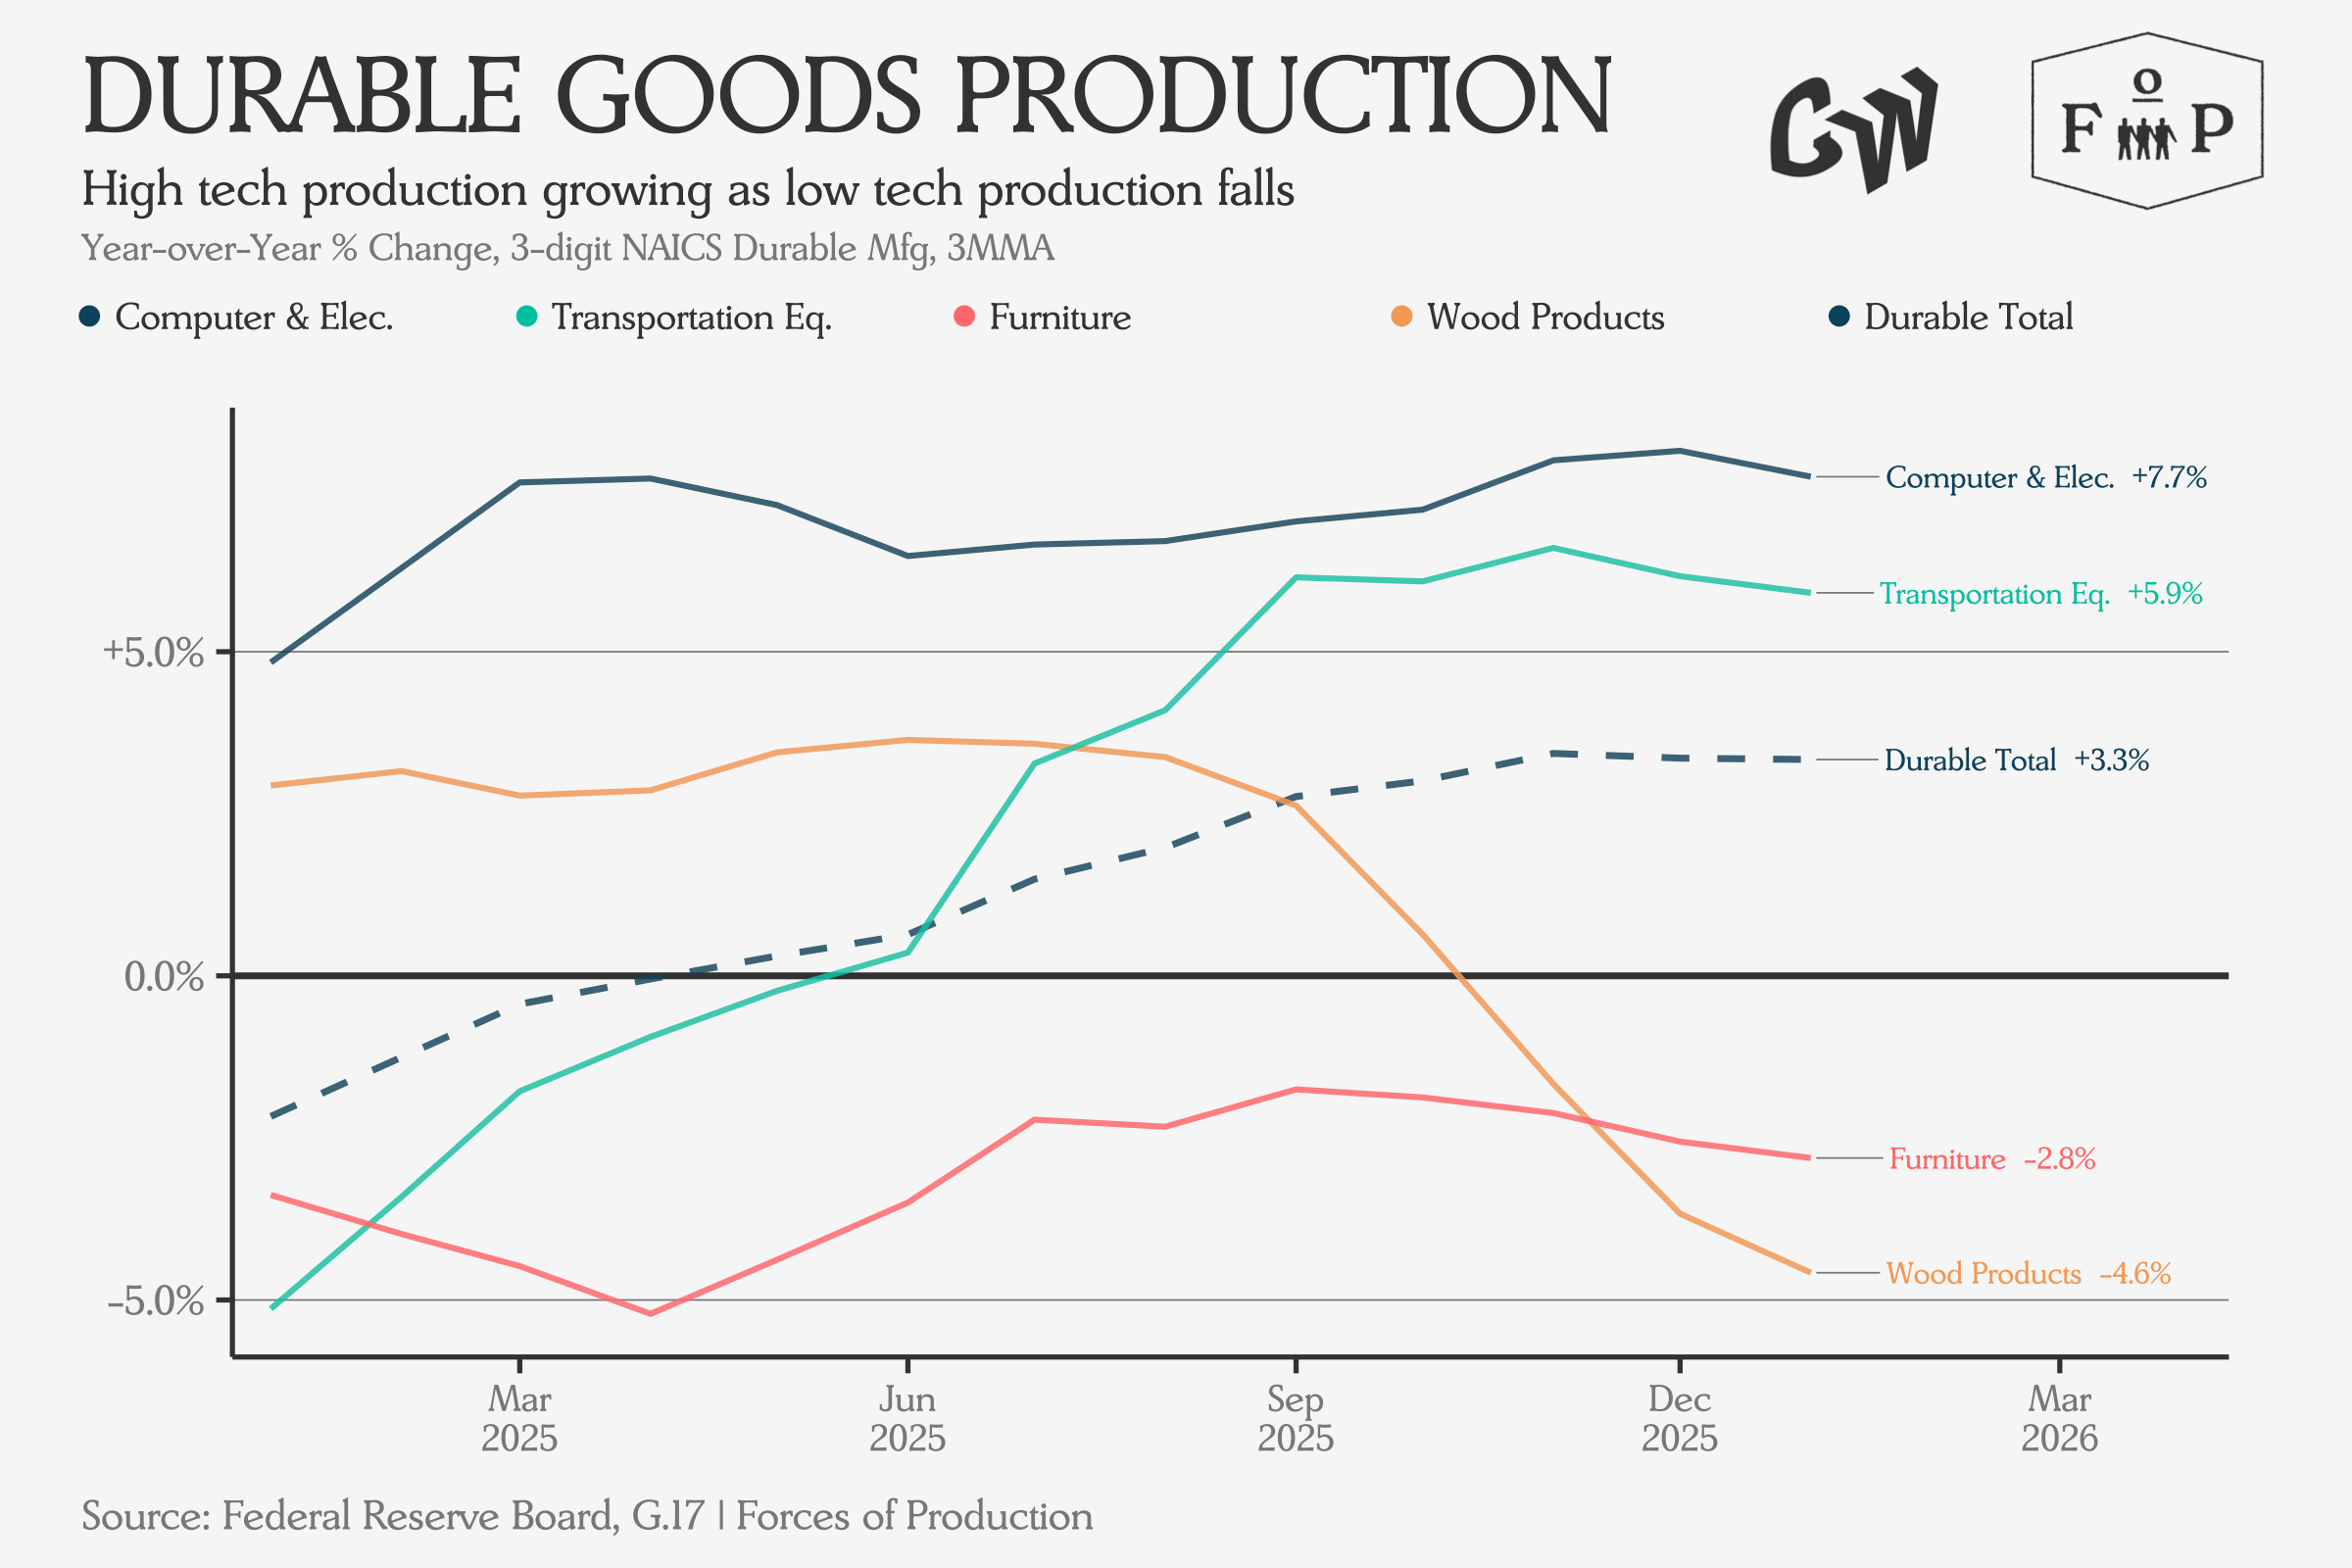
The charts below rank every 3-digit manufacturing sector by year-over-year output change and pull out the top and bottom two. Among durables, the winners are the high-tech, heavy-duty end: computers and electronics up 7.7 percent transportation equipment up 5.9 percent. The losers are the lower-tech end: wood products down 4.6 percent, furniture down 2.8 percent.
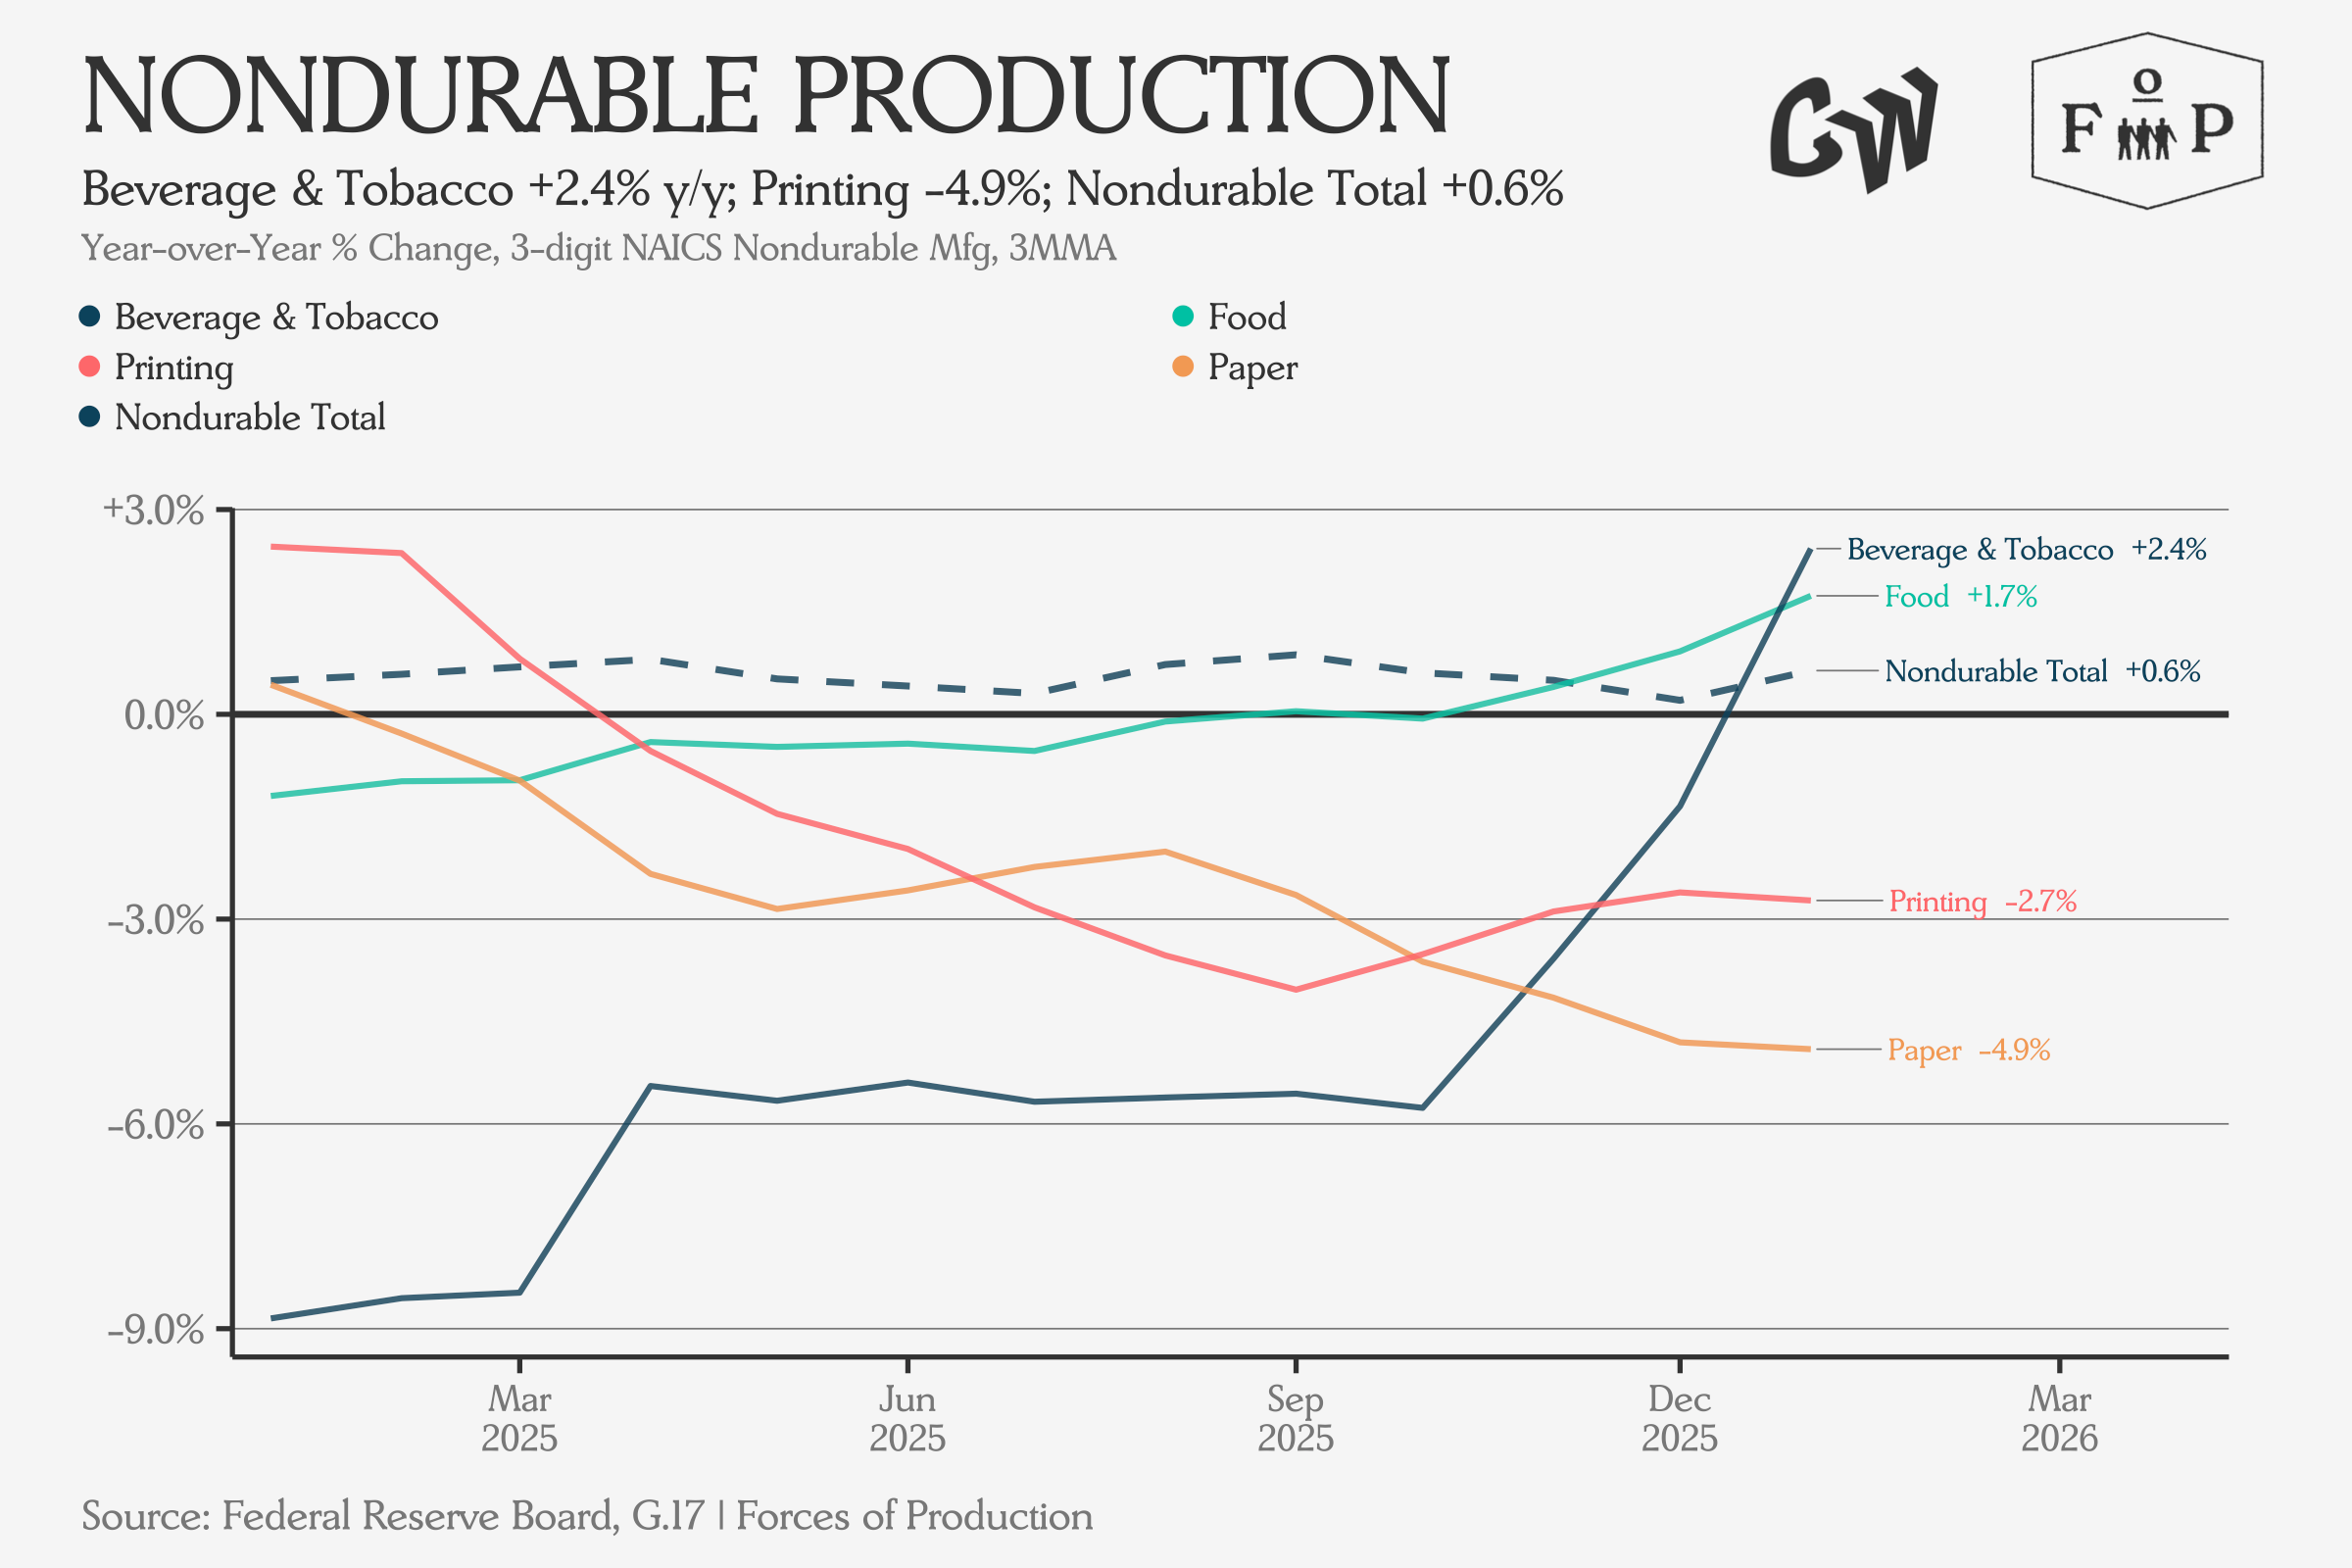
Nondurables tell a bleaker version of the same story. The aggregate is barely positive at +0.6 percent. Paper is down 4.9 percent, printing down 2.7 percent. Only beverage and tobacco (+2.4%) and food (+1.7%) managed to stay above the zero line. The production recovery, such as it is, belongs entirely to durables.
Employment
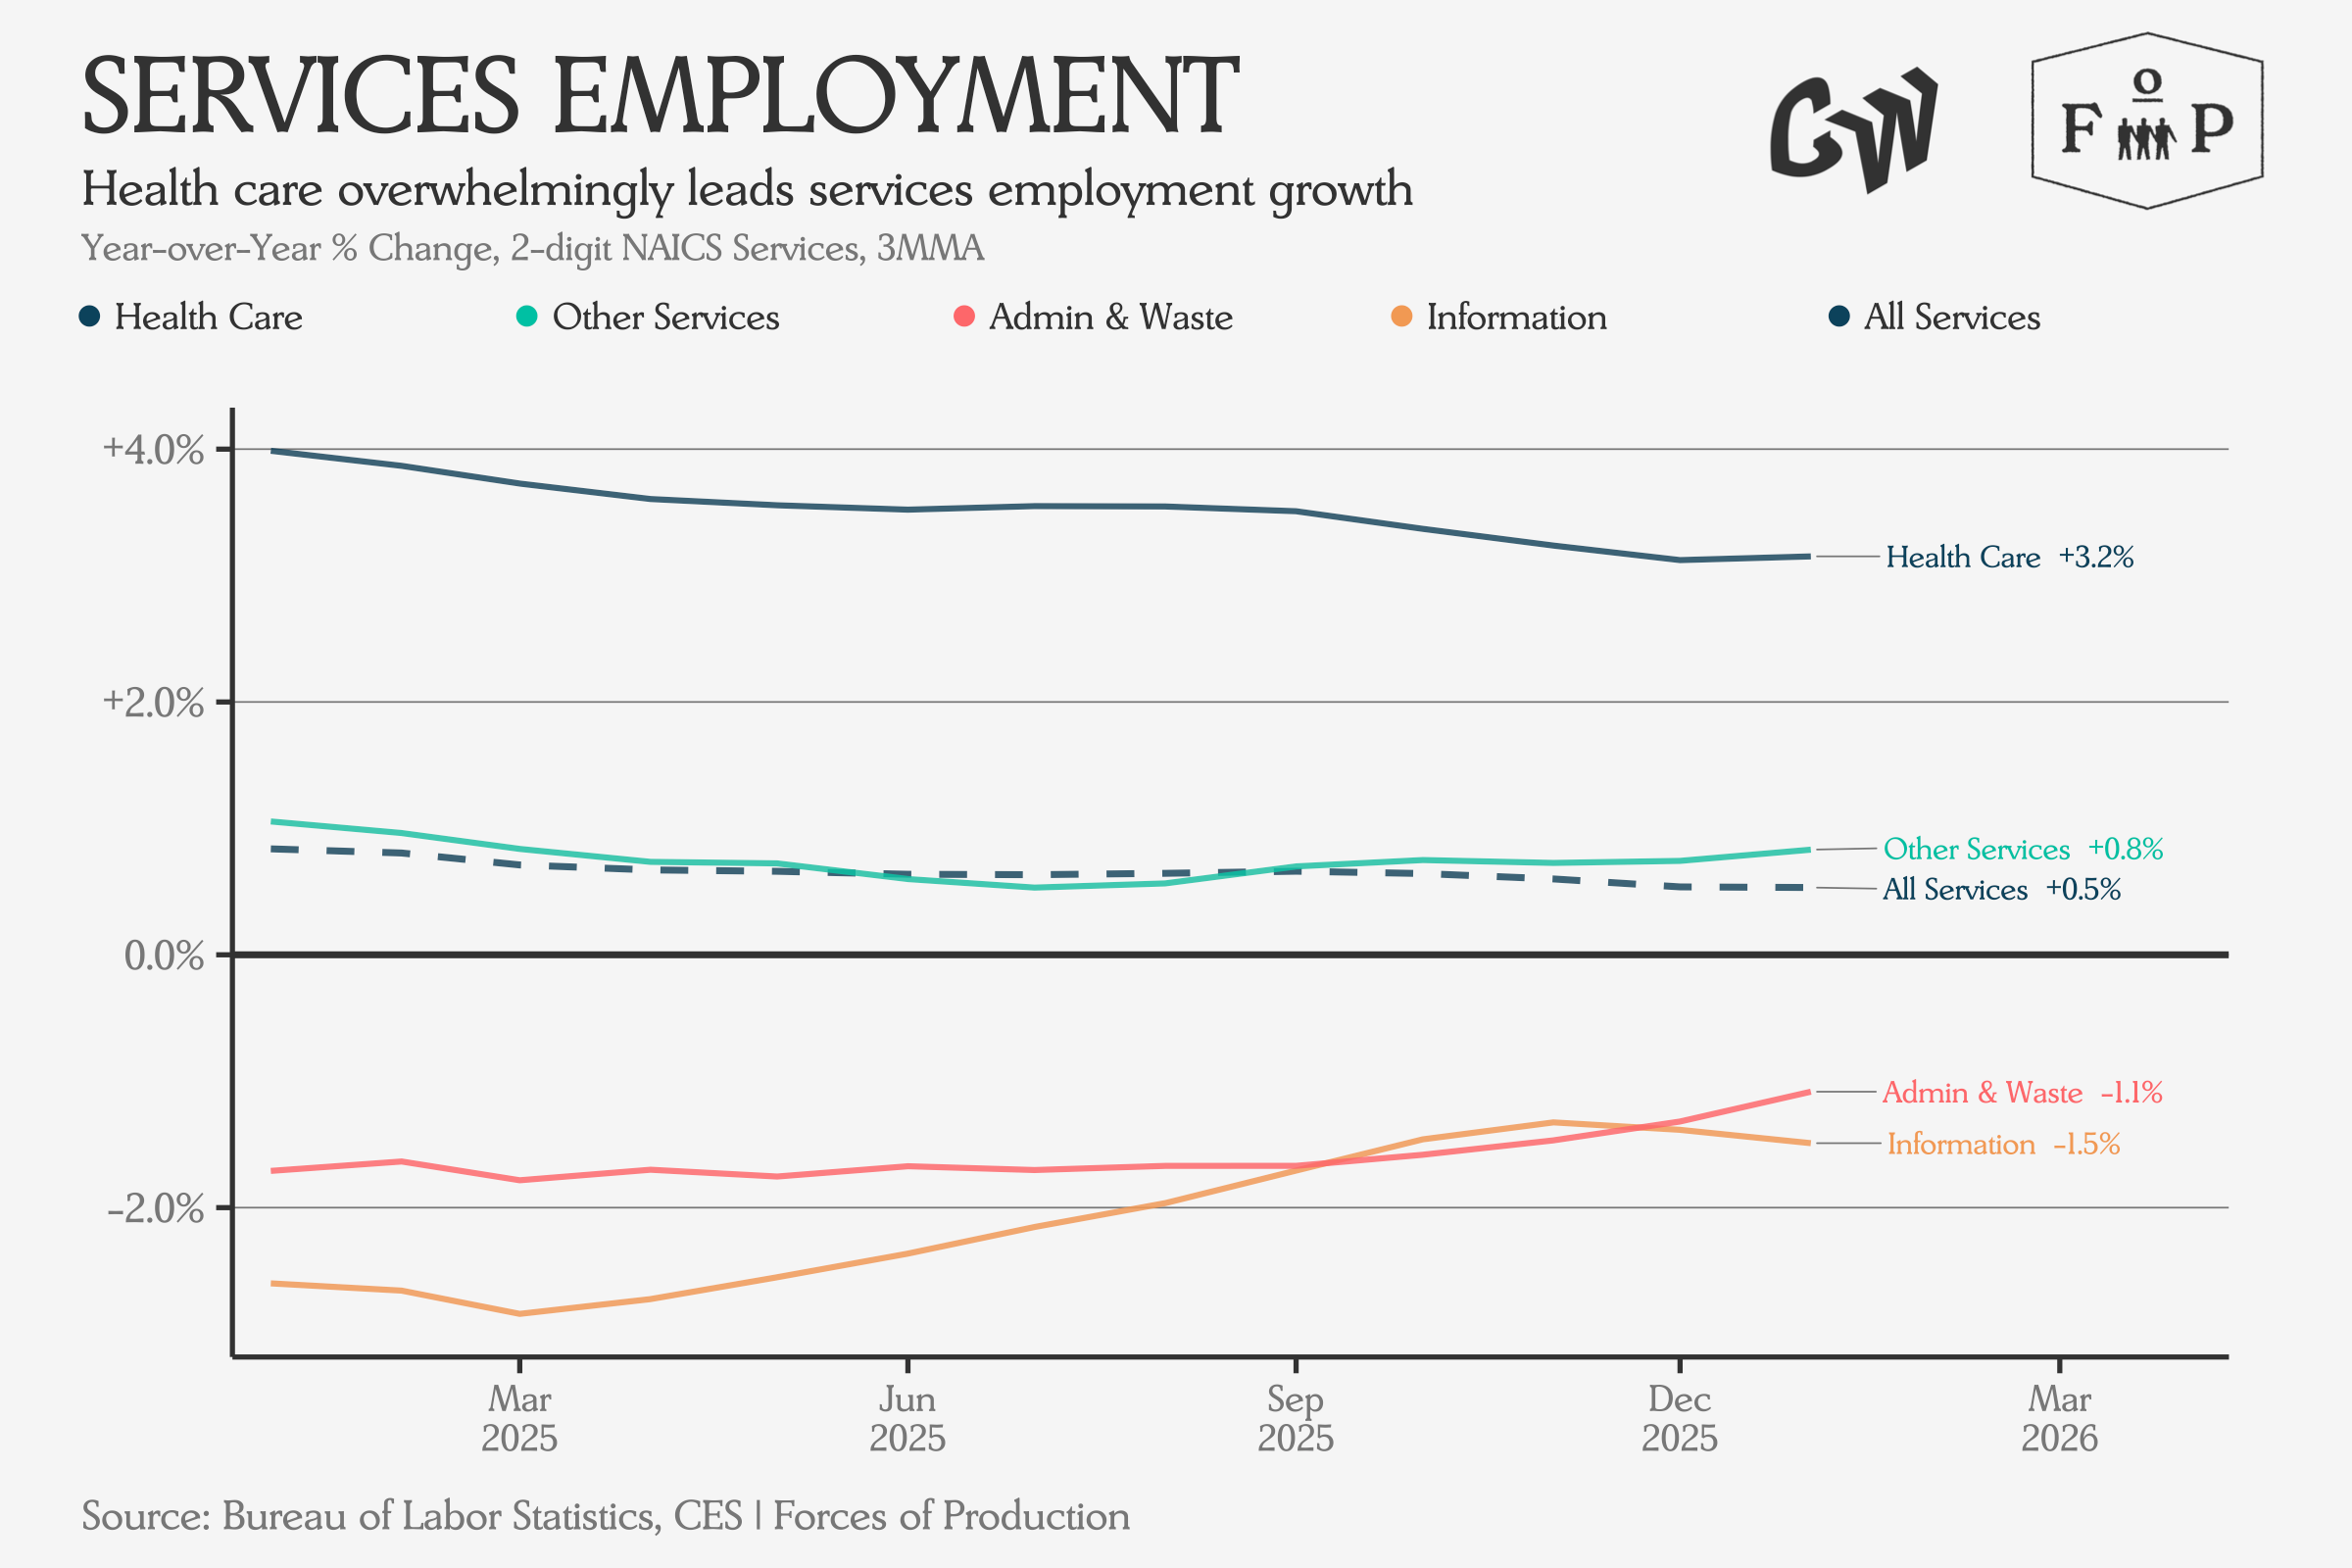
The employment picture is largely the same story as last month. Ranking all 2-digit services sectors by year-over-year employment change, health care continues to lead at +3.2%, with other services growing at a more subdued +0.8 percent. The services aggregate grew 0.5 percent. At the bottom, information shed 1.5 percent and administrative and waste services lost 1.1 percent of its employees — both sectors that have been contracting for months.
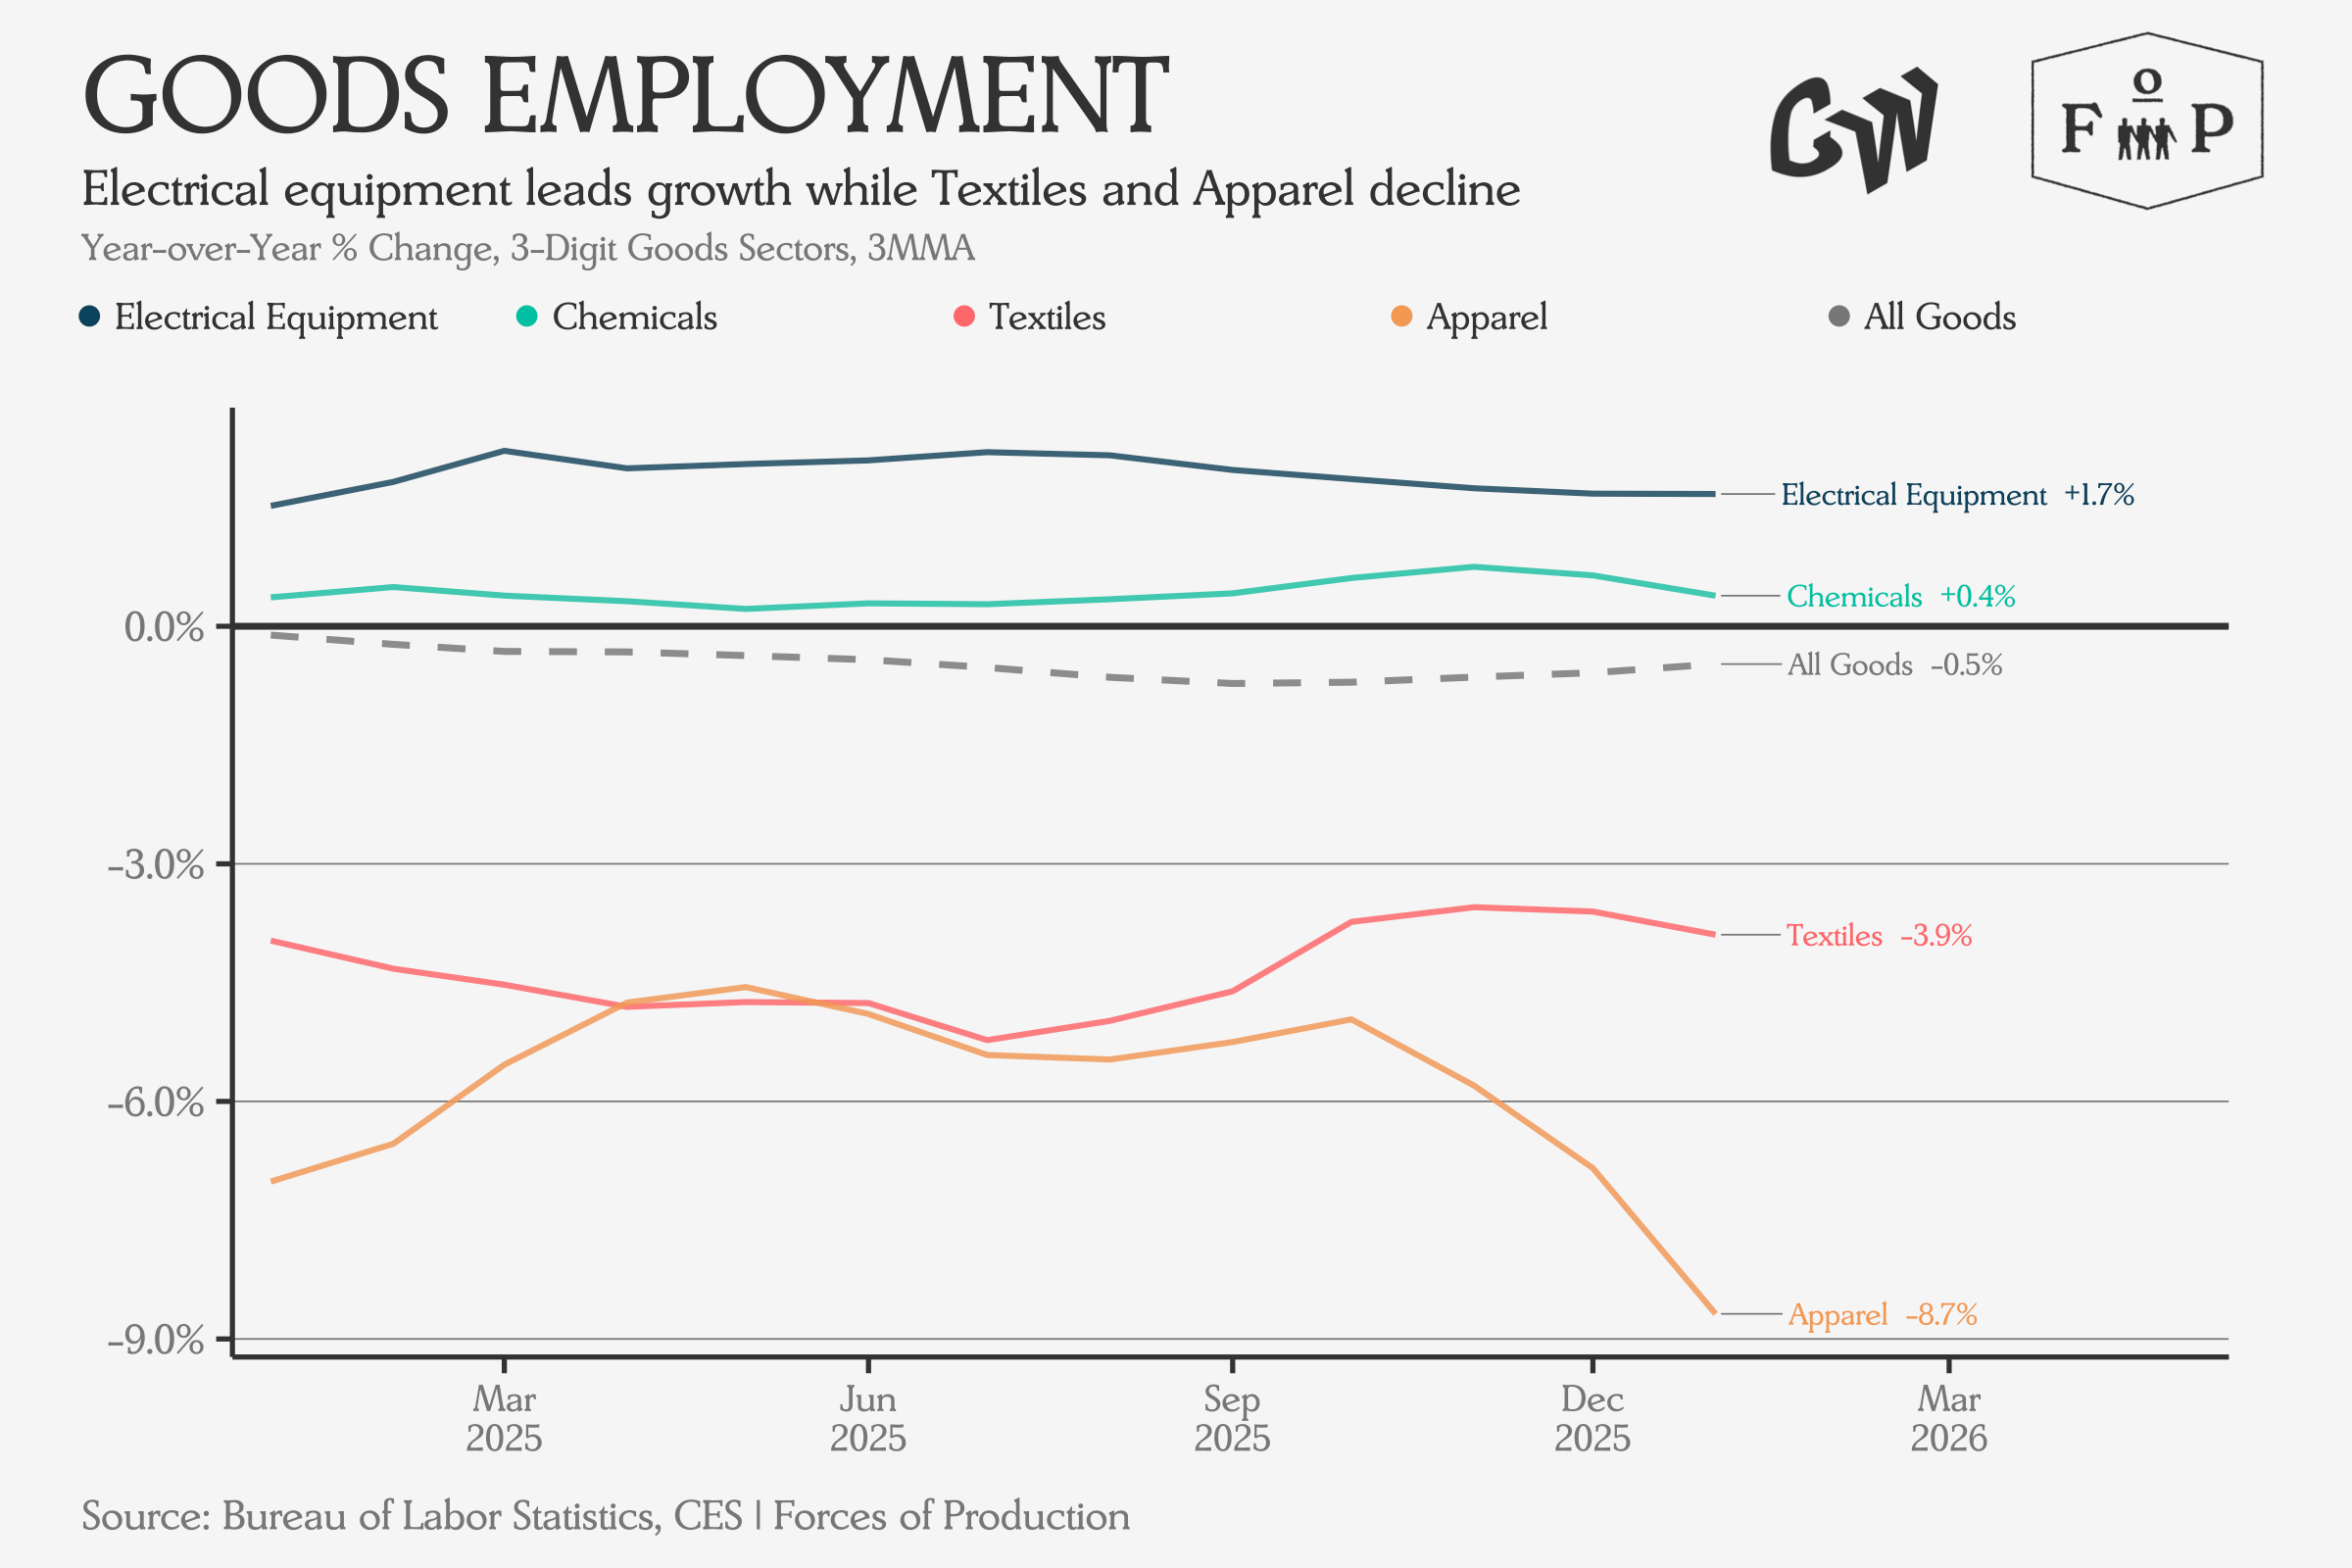
On the goods side, manufacturing employment is essentially flat year-over-year, with construction leading at +1.2 percent. Mining and logging continue to contract.
Overall, no major surprises in the January data.
Producer Prices
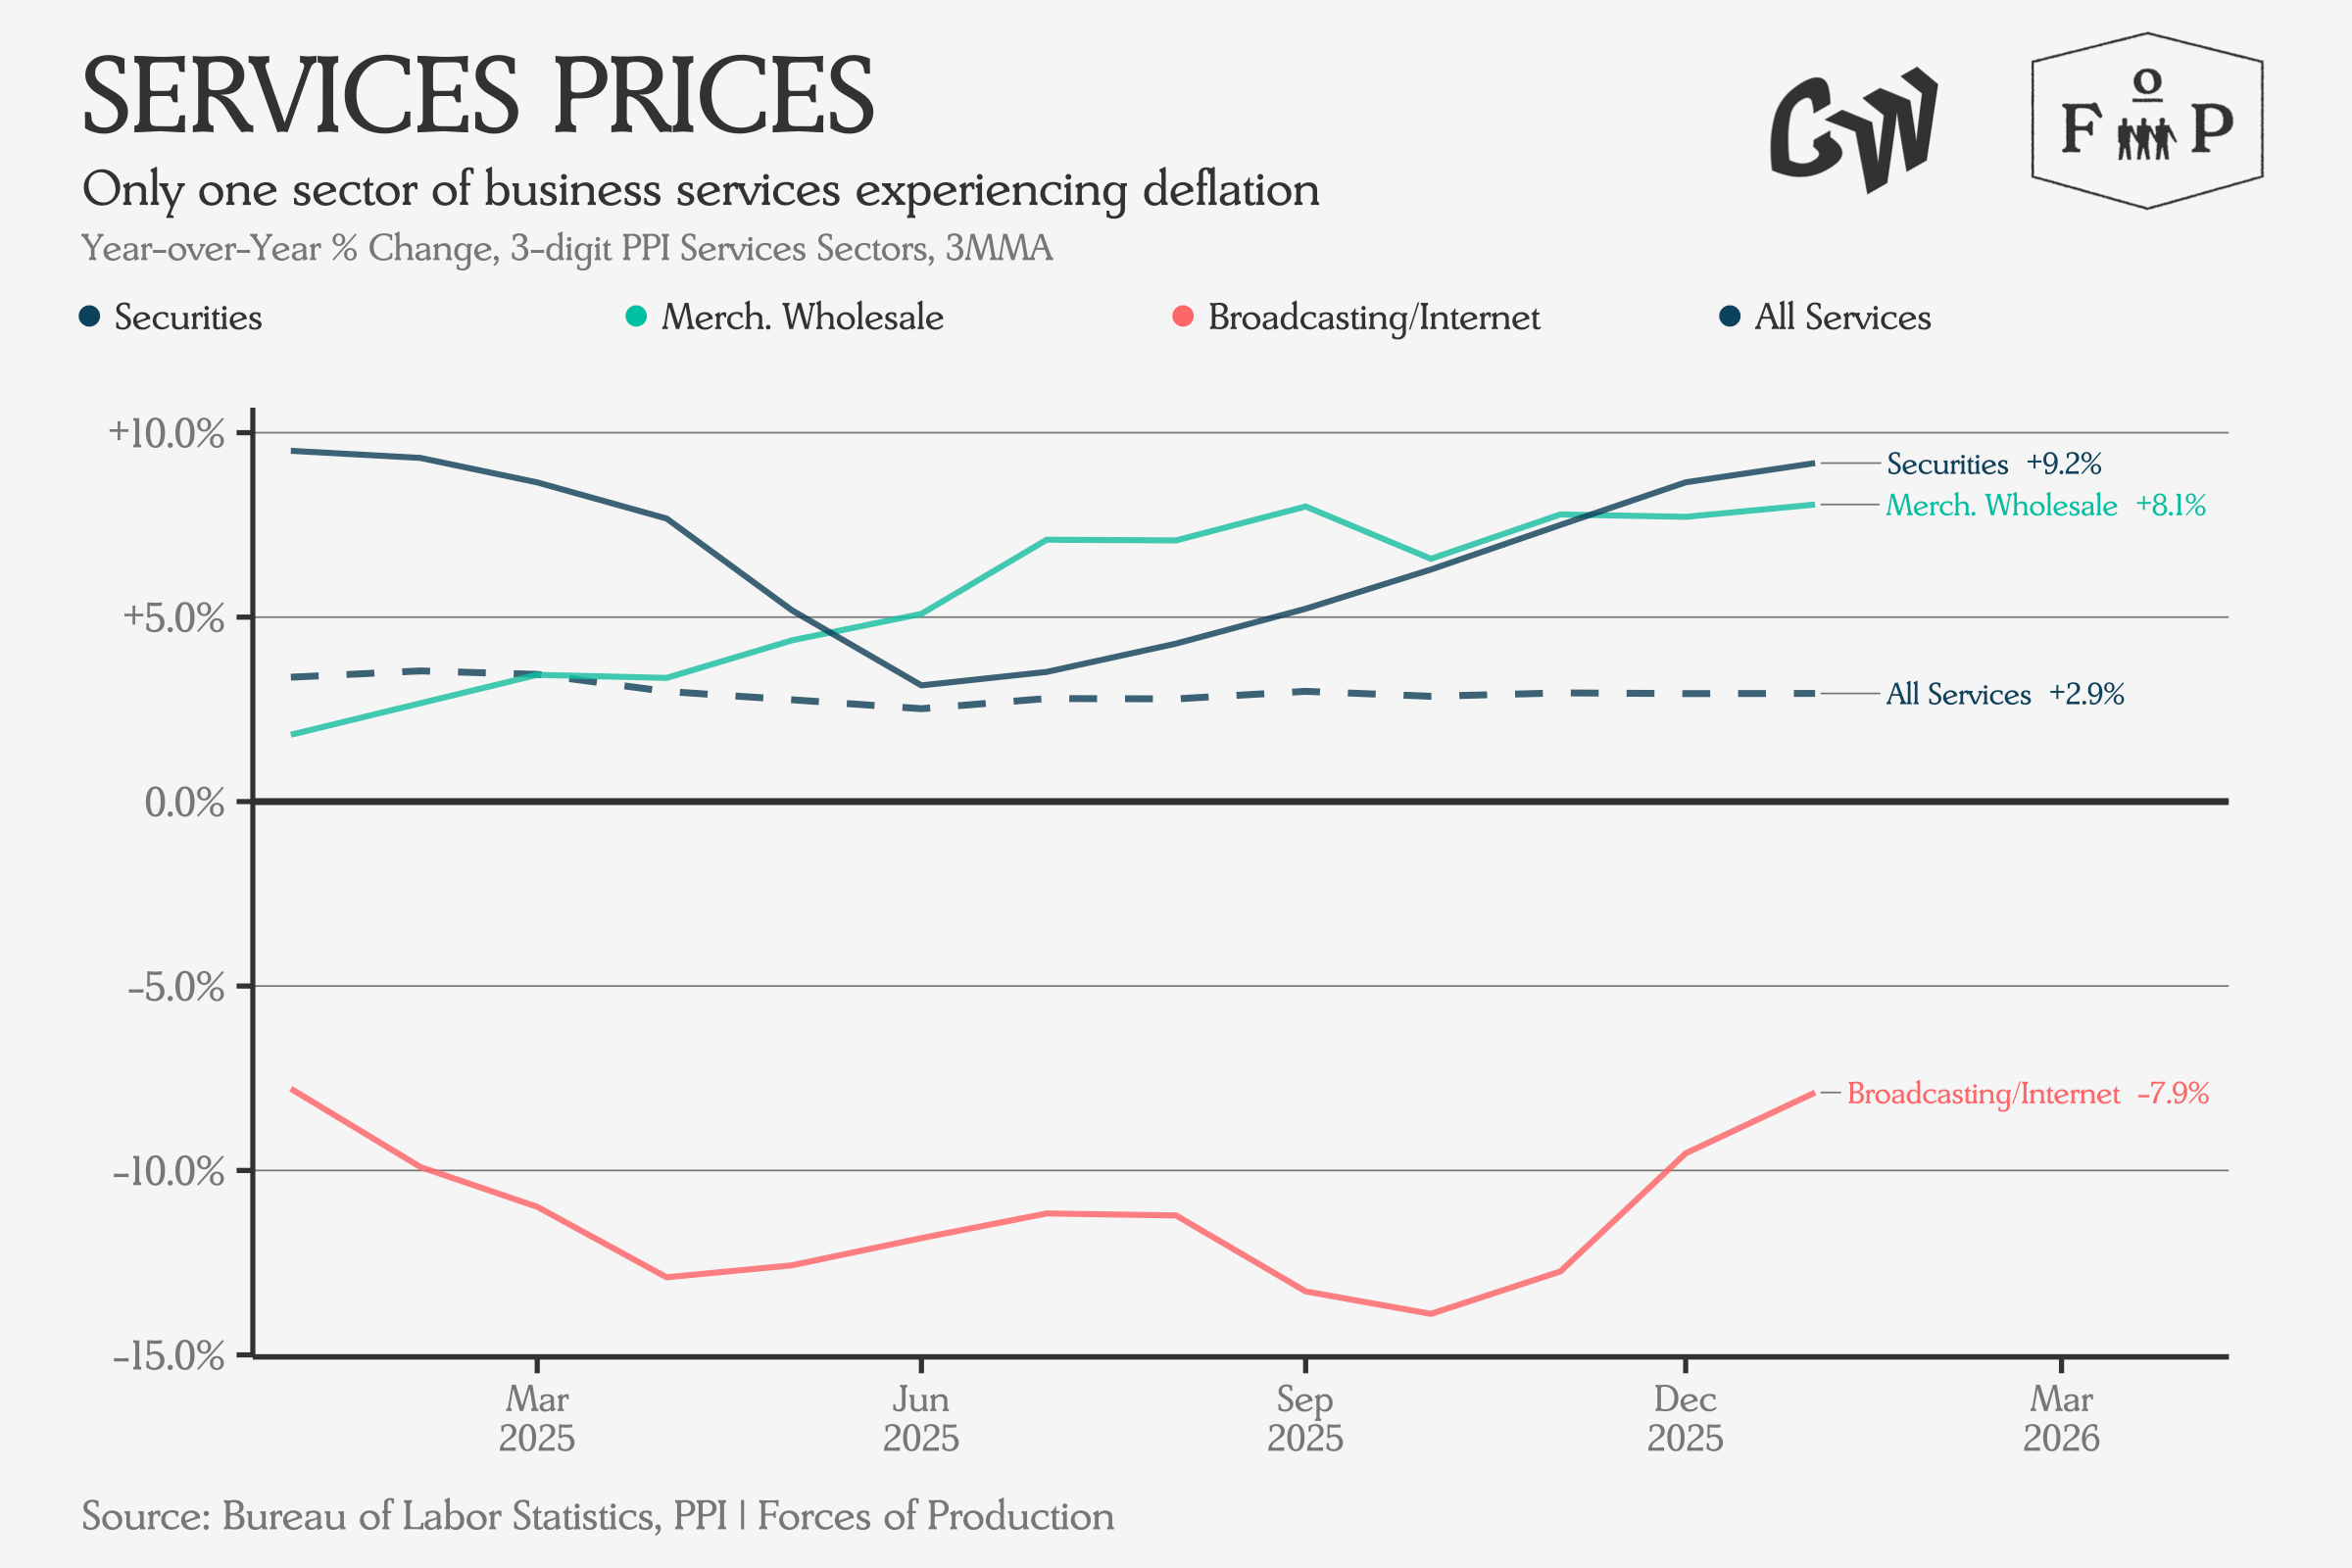
Producer prices show two things worth watching. Ranking 3-digit sectors by year-over-year PPI change, the services side is led by securities at +9.2 percent and merchandise wholesale at +8.1 percent. The aggregate for all services sits at +2.9%. At the bottom, broadcasting and internet continue its deflationary streak at -7.9 percent.
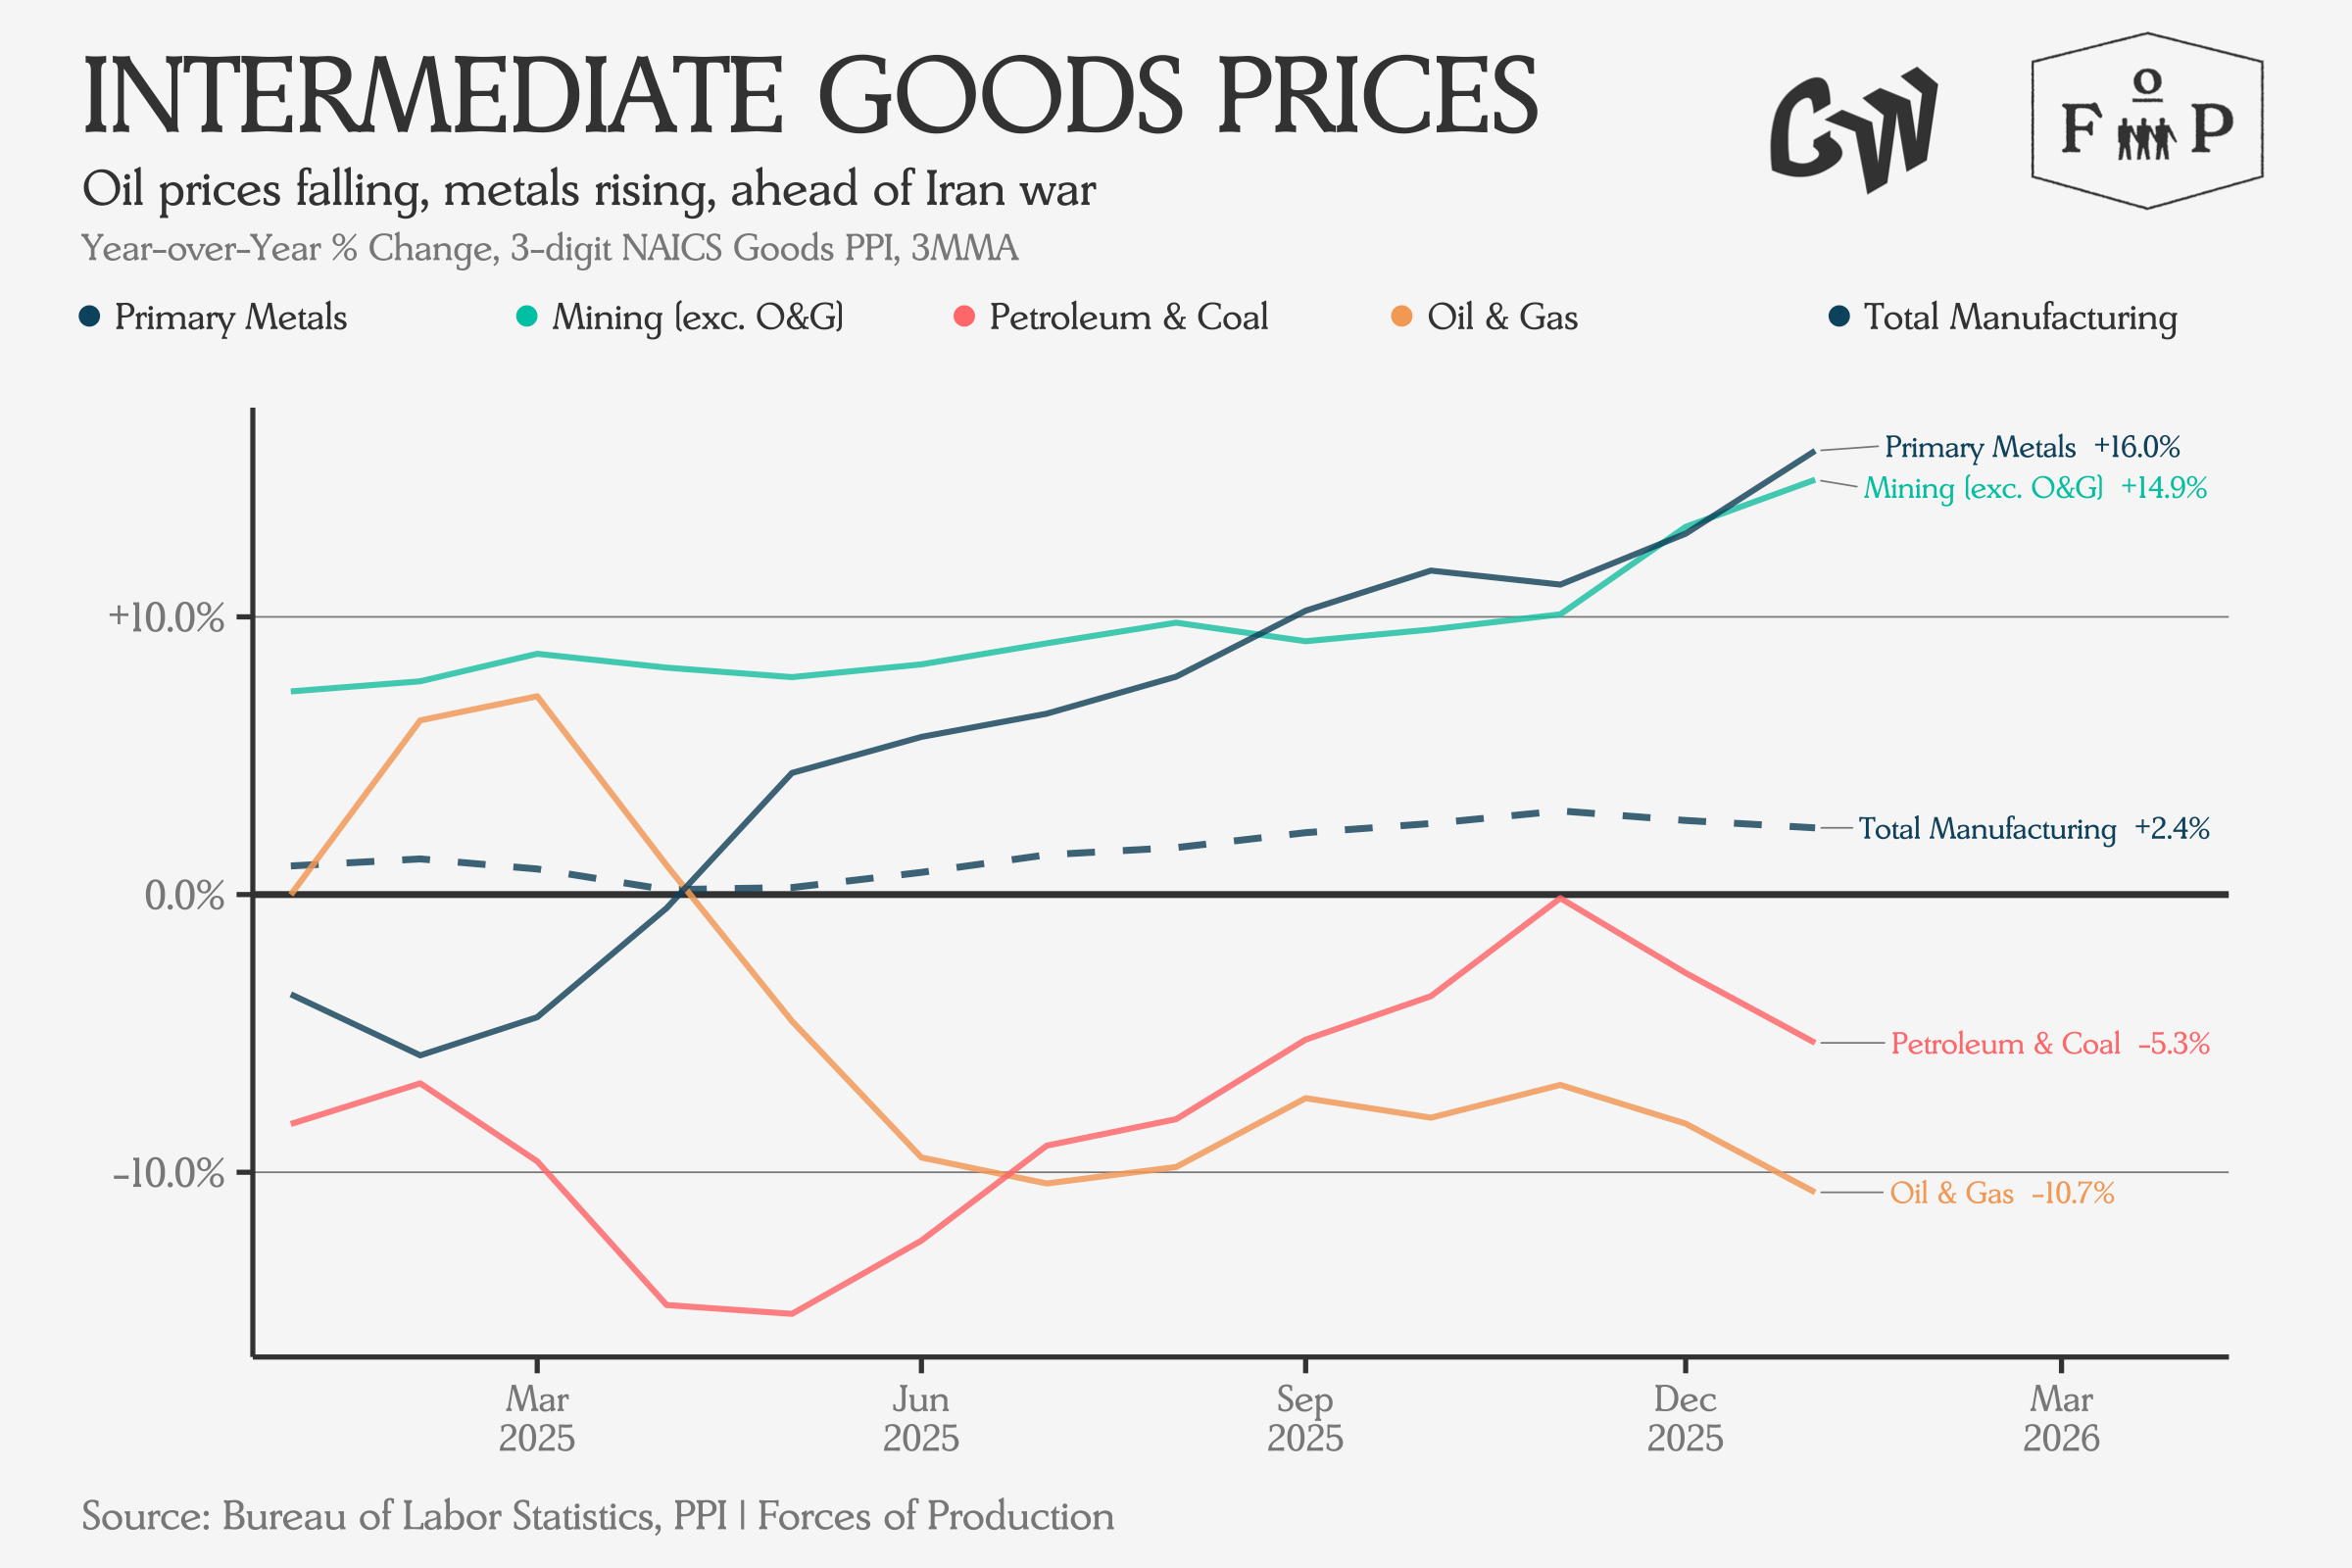
The same ranking on the goods side puts primary metals at the top: PPI up 16 percent year-over-year — directly relevant to the tariff analysis above, and consistent with what we would expect from anow markedly higher 50 percent Section 232 rate. Mining excluding oil and gas is close behind at +14.9 percent. At the bottom, oil and gas extraction prices are down 10.7 percent, with petroleum and coal products down 5.3 percent. Total manufacturing PPI sits at +2.4 percent.
Energy prices have been softening for months but no matter how this Iran conflict goes, that trend is now unreliable as a forecast.
Trade
In trade, we see some large month-to-month swings concentrated in a few sectors. Mining imports surged 25 percentage points in their year-over-year growth rate between November and December 2025 — a sharp acceleration. Oil and gas imports also picked up (+13.3pp), as did computer and electronics imports (+11.7pp). Forestry imports fell 33 percentage points.
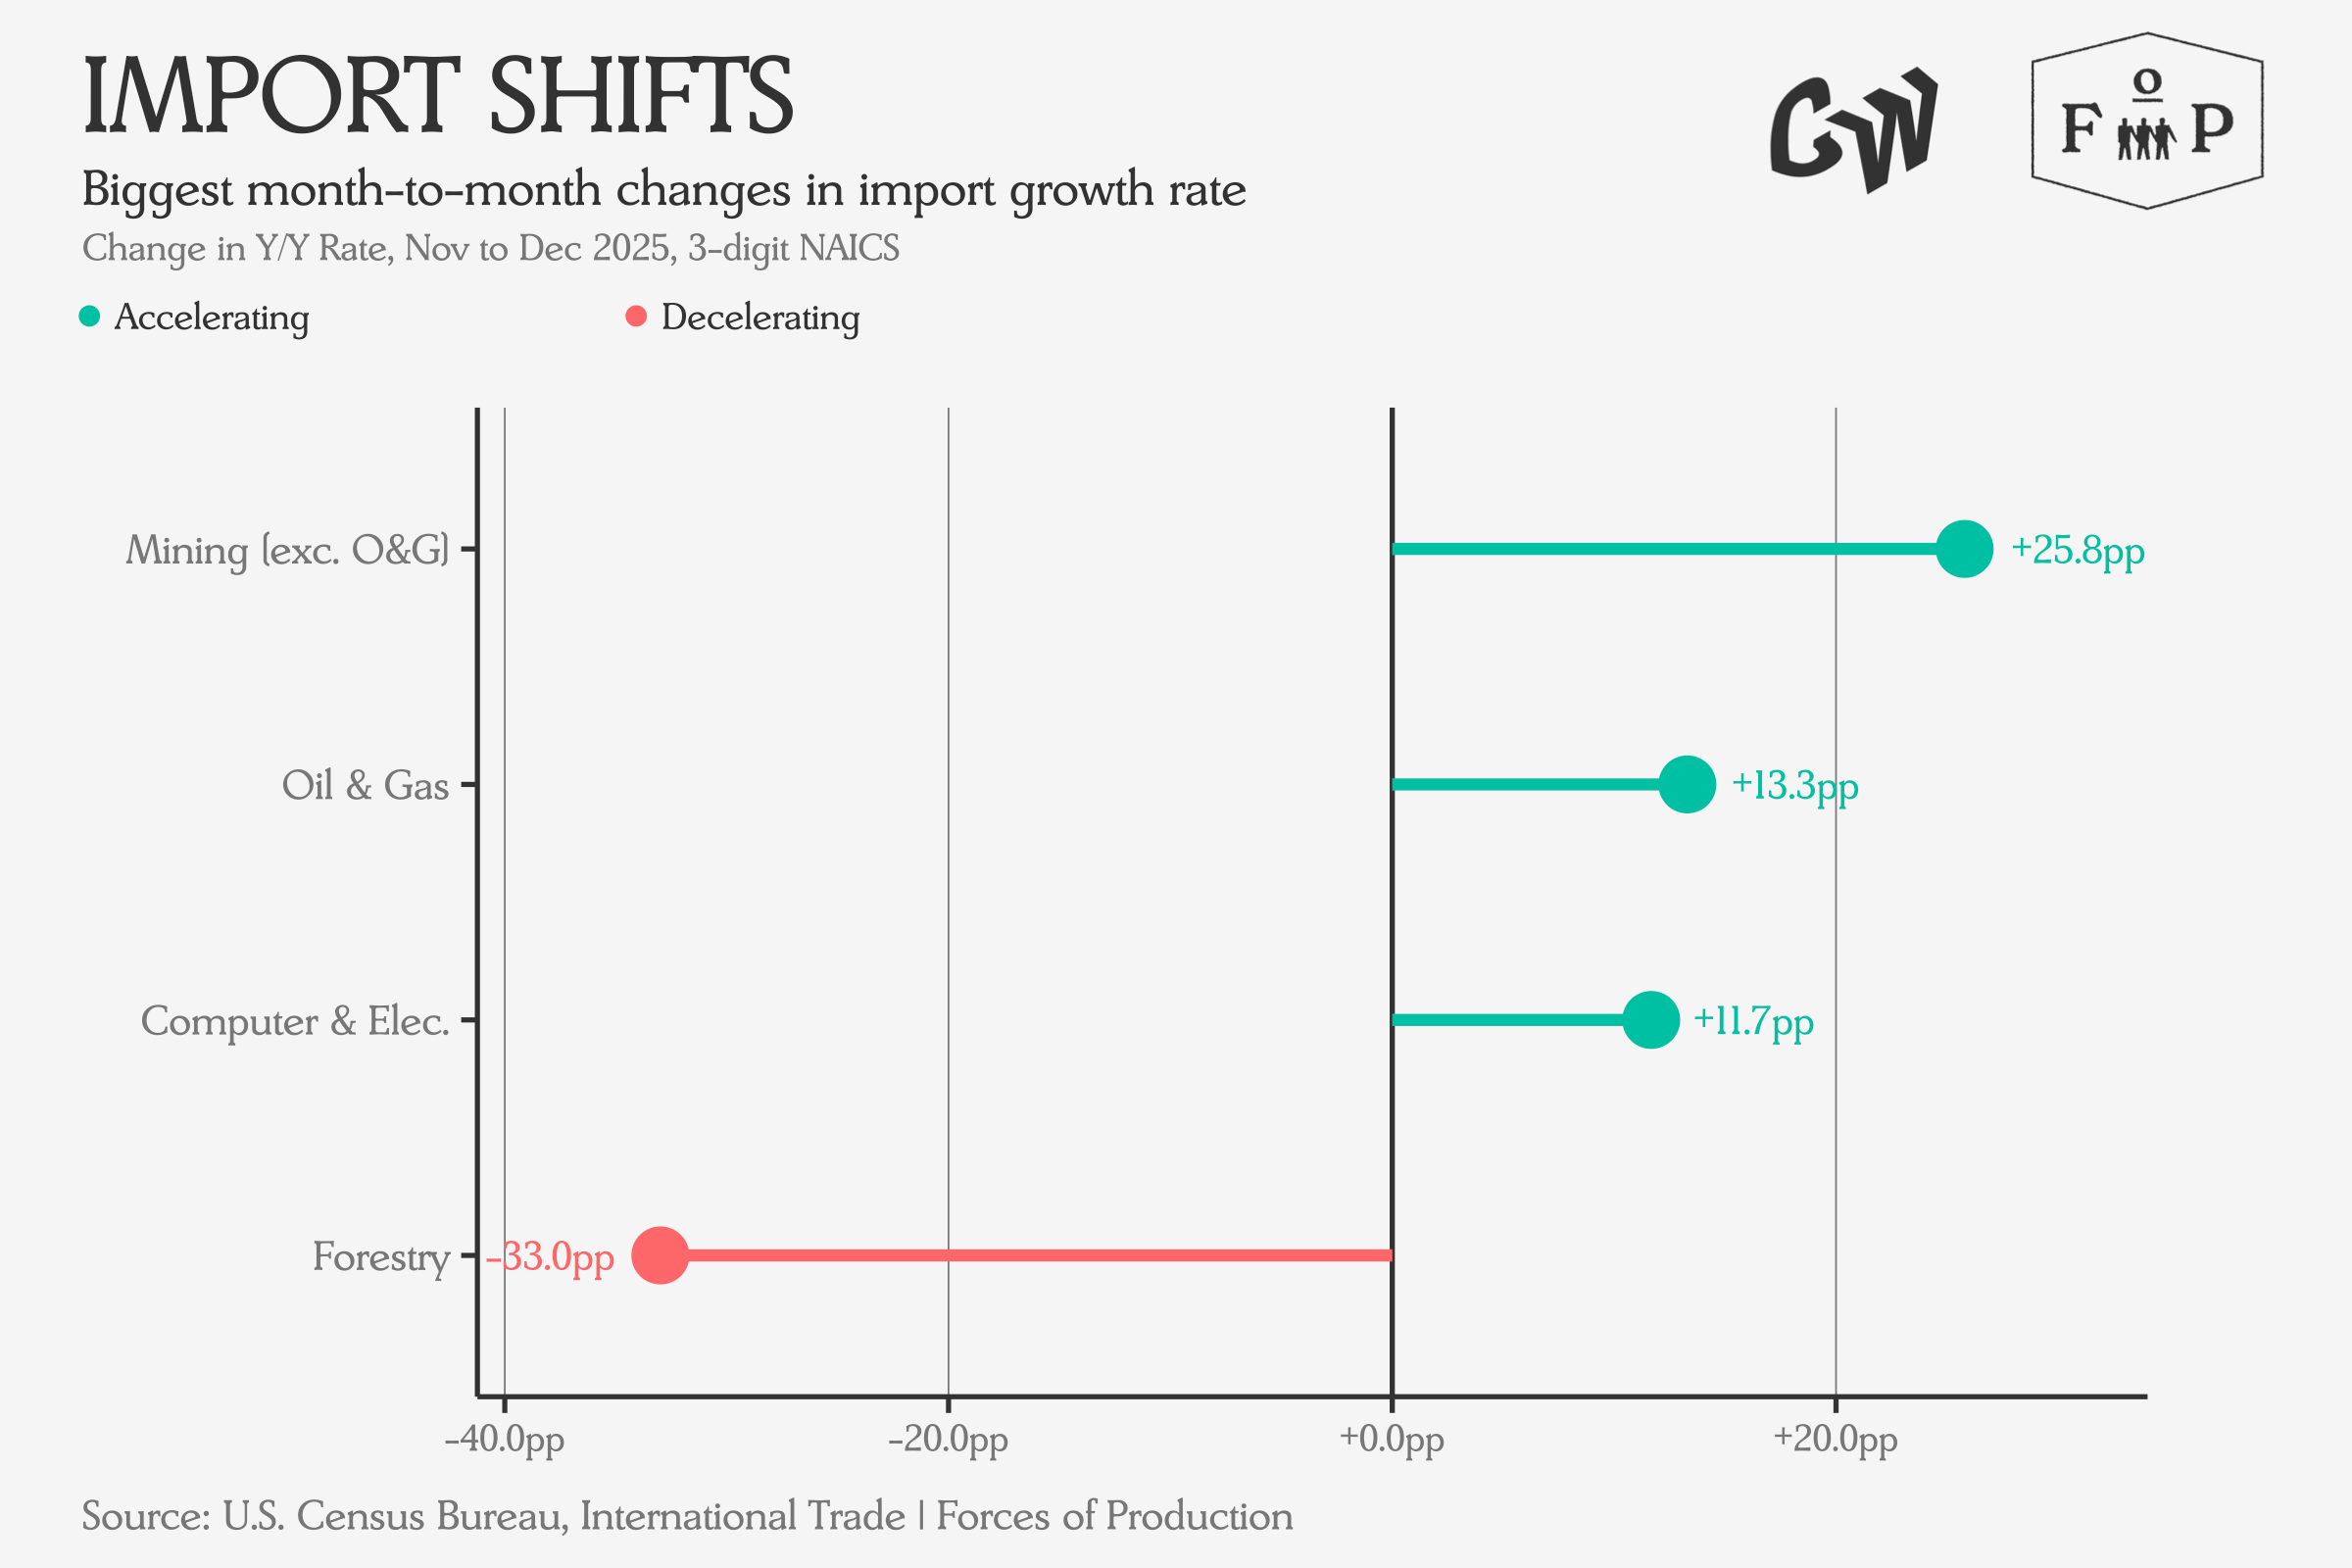
Exports show a mirror pattern for some of these: forestry exports surged (+29.6pp) against falling imports while computer and electronics exports accelerated (+20.1pp) on rising imports.
