Slow Slide on the Supply Side
Our first issue!

Hello and welcome to our first issue!
Our work at Forces of Production is to provide monthly tracking on the supply side data of the US economy.
Our goal is to contribute a public image of the supply side to support and sharpen ongoing conversations about industrial policy, public ownership, and new approaches to holding down the cost of living.
For more, check out our launch essay.
In this, our first issue, we will start by introducing some key tools necessary to understanding the supply side and then, use them to tell a familiar story — the shift from goods to services on the supply side. After that, we will look at new data published last month to see if the business cycle is pointing to a crisis on the supply side.
Before setting off to see what last month’s data shows, it’s worth demonstrating how the tools we will use can explain changes on the supply side over the short and long term.
Our Methods
When we talk about the supply side, we are talking about production. Everything that is supplied to the market has to be produced by someone or something, somewhere.
On one level, this is obvious, but on another level, the supply side remains one of the great unsolved problems in economics: how to accurately model the intricate web of production capacity.
Let’s start with some definitions.
Production takes place in firms, which employ labor to use capital equipment to produce output, output which sometimes requires extra materials, services, and energy.
In the Bureau of Labor Statistics documentation, this breakdown of the production process into its component parts — capital, labor, energy, materials, and services — is reported in the KLEMS accounts. The “output” of each firm’s production process is the “supply” that we are interested in.
The biggest challenge in studying the supply side is the sheer variety. Different production processes use different inputs to producedifferent outputs. To handle this, we at Forces of Production use the North American Industrial Classification System, or NAICS Codes.In it, firms with similar production processes are grouped together by sector and industry and organized by hierarchical code: firms in the same group can more easily sub in for one another with less need to adapt their production processes than firms in different groups.
In fact, every transaction between these different sectors — each given by a different NAICS code — falls into a KLEMS category, whether capital, energy, materials or services. The rest goes to regular consumers like you and me.
Let’s see how we can use these tools to tell a familiar story with added detail — to show how these tools work before diving in to analyze the monthly supply side data.
The shift towards services, and the changing composition of those services, is the biggest story of the 21st century for the US economy. But one of the major limitations in analyzing the supply side is the lack of output data for the service sector. Goods are more closely tracked than services in the economic data, with multiple measures of price and output. For services, data on the price of services sold to other businesses is published, but no measures of output. There is one indicator that provides data on both goods and services though: employment. Given that labor is the original force of production, employment is a great example to work from.
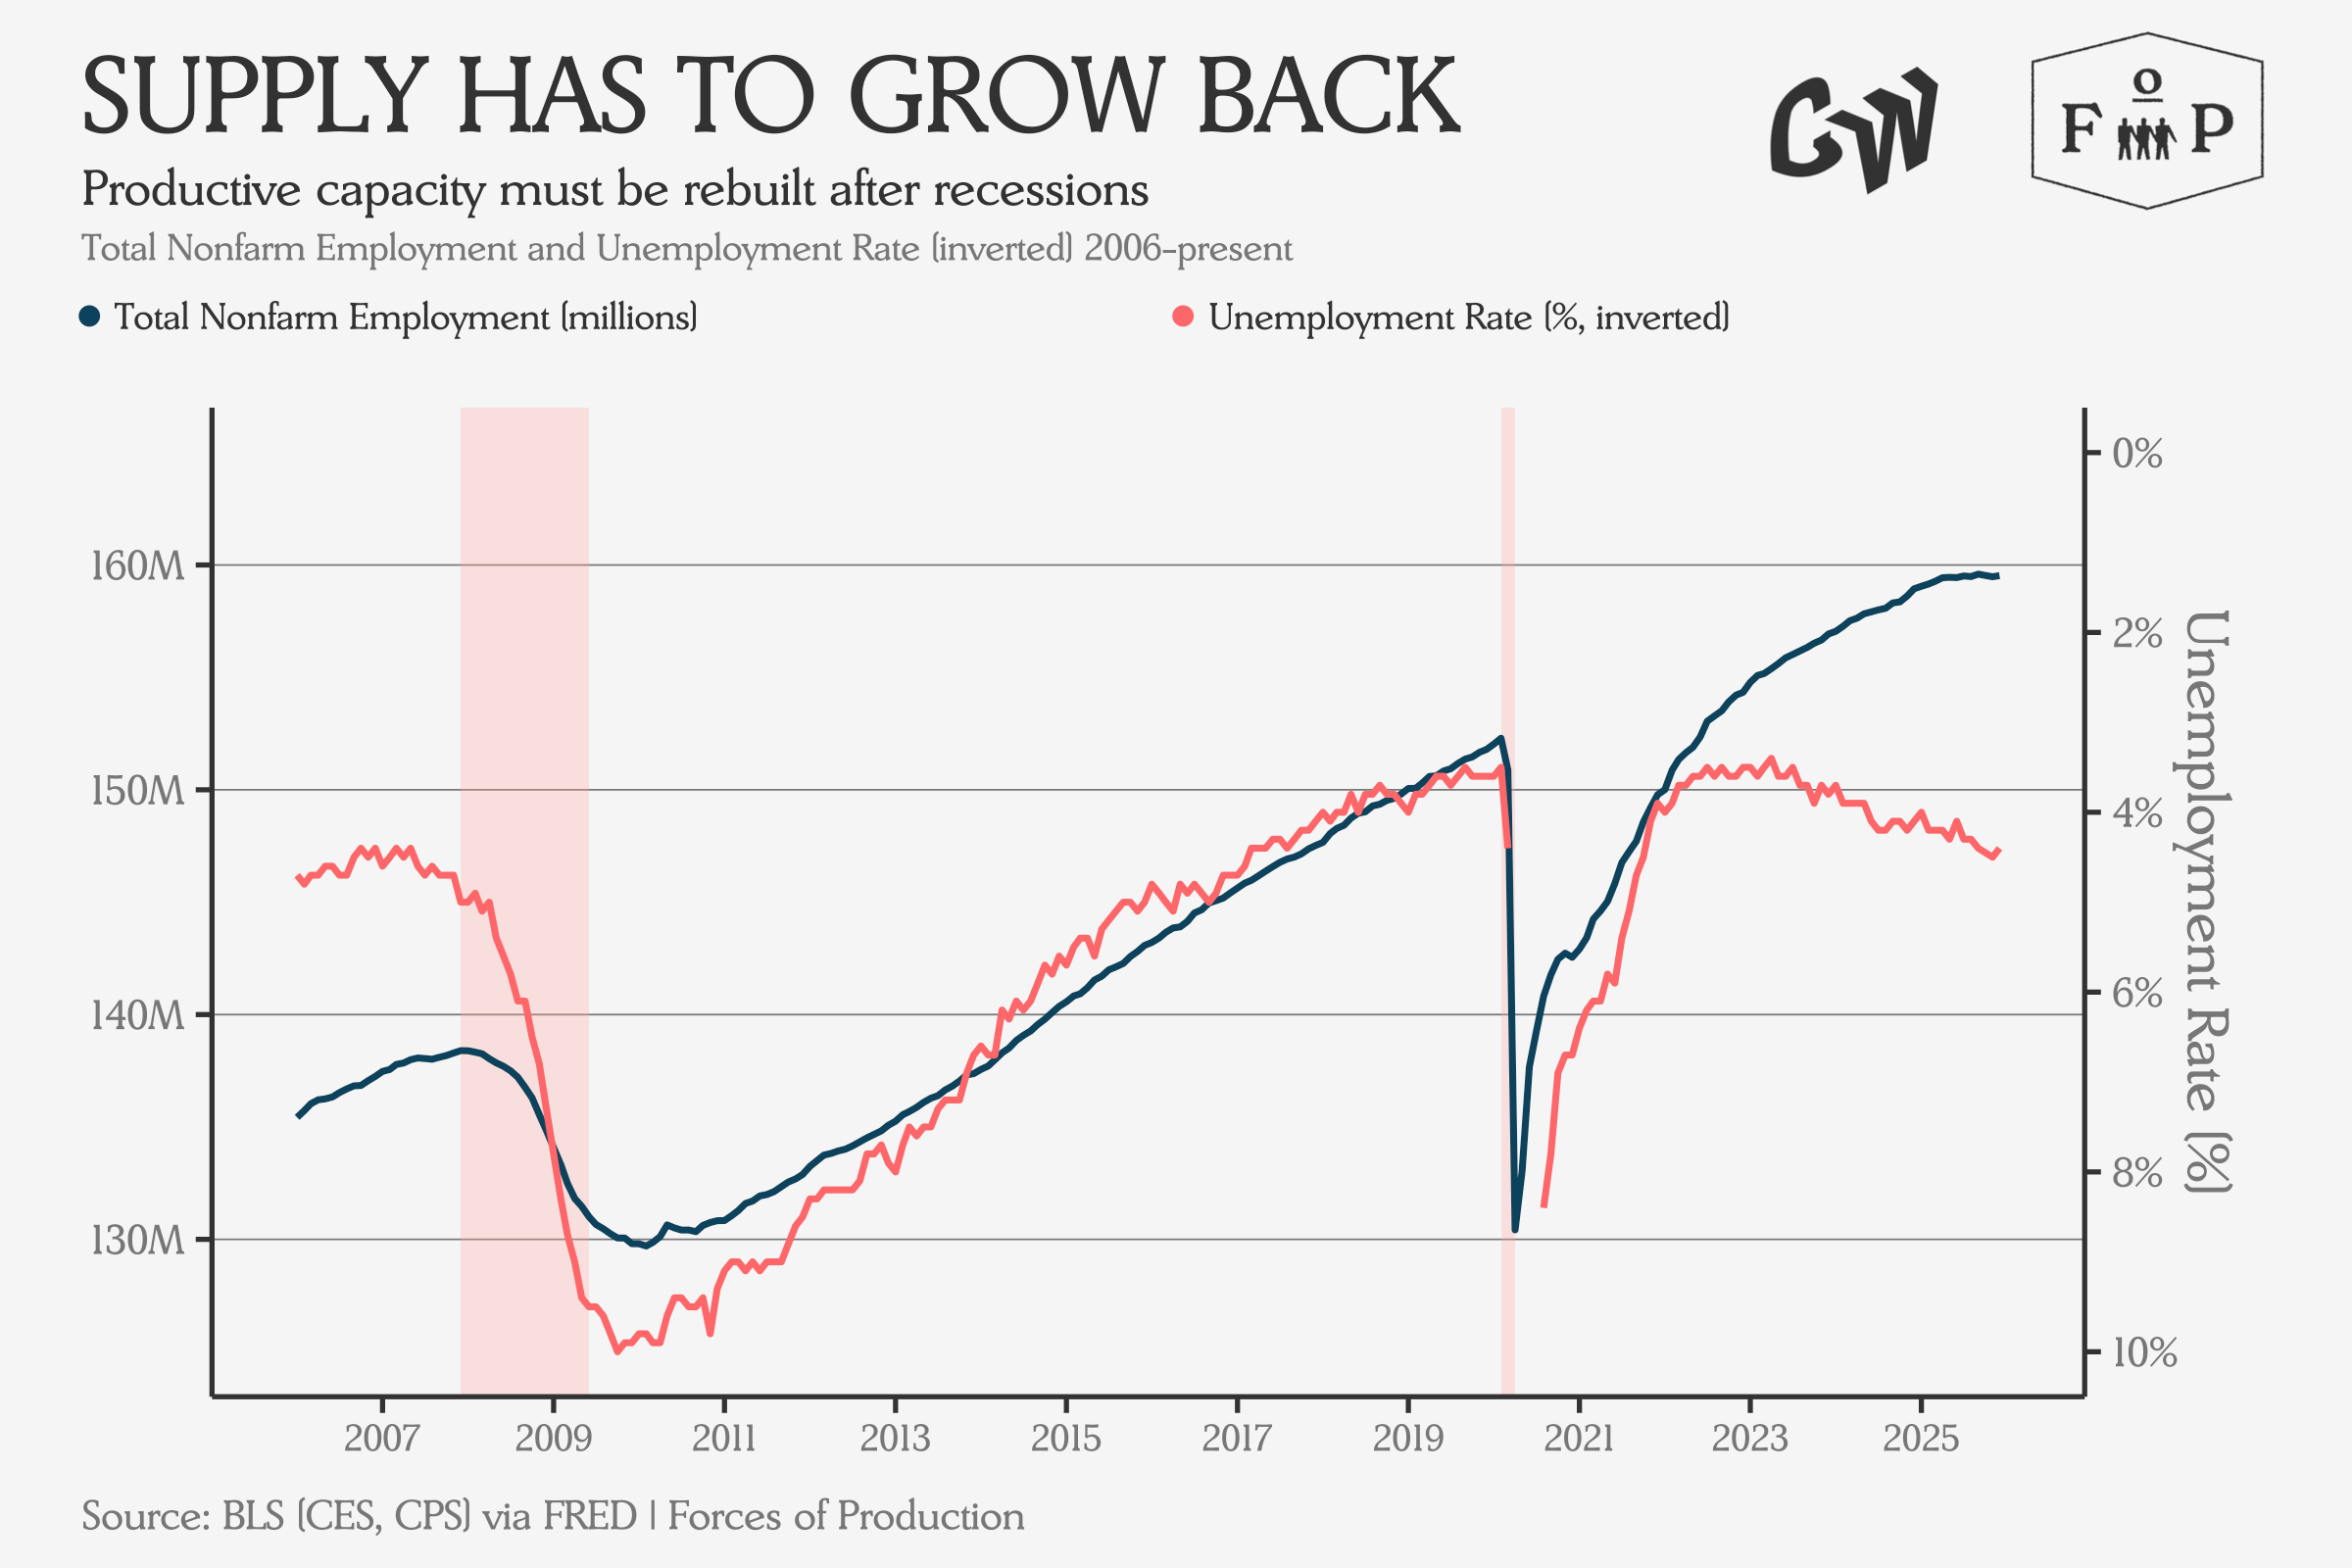
Employment is tricky, though, because it is so tied to the business cycle. In times of crisis, the supply side loses jobs across goods and services alike, and those lost jobs have to be rebuilt from scratch. This is what makes recessions so damaging for the supply side: existing capacity disappears, and new capacity has to be constructed from the ground up.
This dynamic has been given many names over the years, from the crisis of reproduction, to Milton Friedman’s “plucking model”, named for the fact that charts of unemployment across recession and recovery look a bit like a plucked string.
To get a sense of where we are now, let’s compare how different sectors across goods and services bounced back following the last two major crises: the pandemic and the Great Financial Crisis.
Over both swings through the macro business cycle, we saw the total employment level grow, but that growth favored different sectors.Some parts of the supply side have returned stronger than before, while others have steadily weakened over the last twenty years.
The chart above shows employment growth over both recession recoveries, across both goods and services, broken down by 3-digit NAICS code. While a few sectors saw growth across only one recovery, the majority either grew through both recoveries or lost jobs across both recoveries.
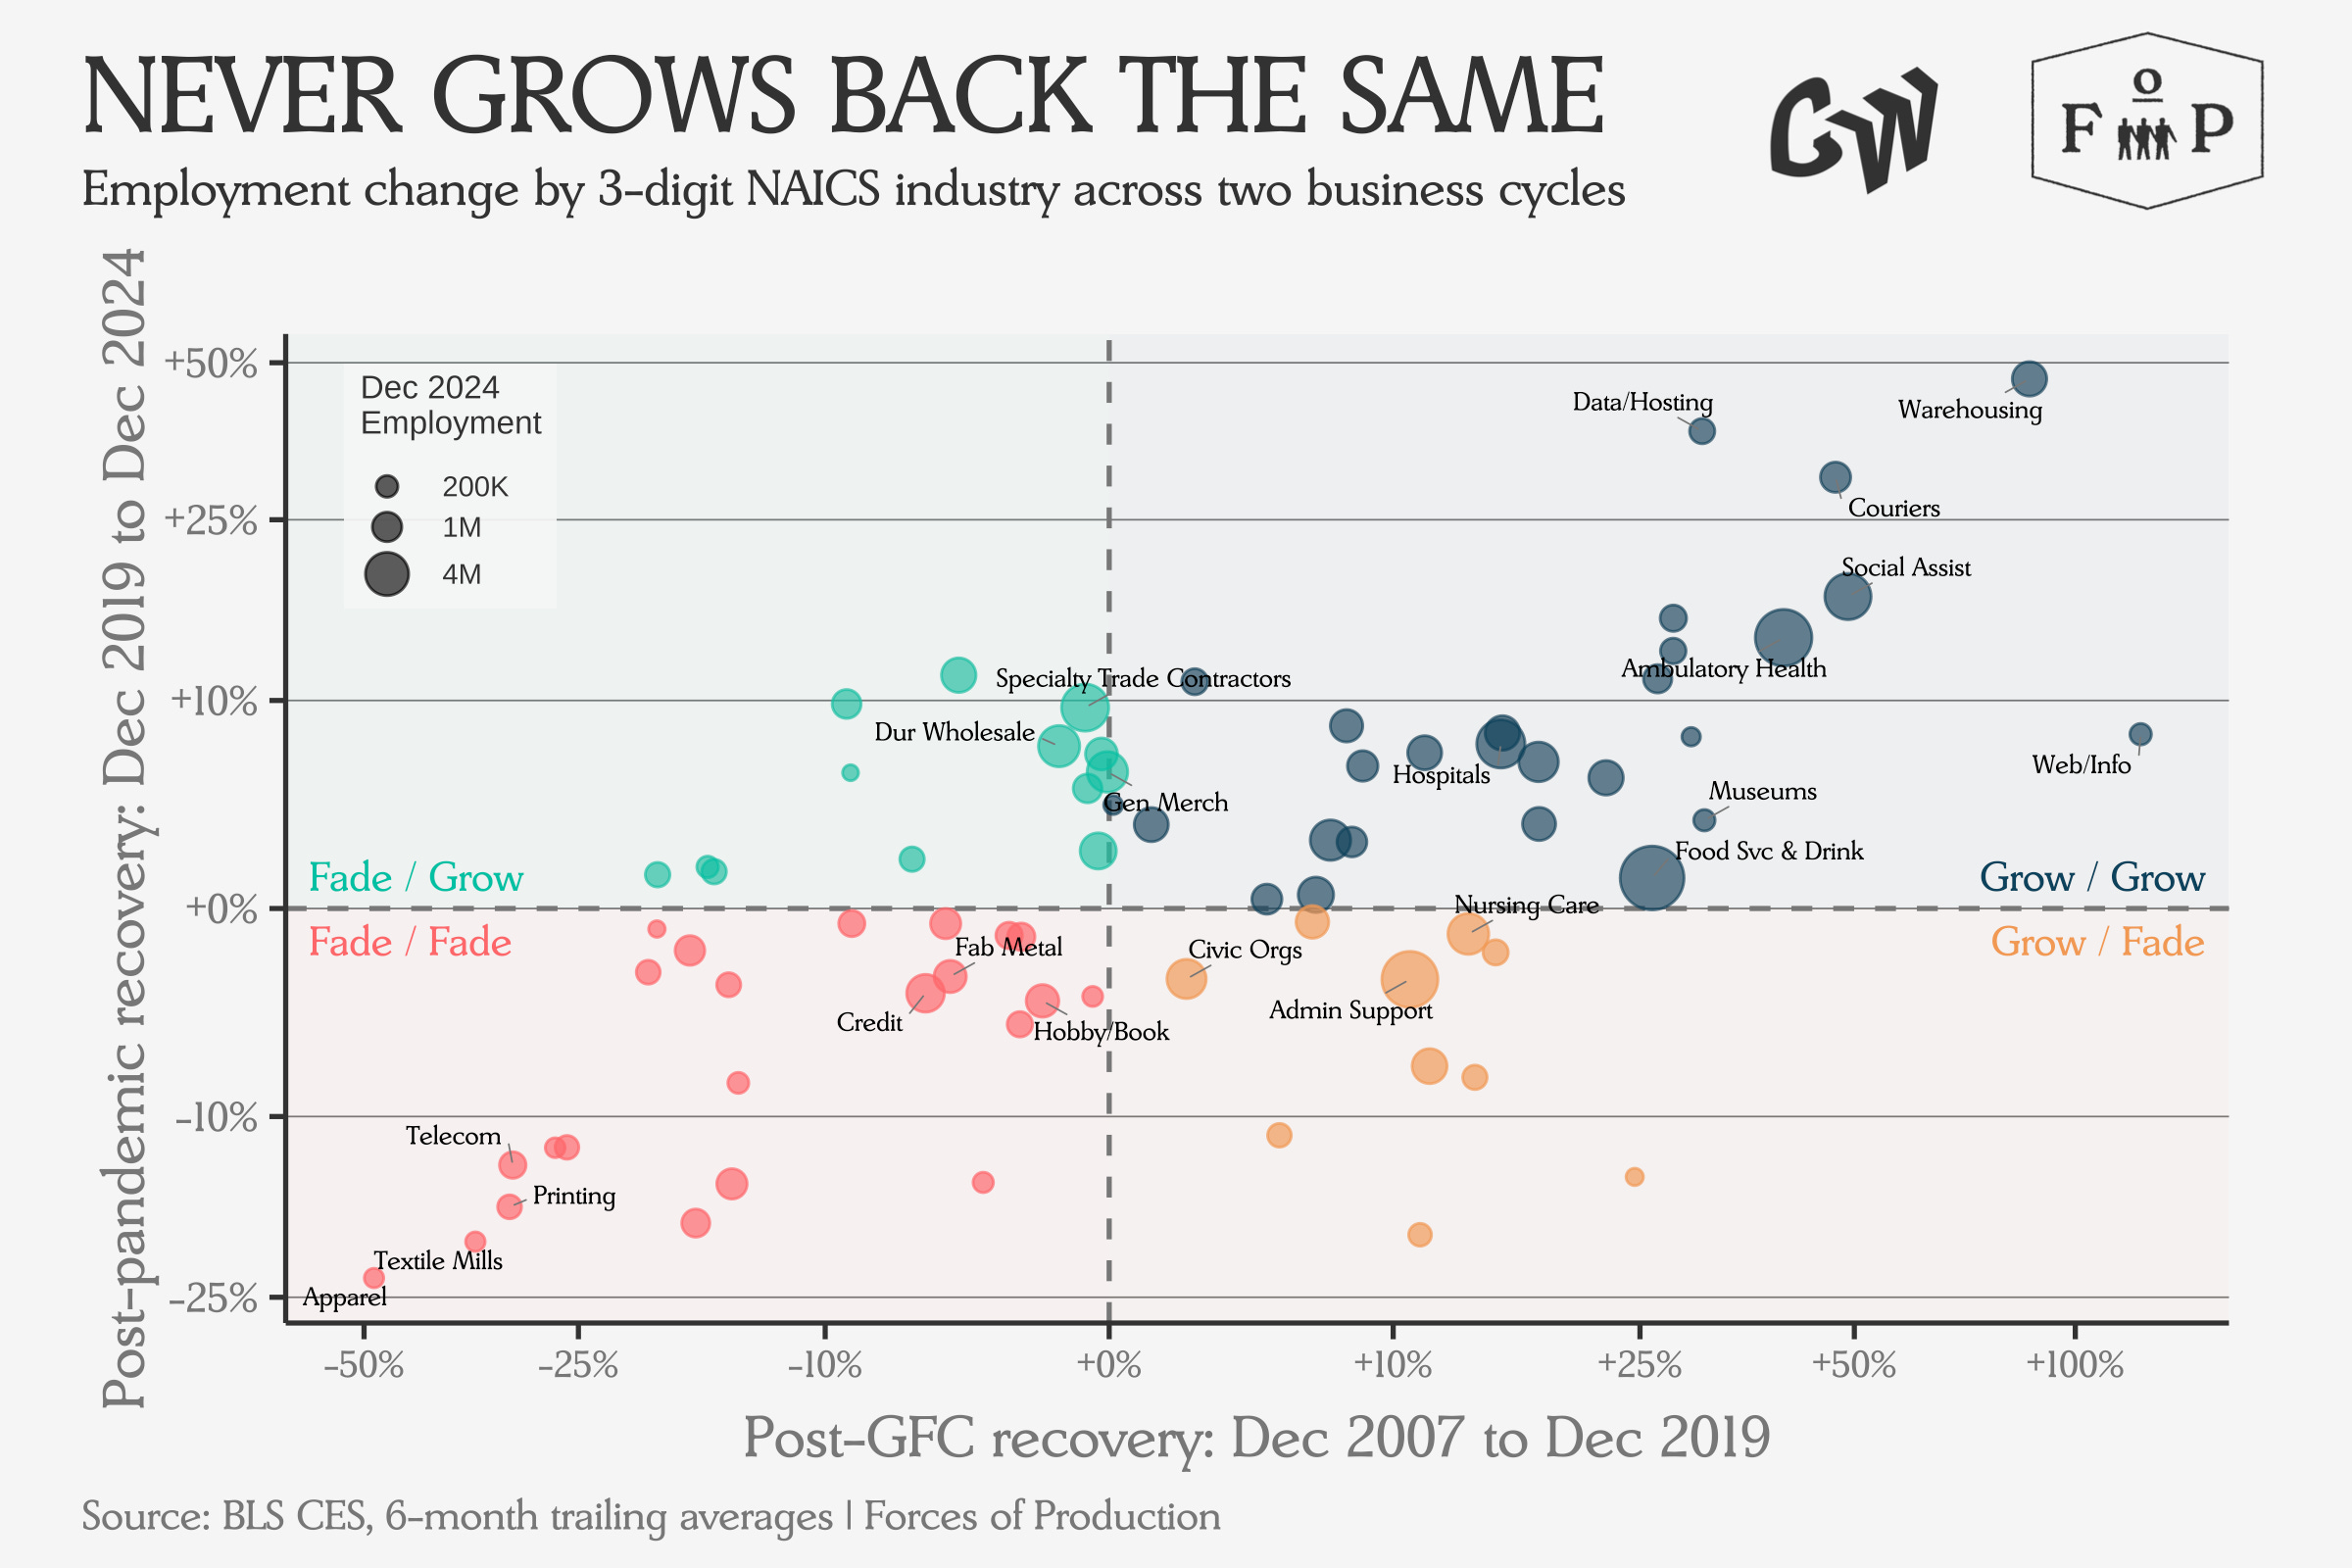
Looking at the sectors that have gained and lost employees over the past two decades will help us understand how what people do for work has changed.
Most of these industries in which employment levels grew back stronger over both crises are in the service sector, with a split between high-wage/high-margin work like Professional Services, Insurance, and Data Hosting and low-wage/low-margin work like Social Assistance, Warehousing, and Food Manufacturing.
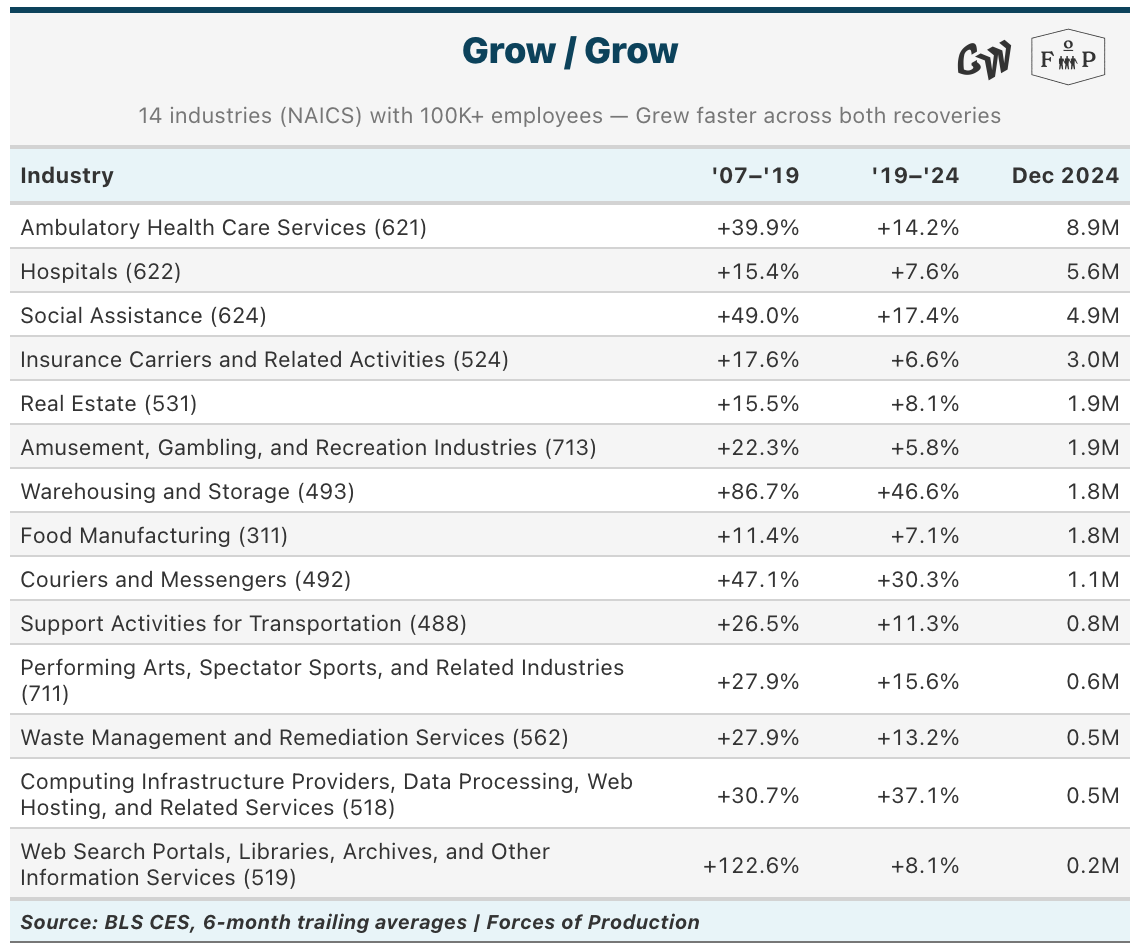
Much of the strongest employment growth has been in care sectors, as the supply side adapts to an aging population in need of care. Warehousing and Courier employment has also grown as shopping has been increasingly rerouted from storefronts to online.
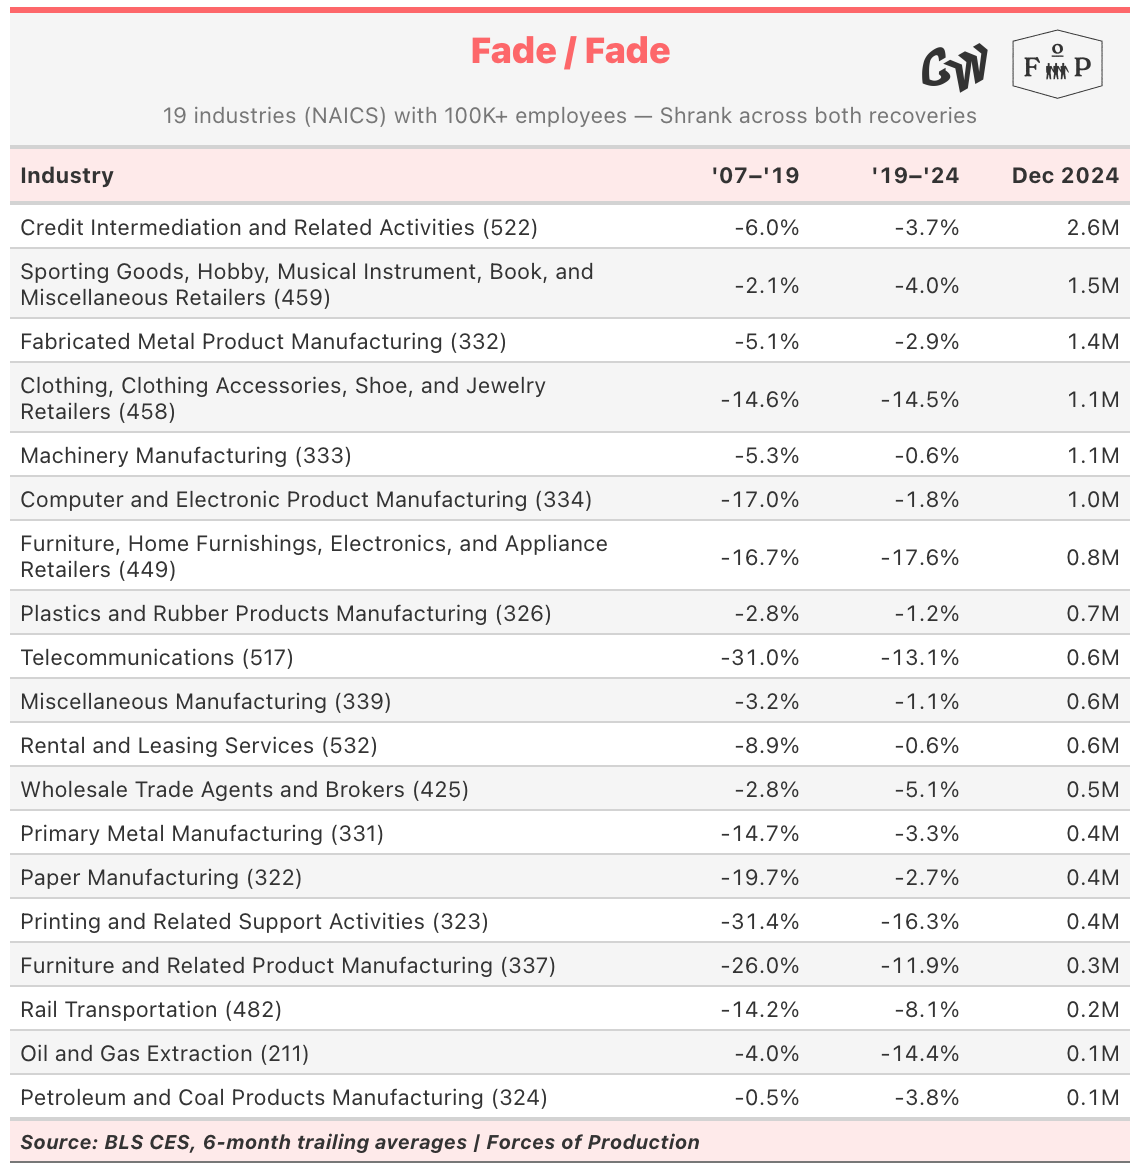
In some of these sectors — as in fabricated metal product manufacturing, or oil and gas extraction — the Industrial Production data shows output has largely been maintained despite falling employment. Yet many of the sectors showing outright declines over both recoveries have been stories of structural decline rather than productivity gain. Clothing retail employment has declined by double digits across both periods while trade-exposed industries like furniture, printing, and paper manufacturing have all seen falling employment.
Last Month’s Data
Many have been worried about the supply side, with rising geopolitical tensions and daily-changing tariffs creating an environment of incredible uncertainty.
It is easy to see this uncertainty as the source of any crisis if one arises, but the supply side of the US economy is both very large and very inertial.
Looking across last month’s data, we see a broad continuation of previous trends. Employment growth continues to slow whileIndustrial Production continues to gradually rise, led now by Durable Goods manufacturing.
Durable Goods manufacturing is also driving recent increases in Capacity Utilization as well. Producer Prices continue their gradual re-acceleration, with the greatest seller’s inflation showing up earlier in the supply chain, from Mining and Primary Metals production. Price increases for upstream materials like these can have an outsized influence on the cost of production across a wide range of industriesthat use them.
Employment
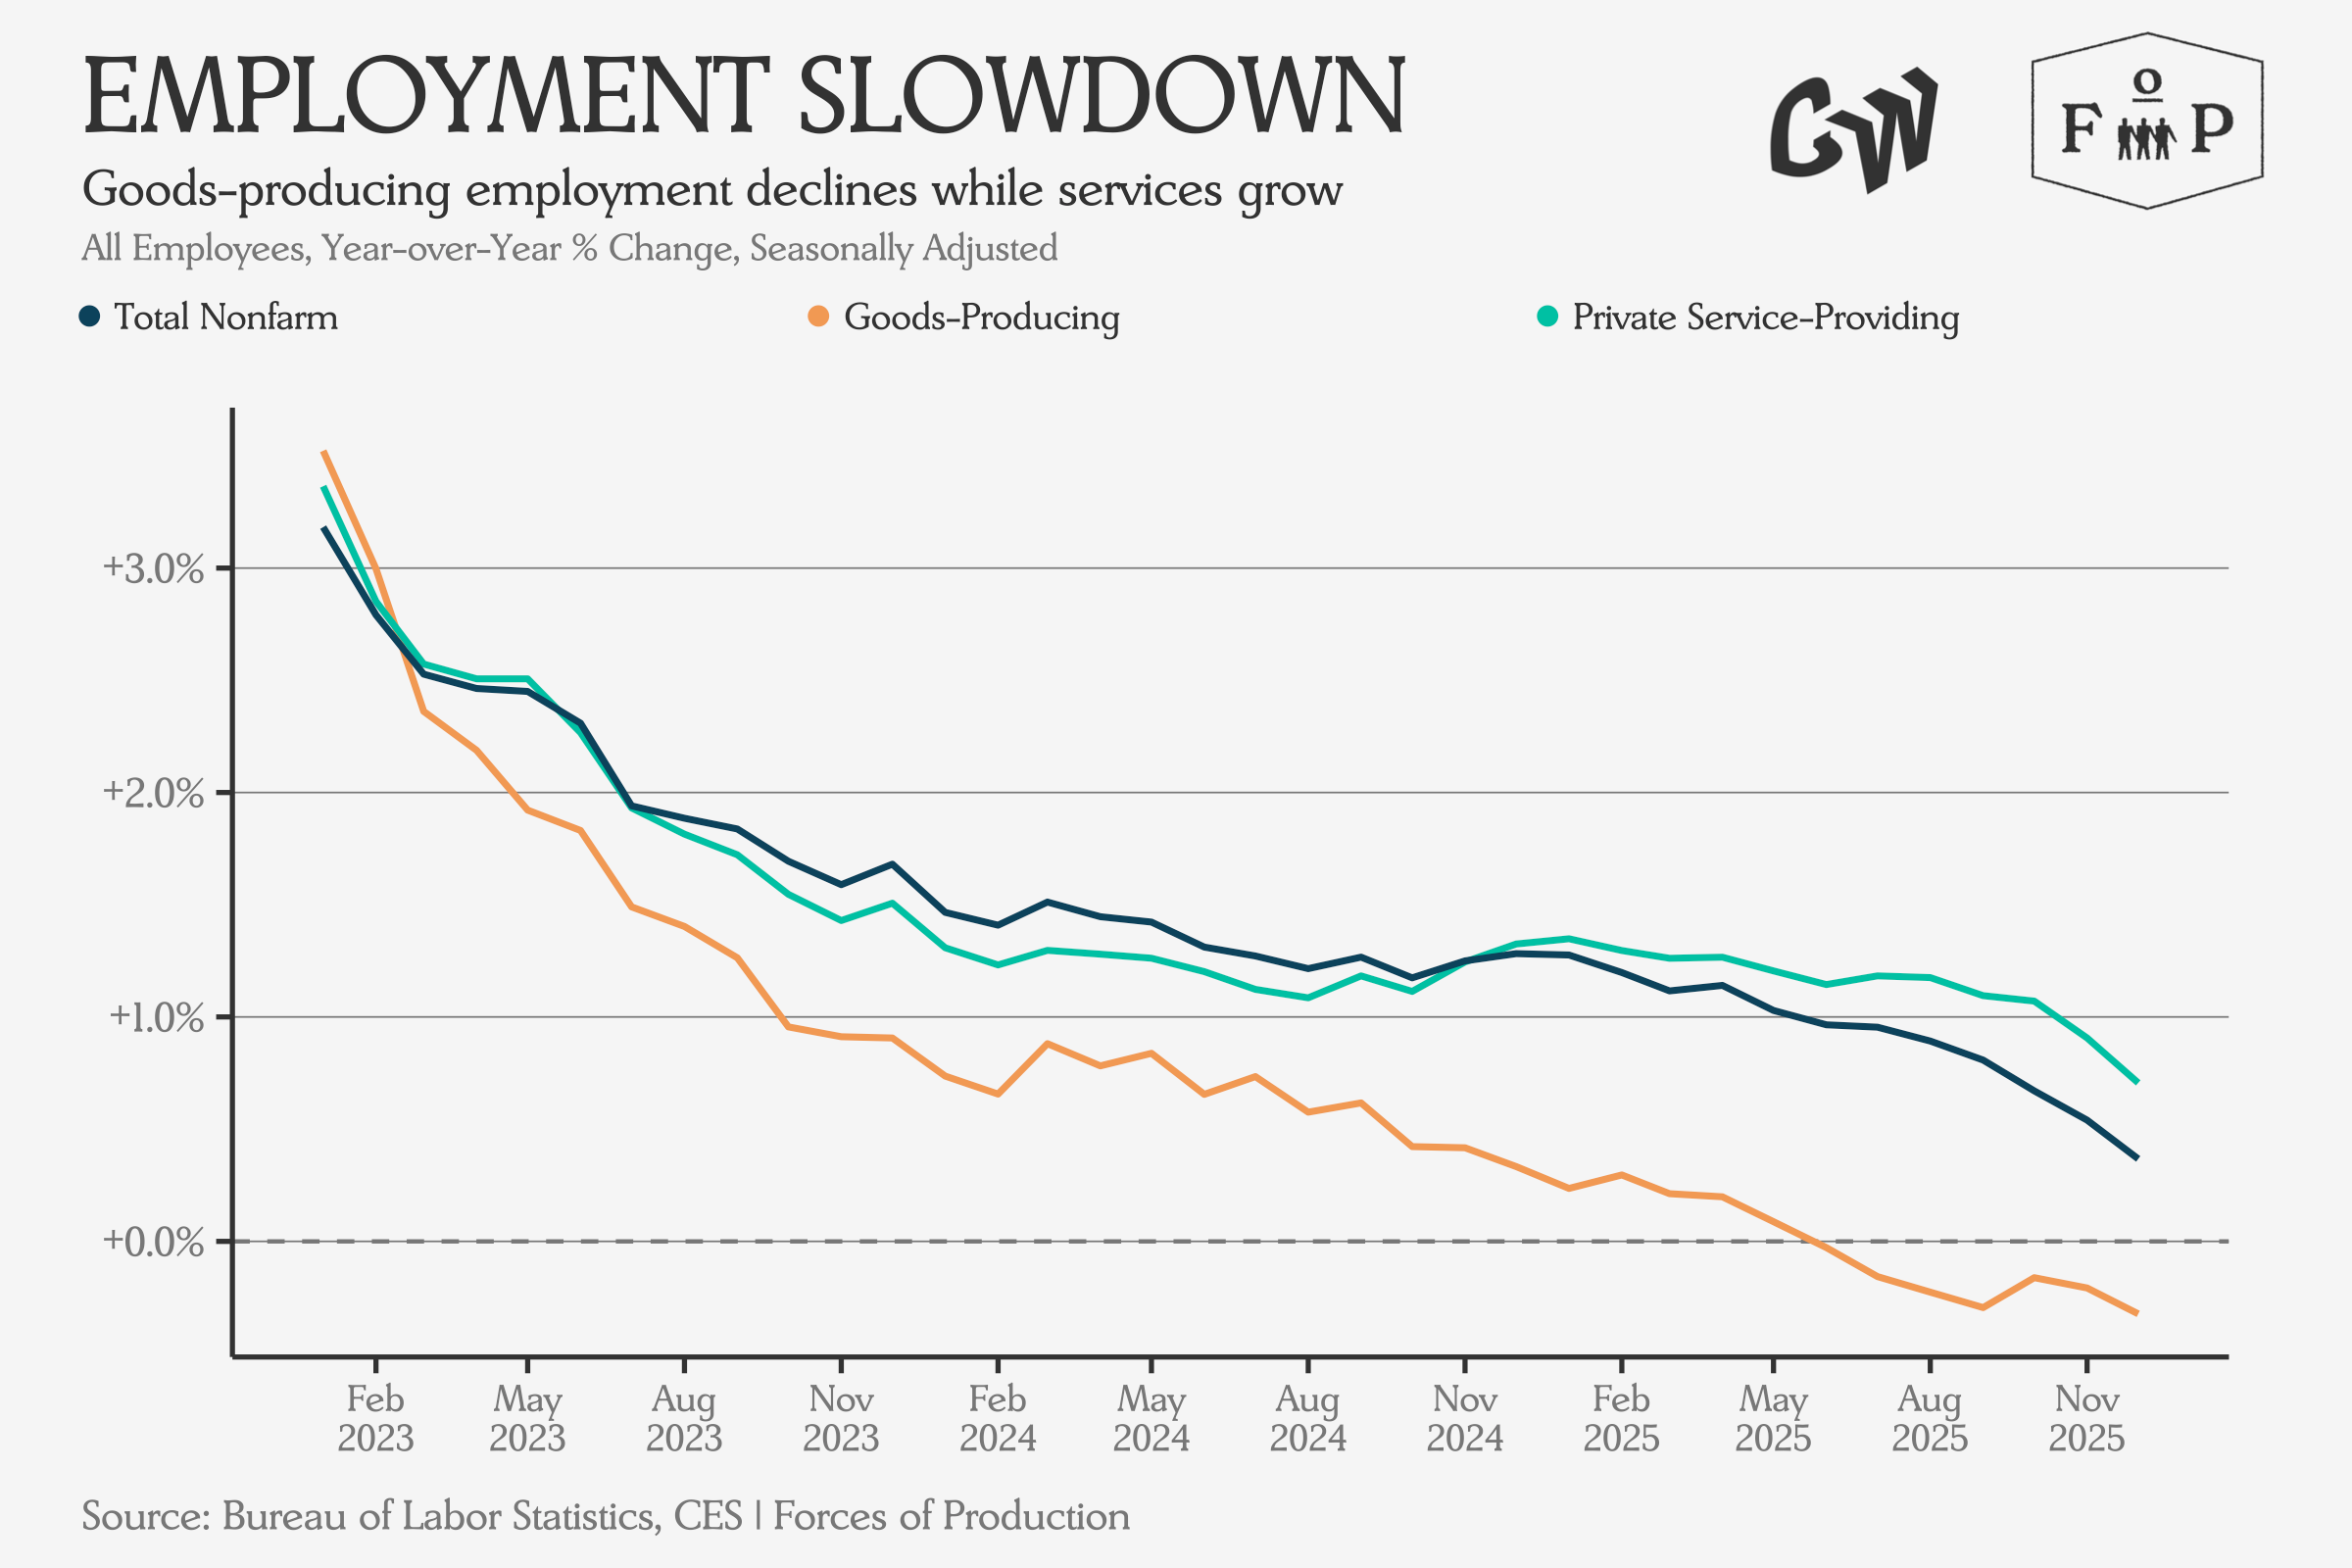
The service sector continues to drive employment gains, with Goods-Producing employment levels down slightly over the past year.
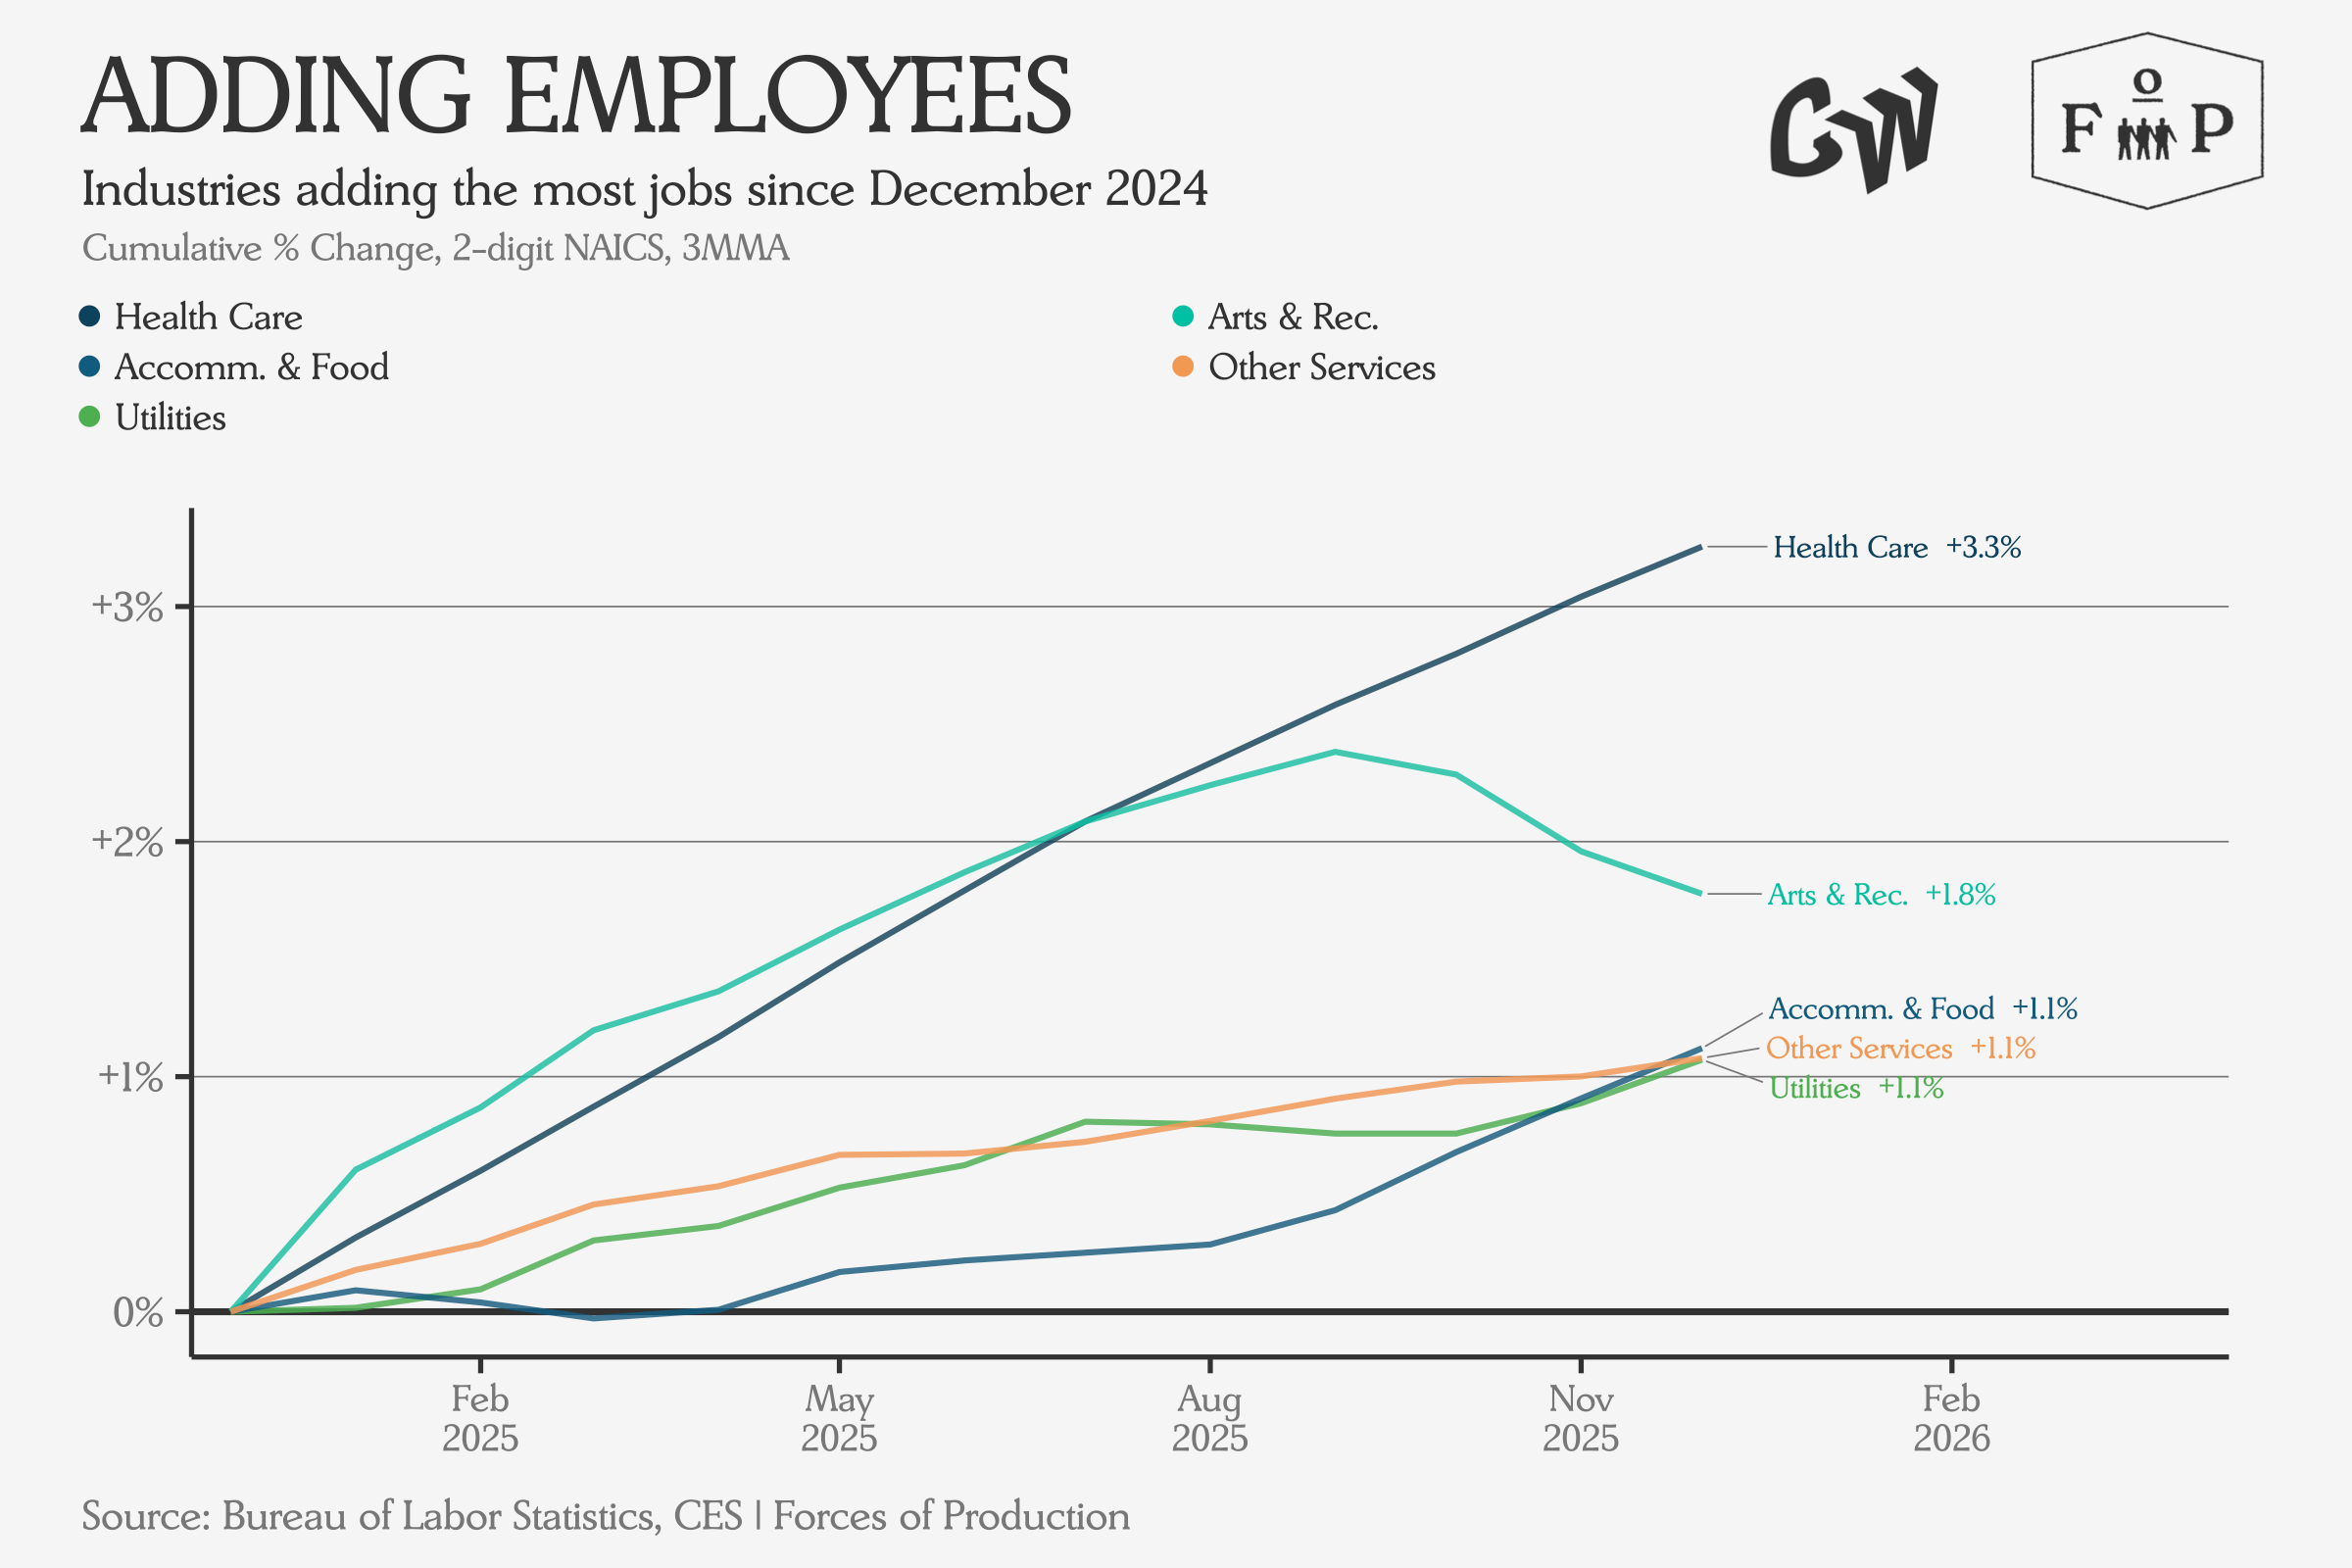
The biggest gains have all been in the service sector, with Health Care the clear standout at 3.1% employment growth since December 2024.
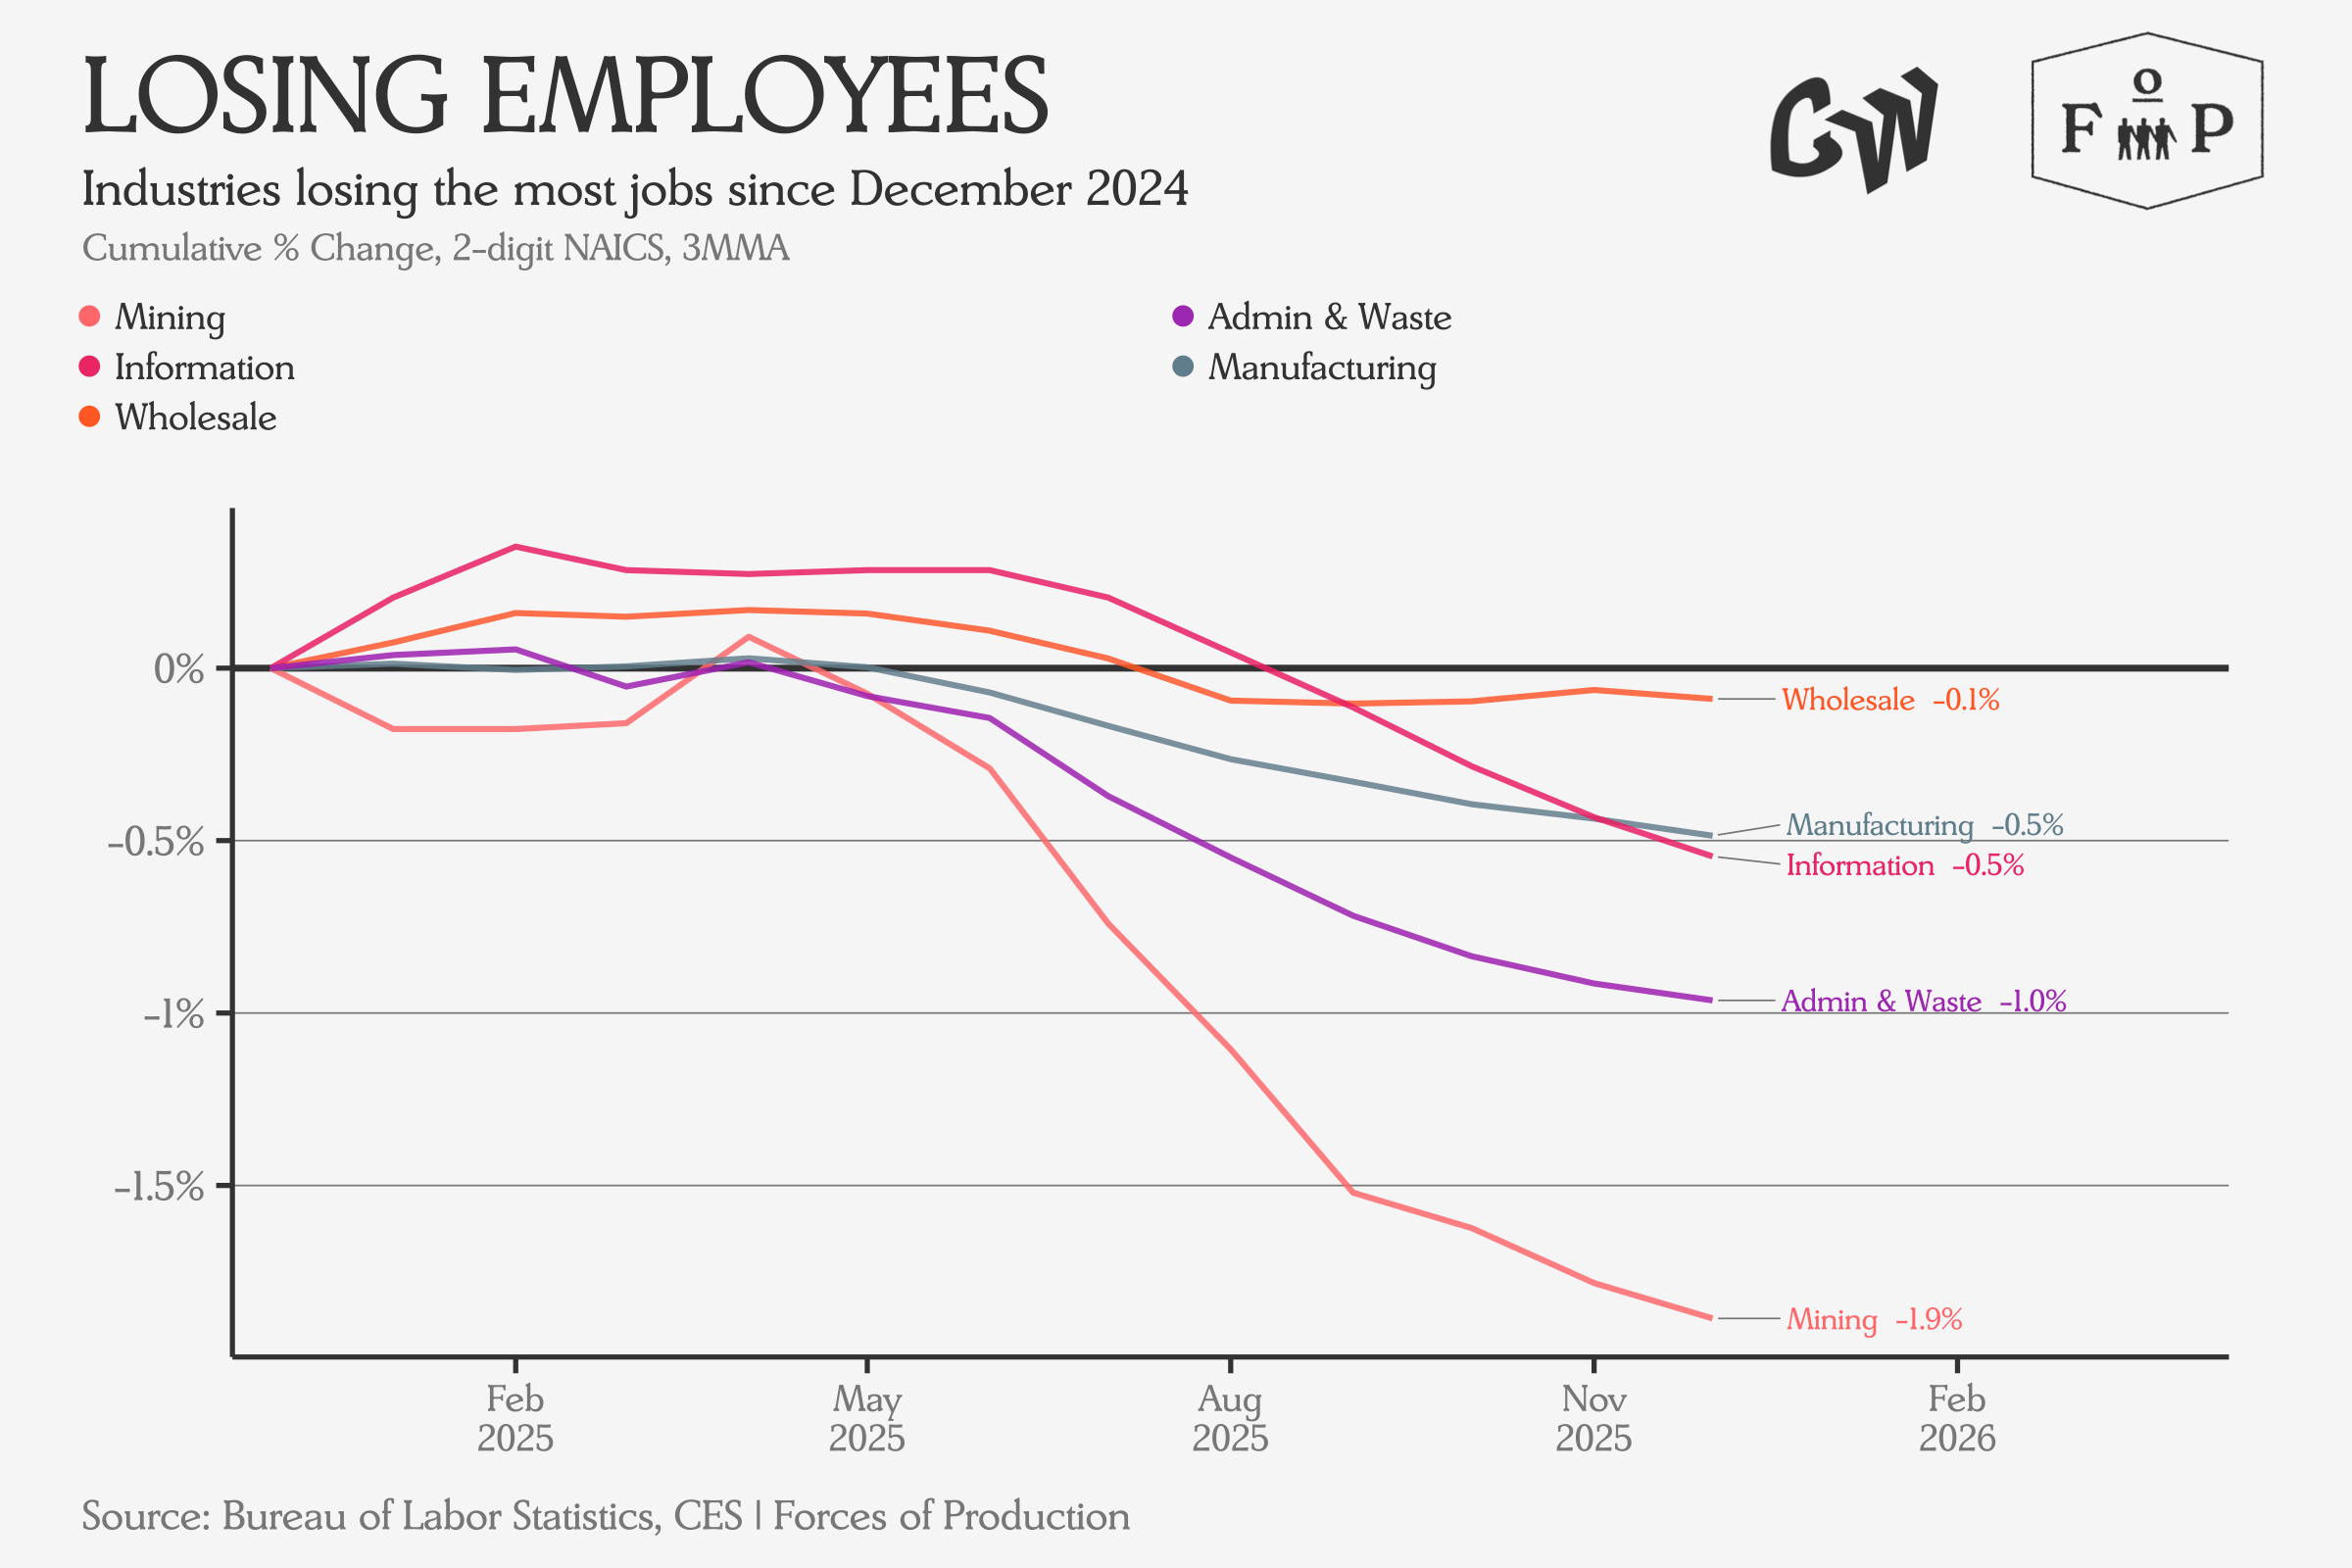
Interestingly given the rising producer prices in the Mining sector, we see the largest employment losses in this sector over the past year, at a 2.2% decline.
Production and Capacity
Industrial Production has begun to grow again in recent months. However, the total level of production has increased less than 2% from the index year in 2017.
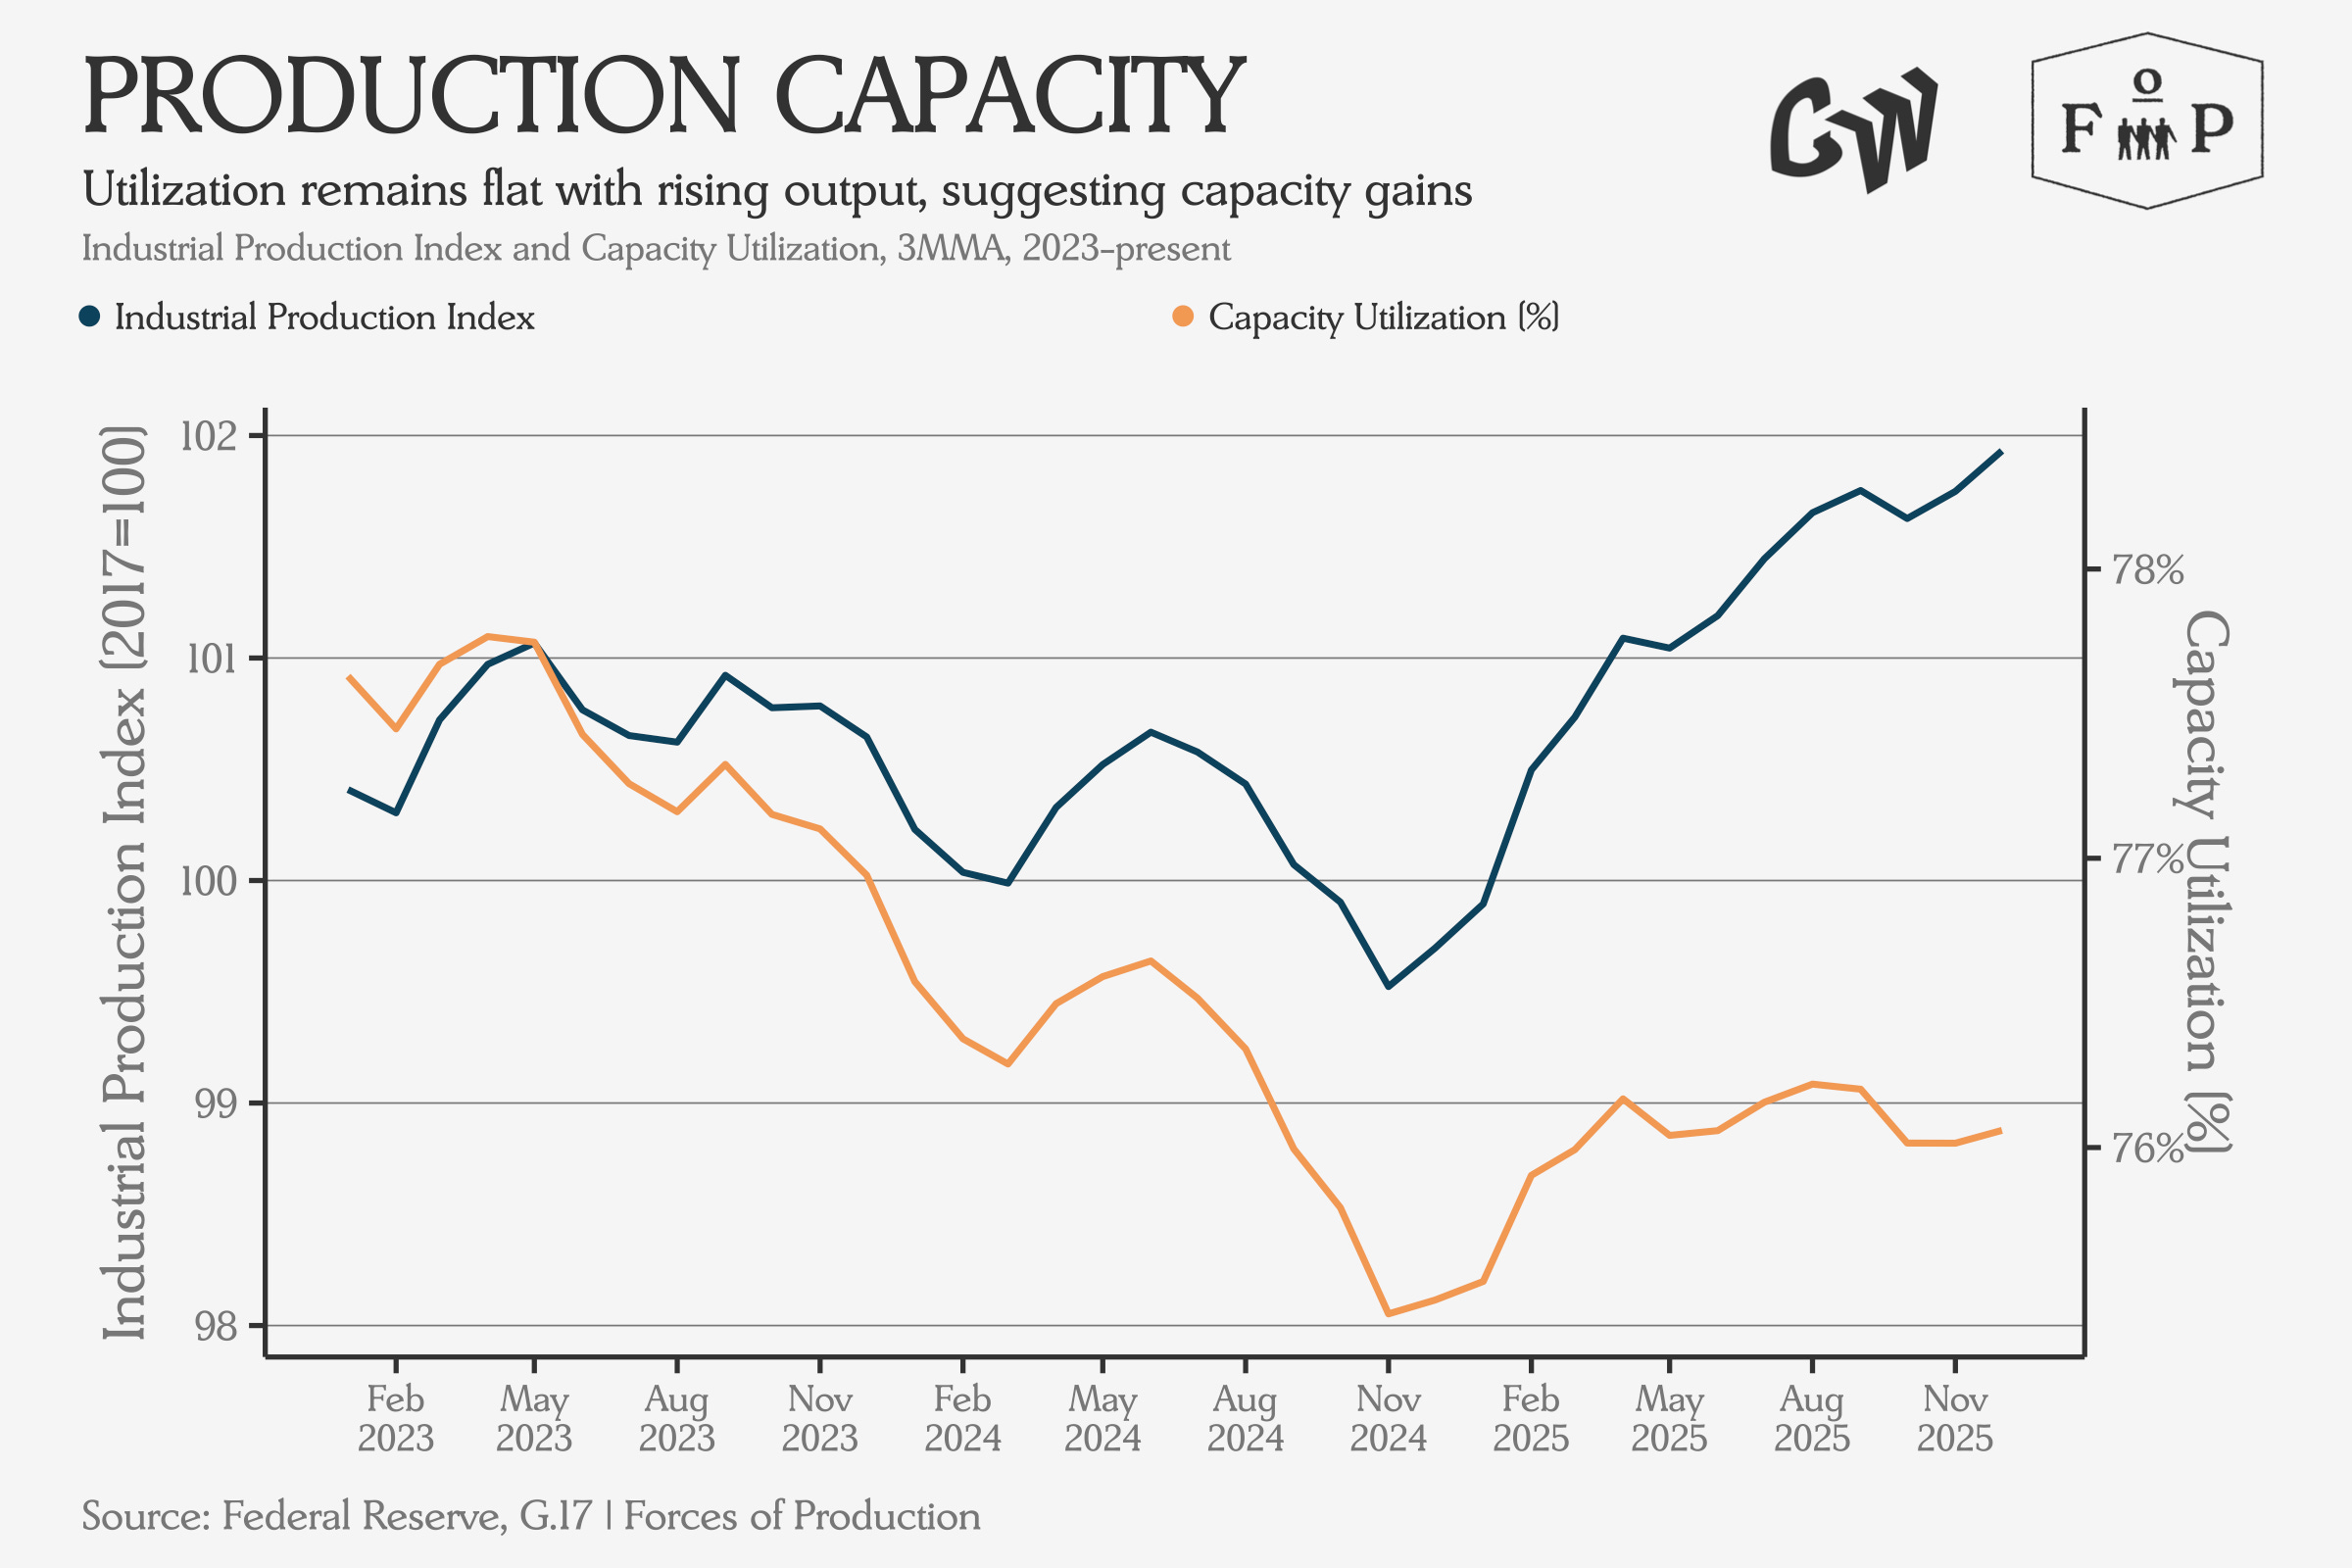
At the aggregate level, manufacturing remains a story of industries shedding workers while adapting production processes to keep output roughly constant.
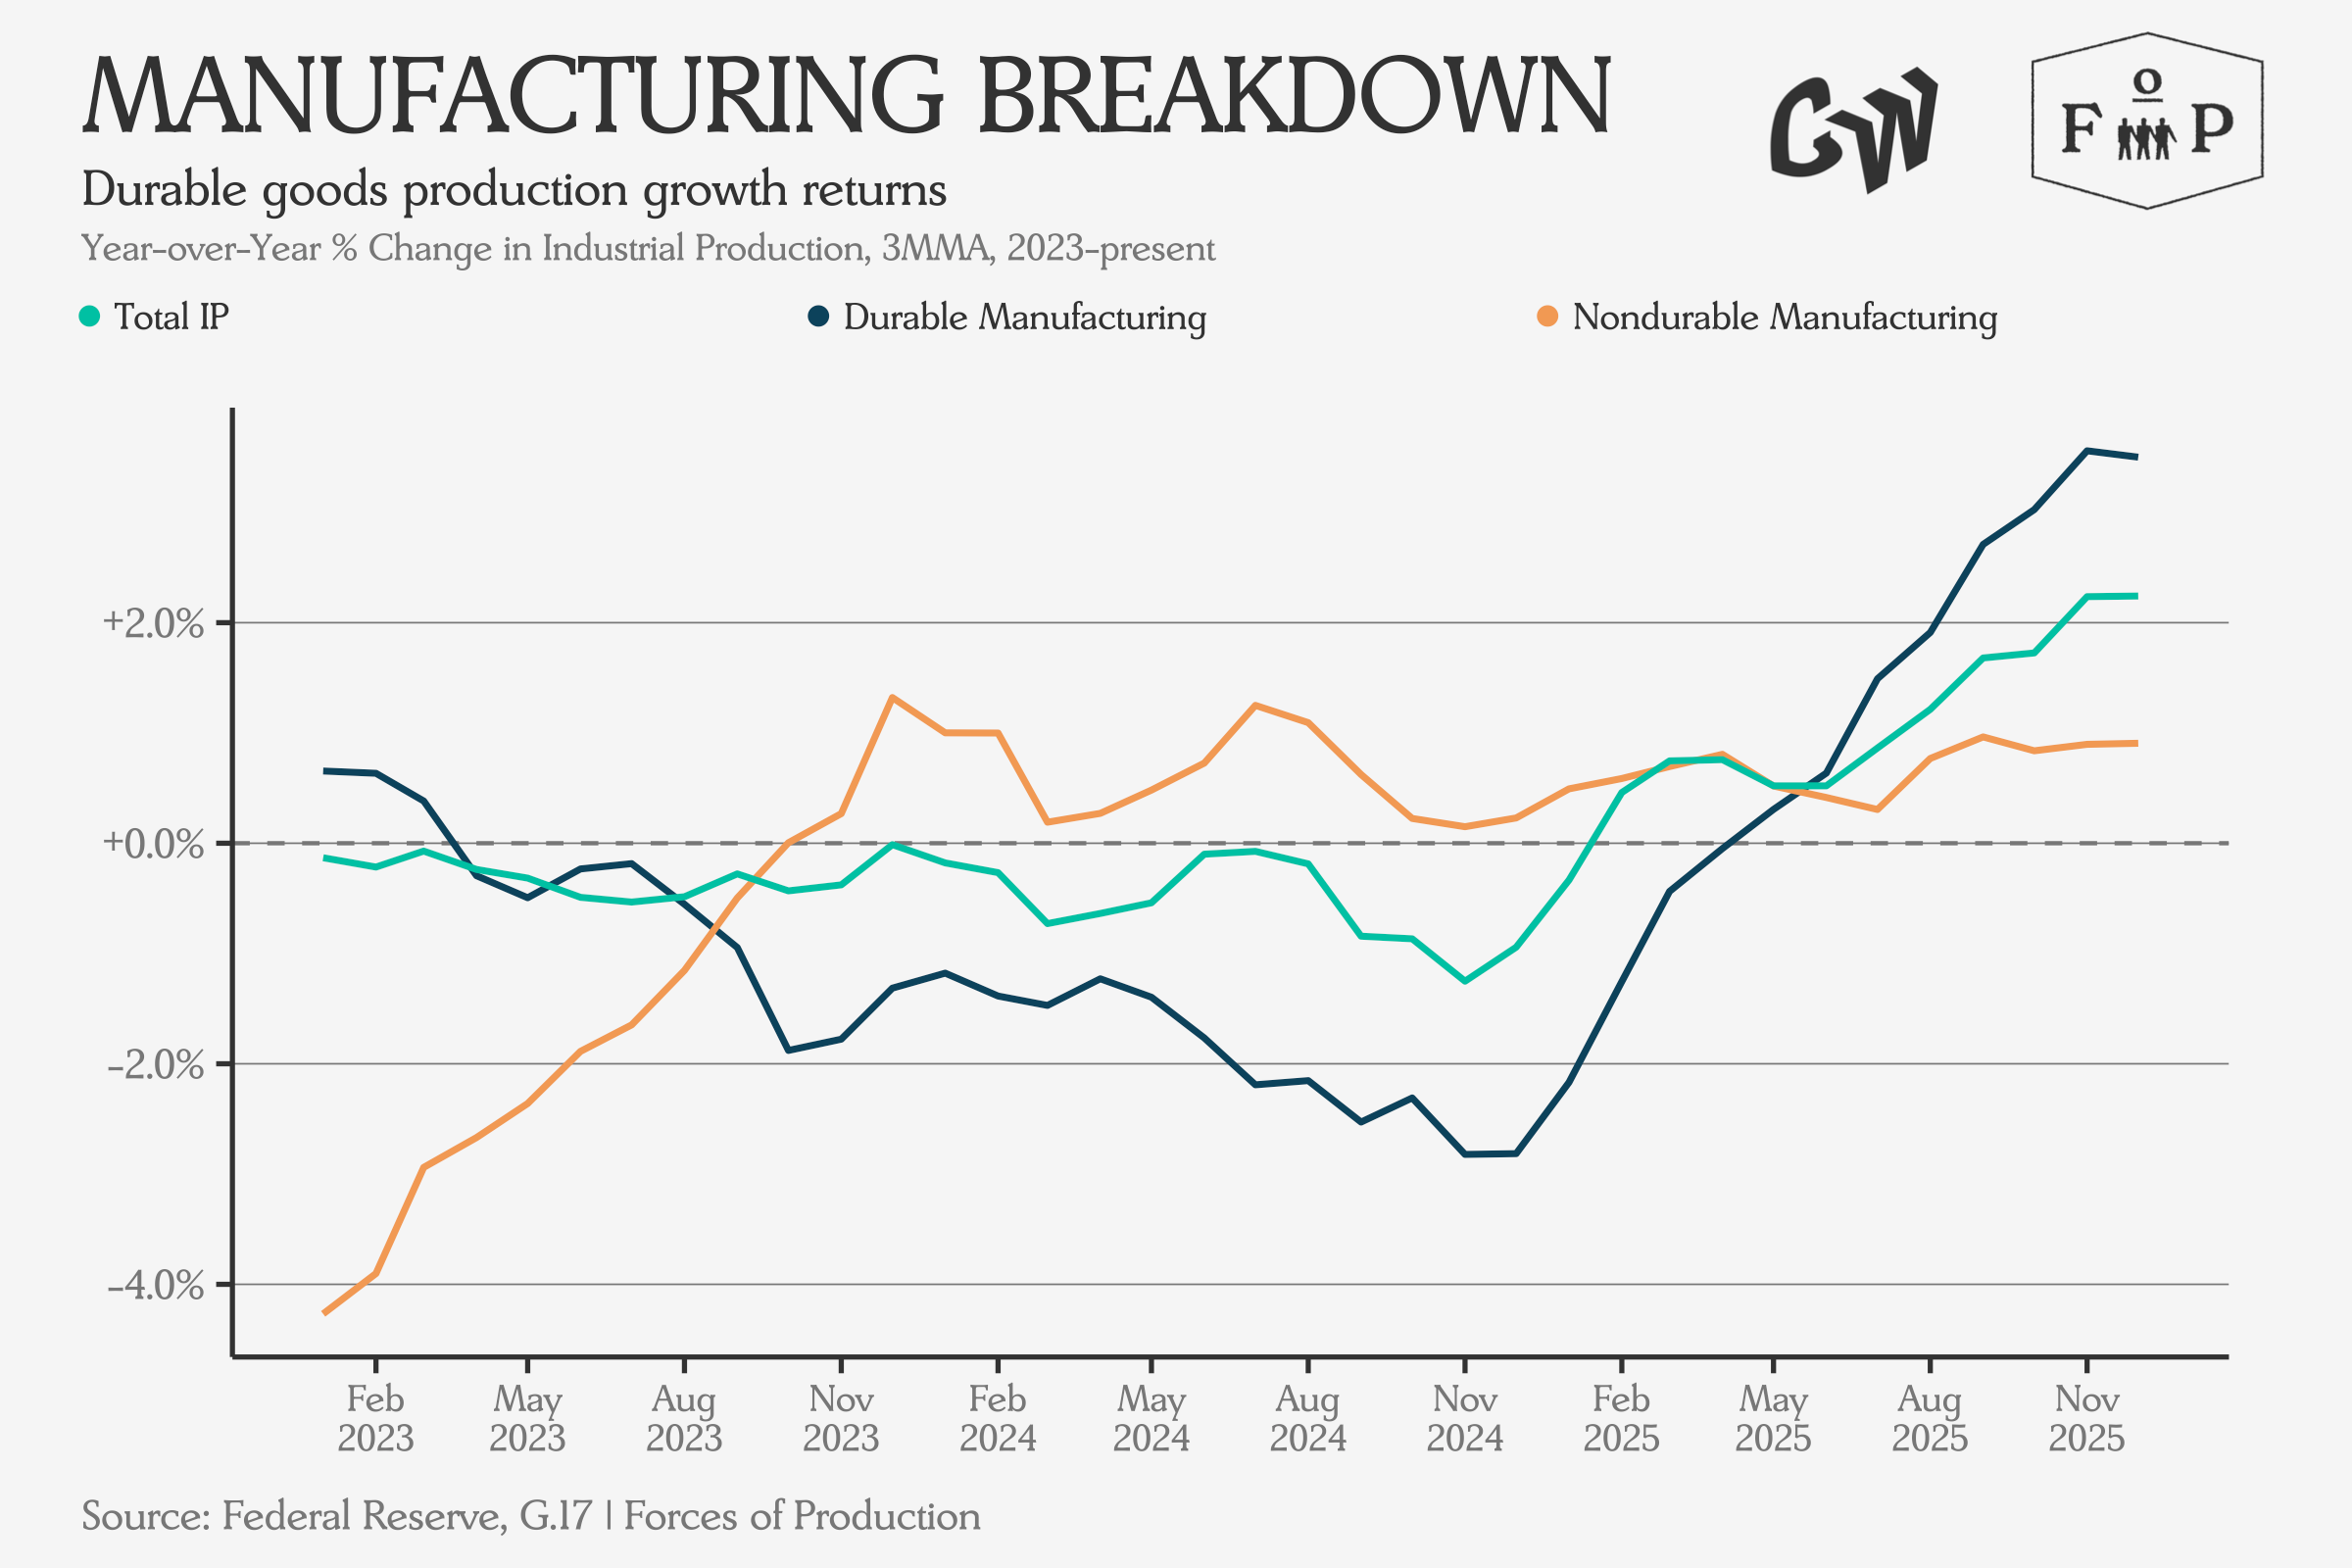
Interestingly, Durable Manufacturing has taken over as the source of output growth, following declines through much of 2023 and 2024.
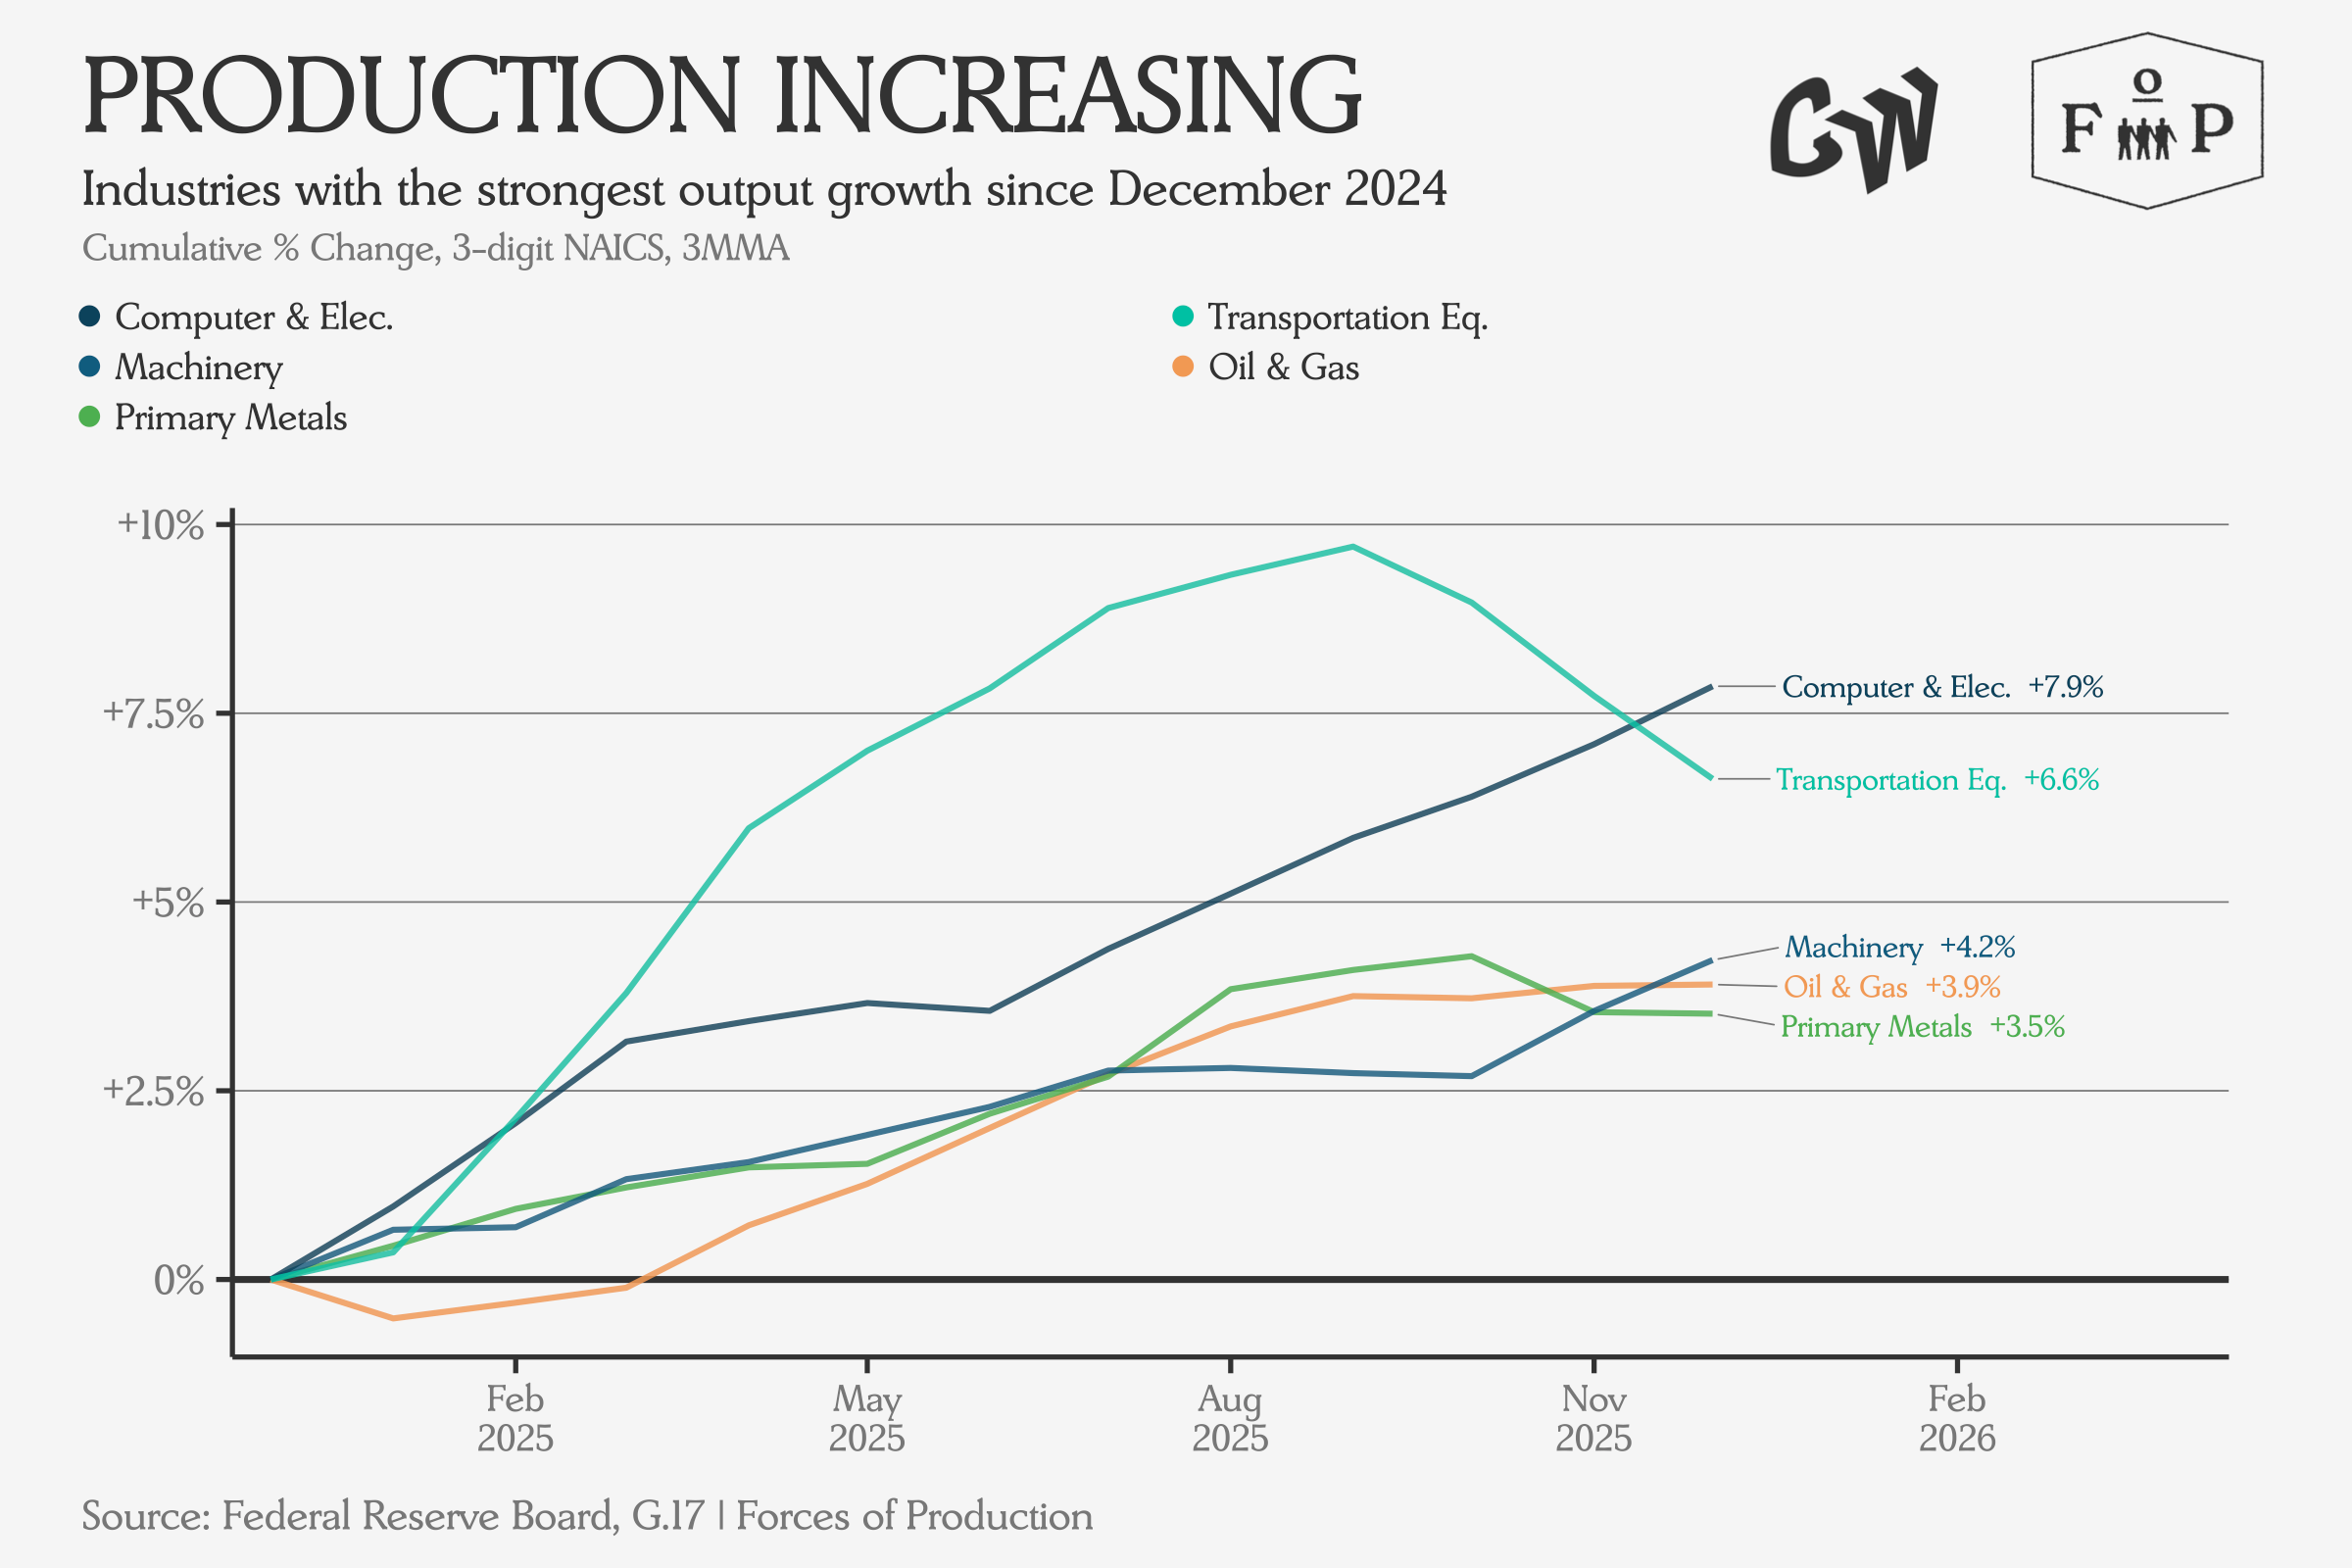
The biggest output gains over the past year have come from industries related to Biden-era industrial policy as well as Oil & Gas Extraction, suggesting that although many industrial policy programs may have been cancelled, the supply side still benefits from the momentum they created.
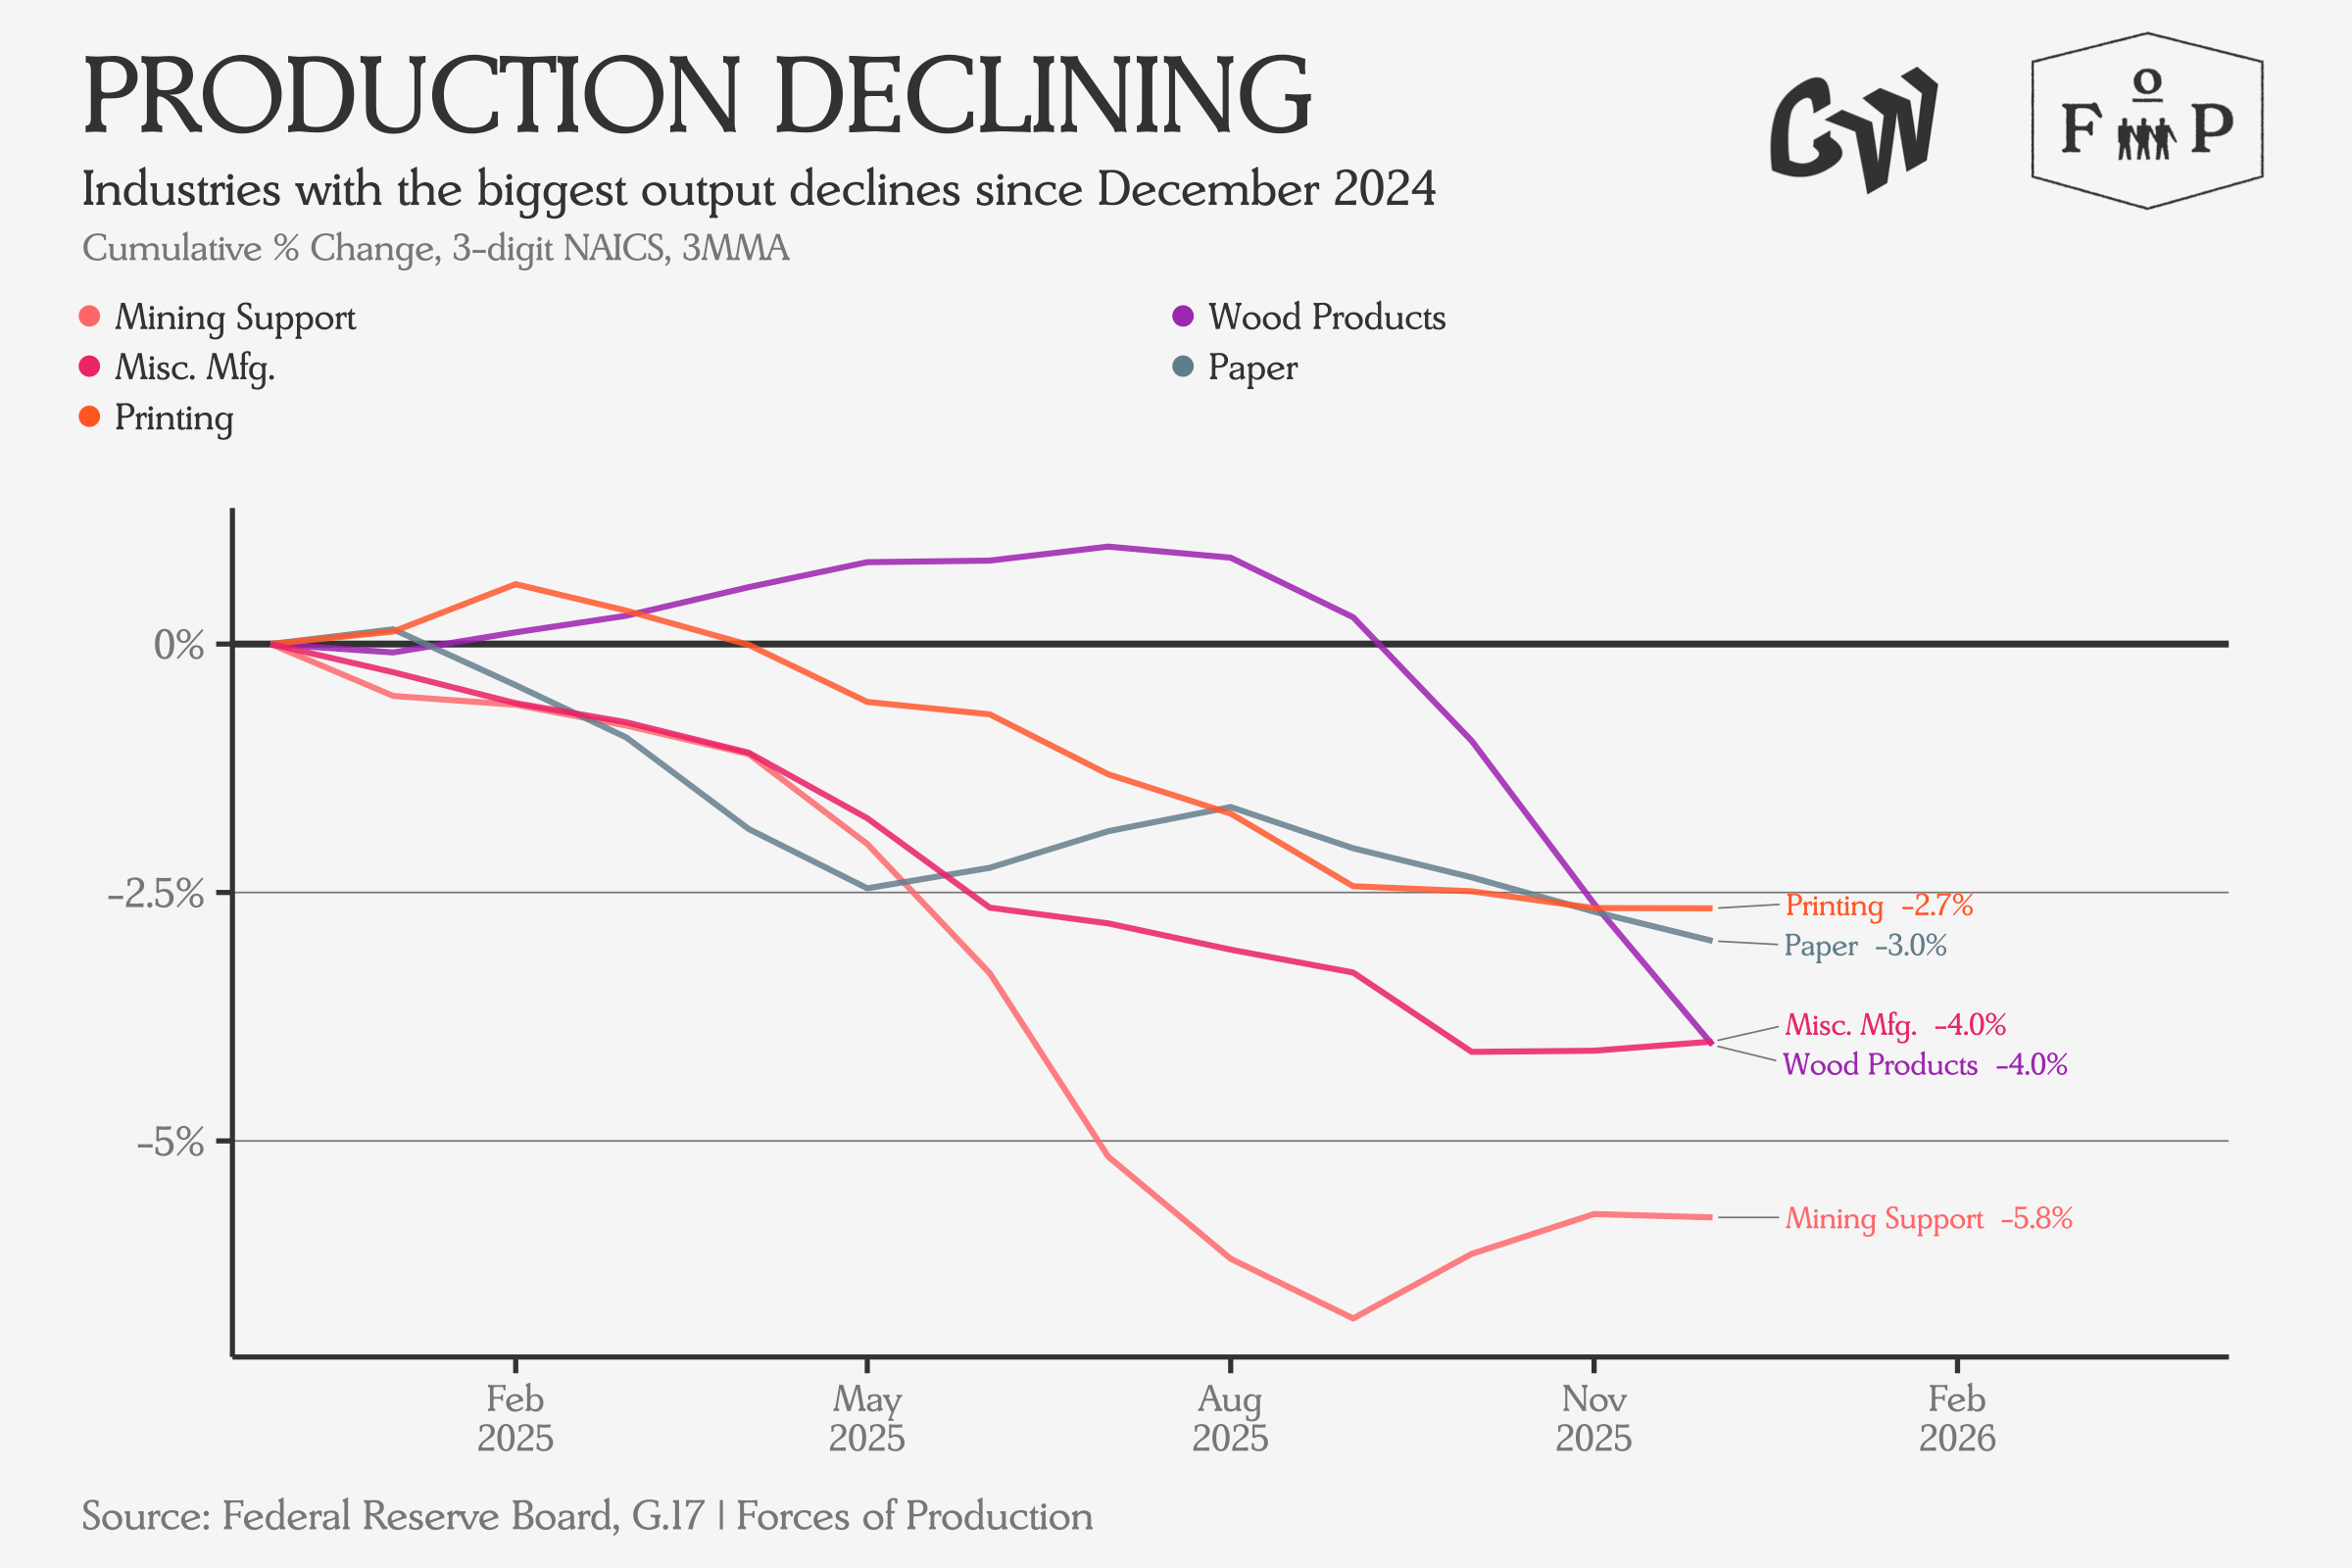
The Wood Products, Paper, and Printing complex continues to show notable production declines.
Overall, Capacity Utilization continues to track the same dynamics as production, with Durable Goods manufacturing leading.
Producer Prices
The Producer Price Index — inflation statistics for goods and services sold to firms rather than consumers — has begun to drift upward again in recent months.
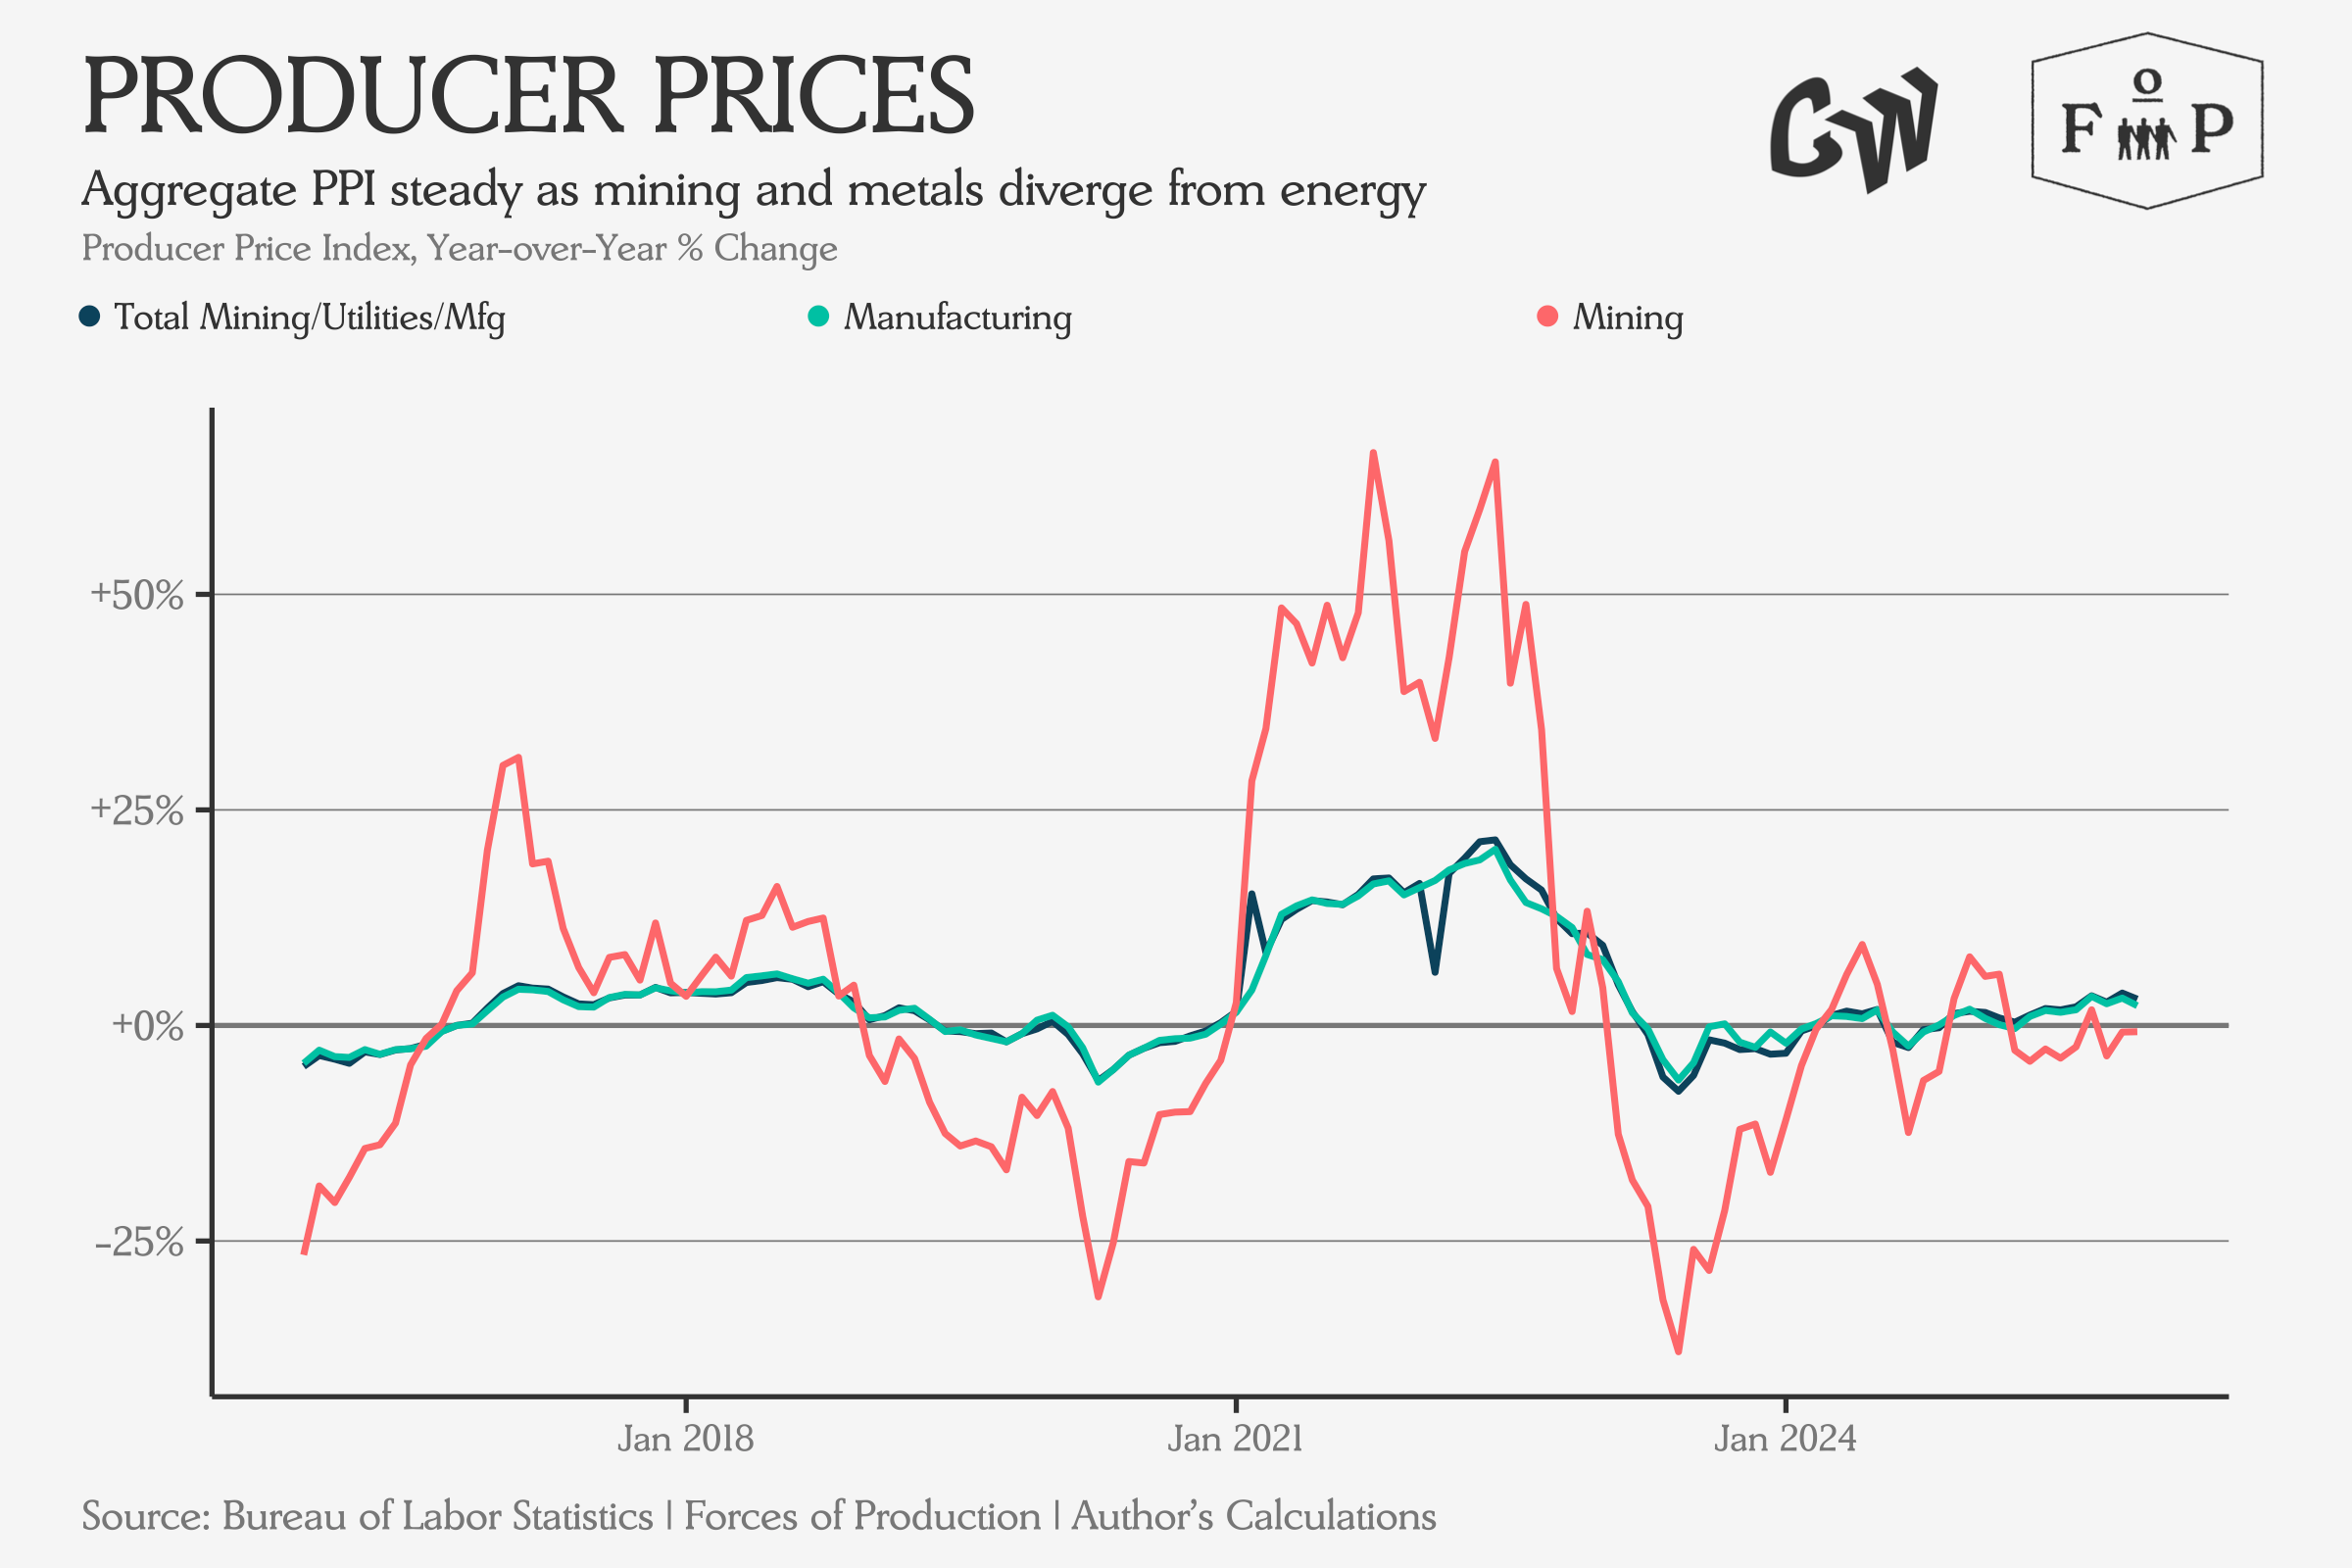
We see the biggest gains in the Producer Price Index at upstream points in the supply chain.
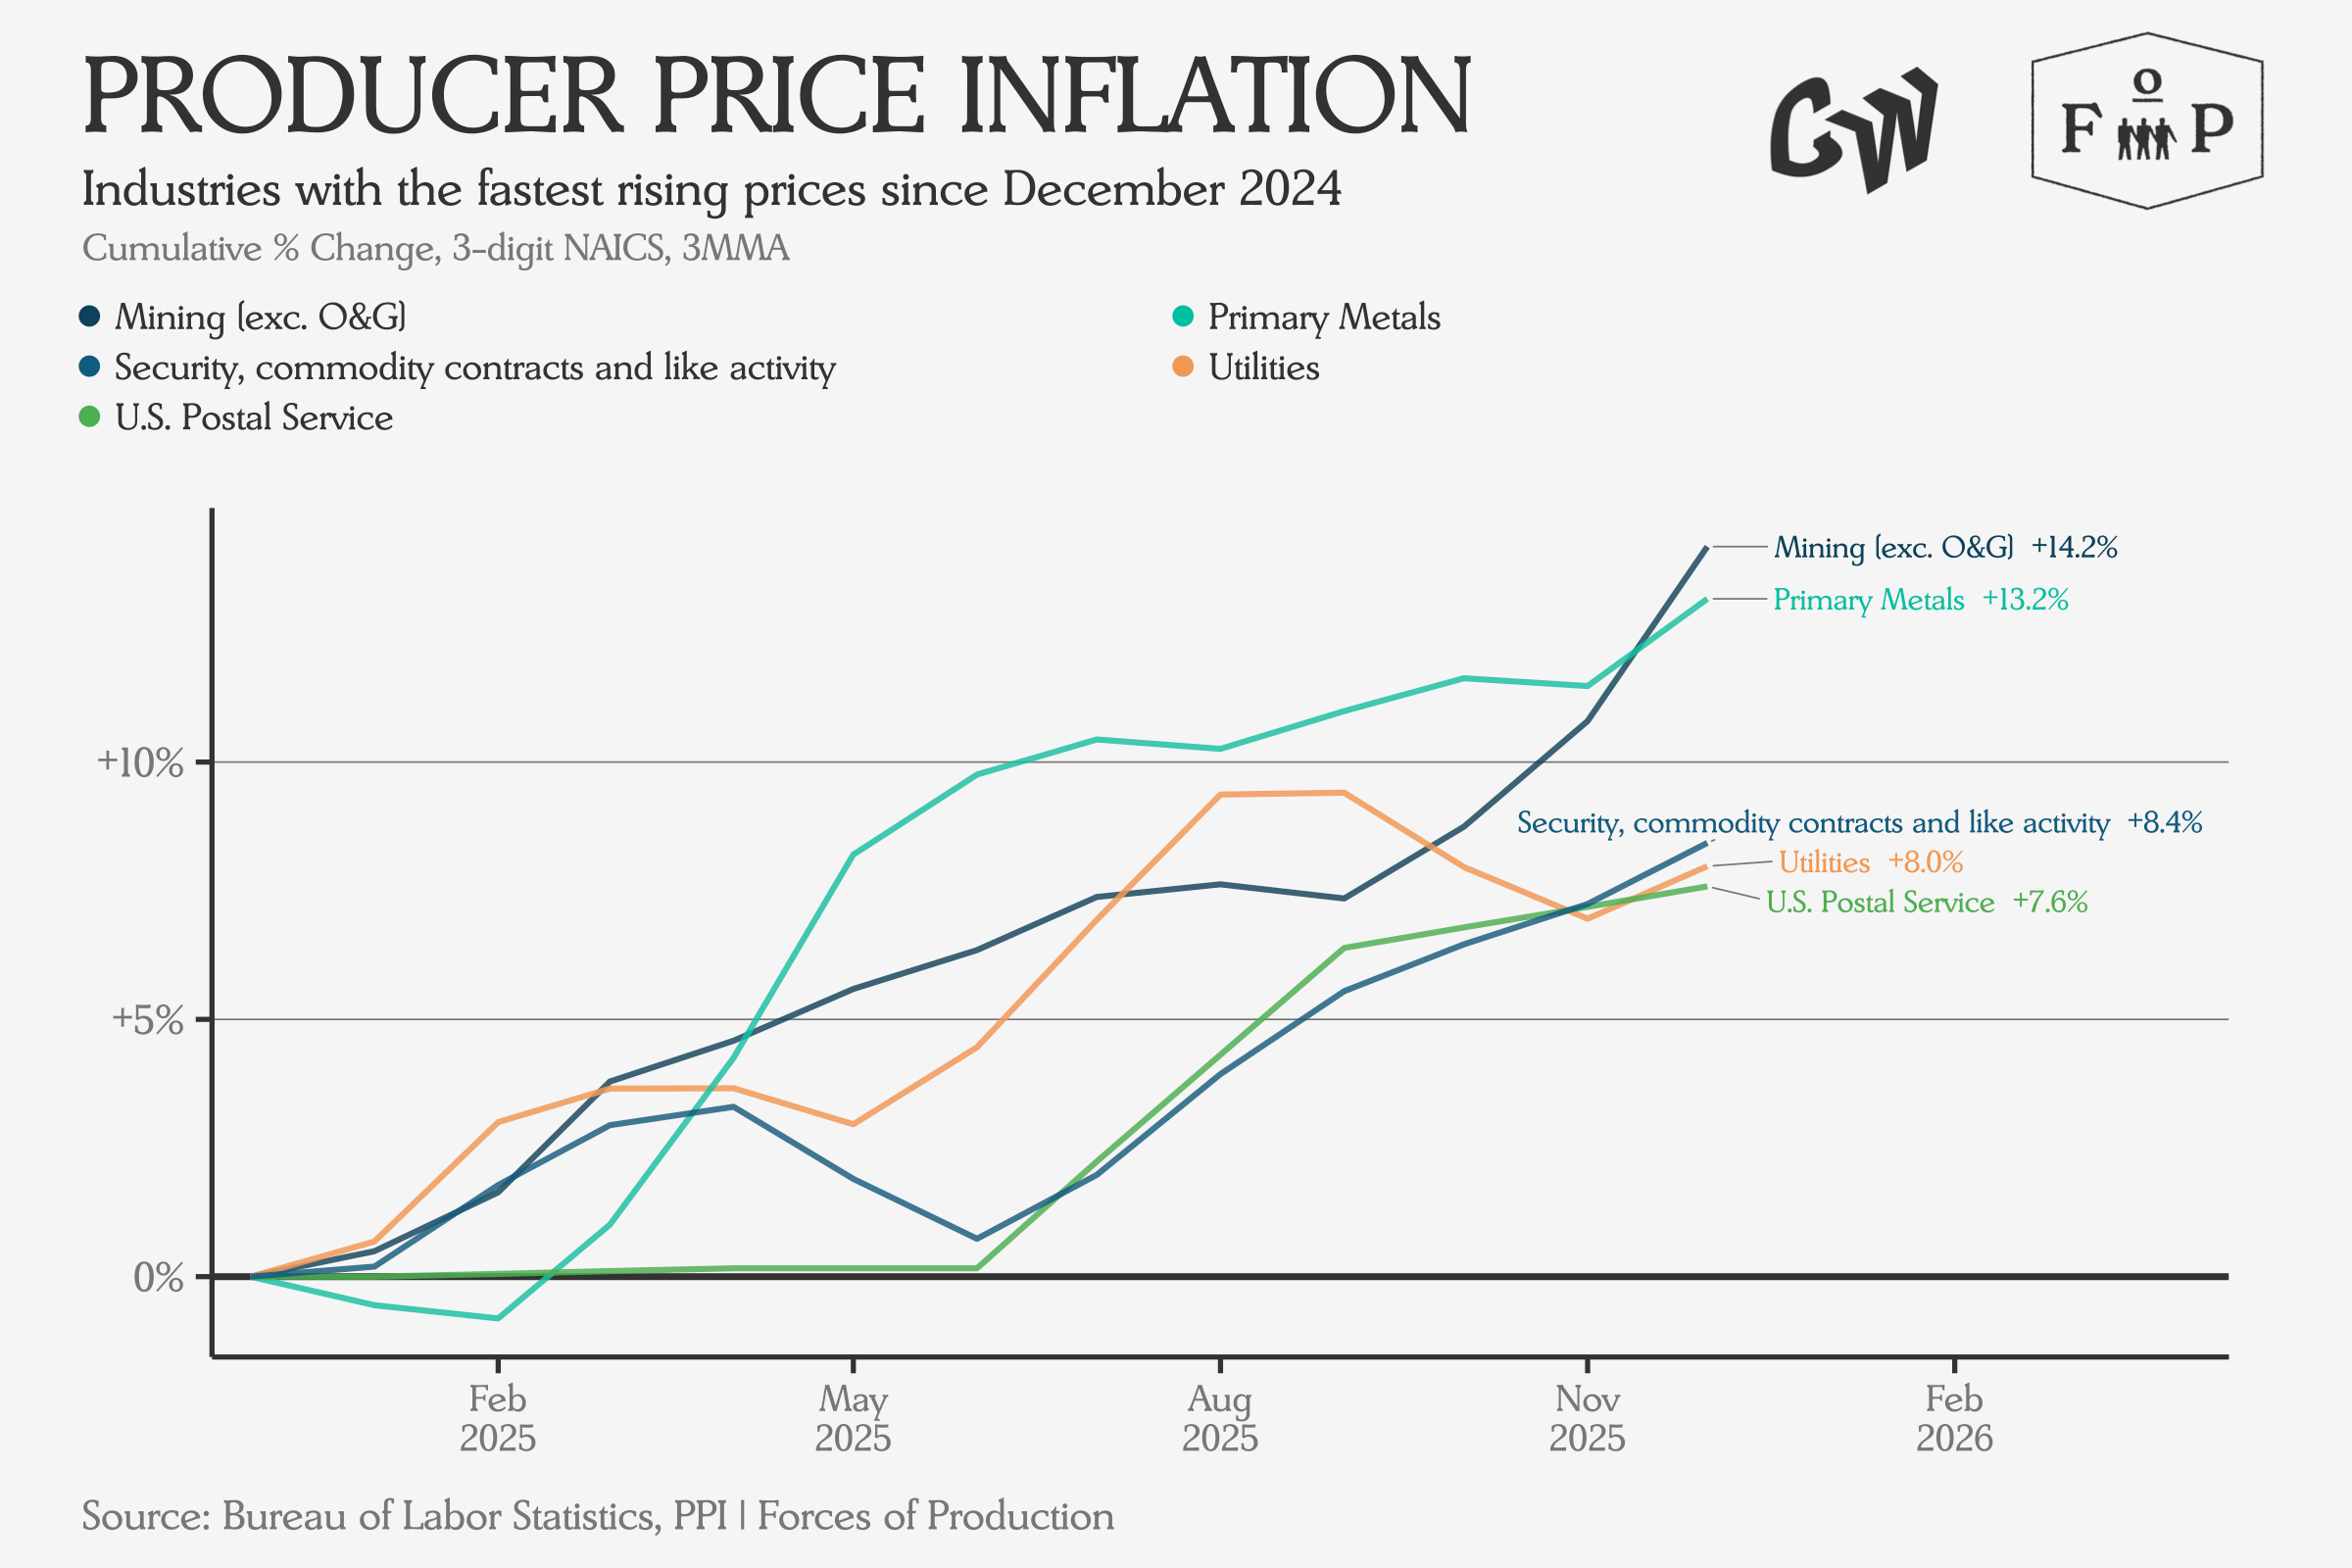
Mining and Primary Metals are significant inputs to a wide range of production processes, and rising costs for Building Materials will also hurt affordability for housing construction. Rising Utilities costs show that increased electricity demand is affecting businesses alongside households.
Analysis
Overall, we have seen surprising inertia across the supply side, despite the extreme shifts in trade policy and consumer confidence. Tariffs are up, and consumer confidence is down, but the supply side of the US economy is like a massive ship. Steering it in a different direction takes a long time, and blowing holes in the side of the hull won’t make it turn much faster.
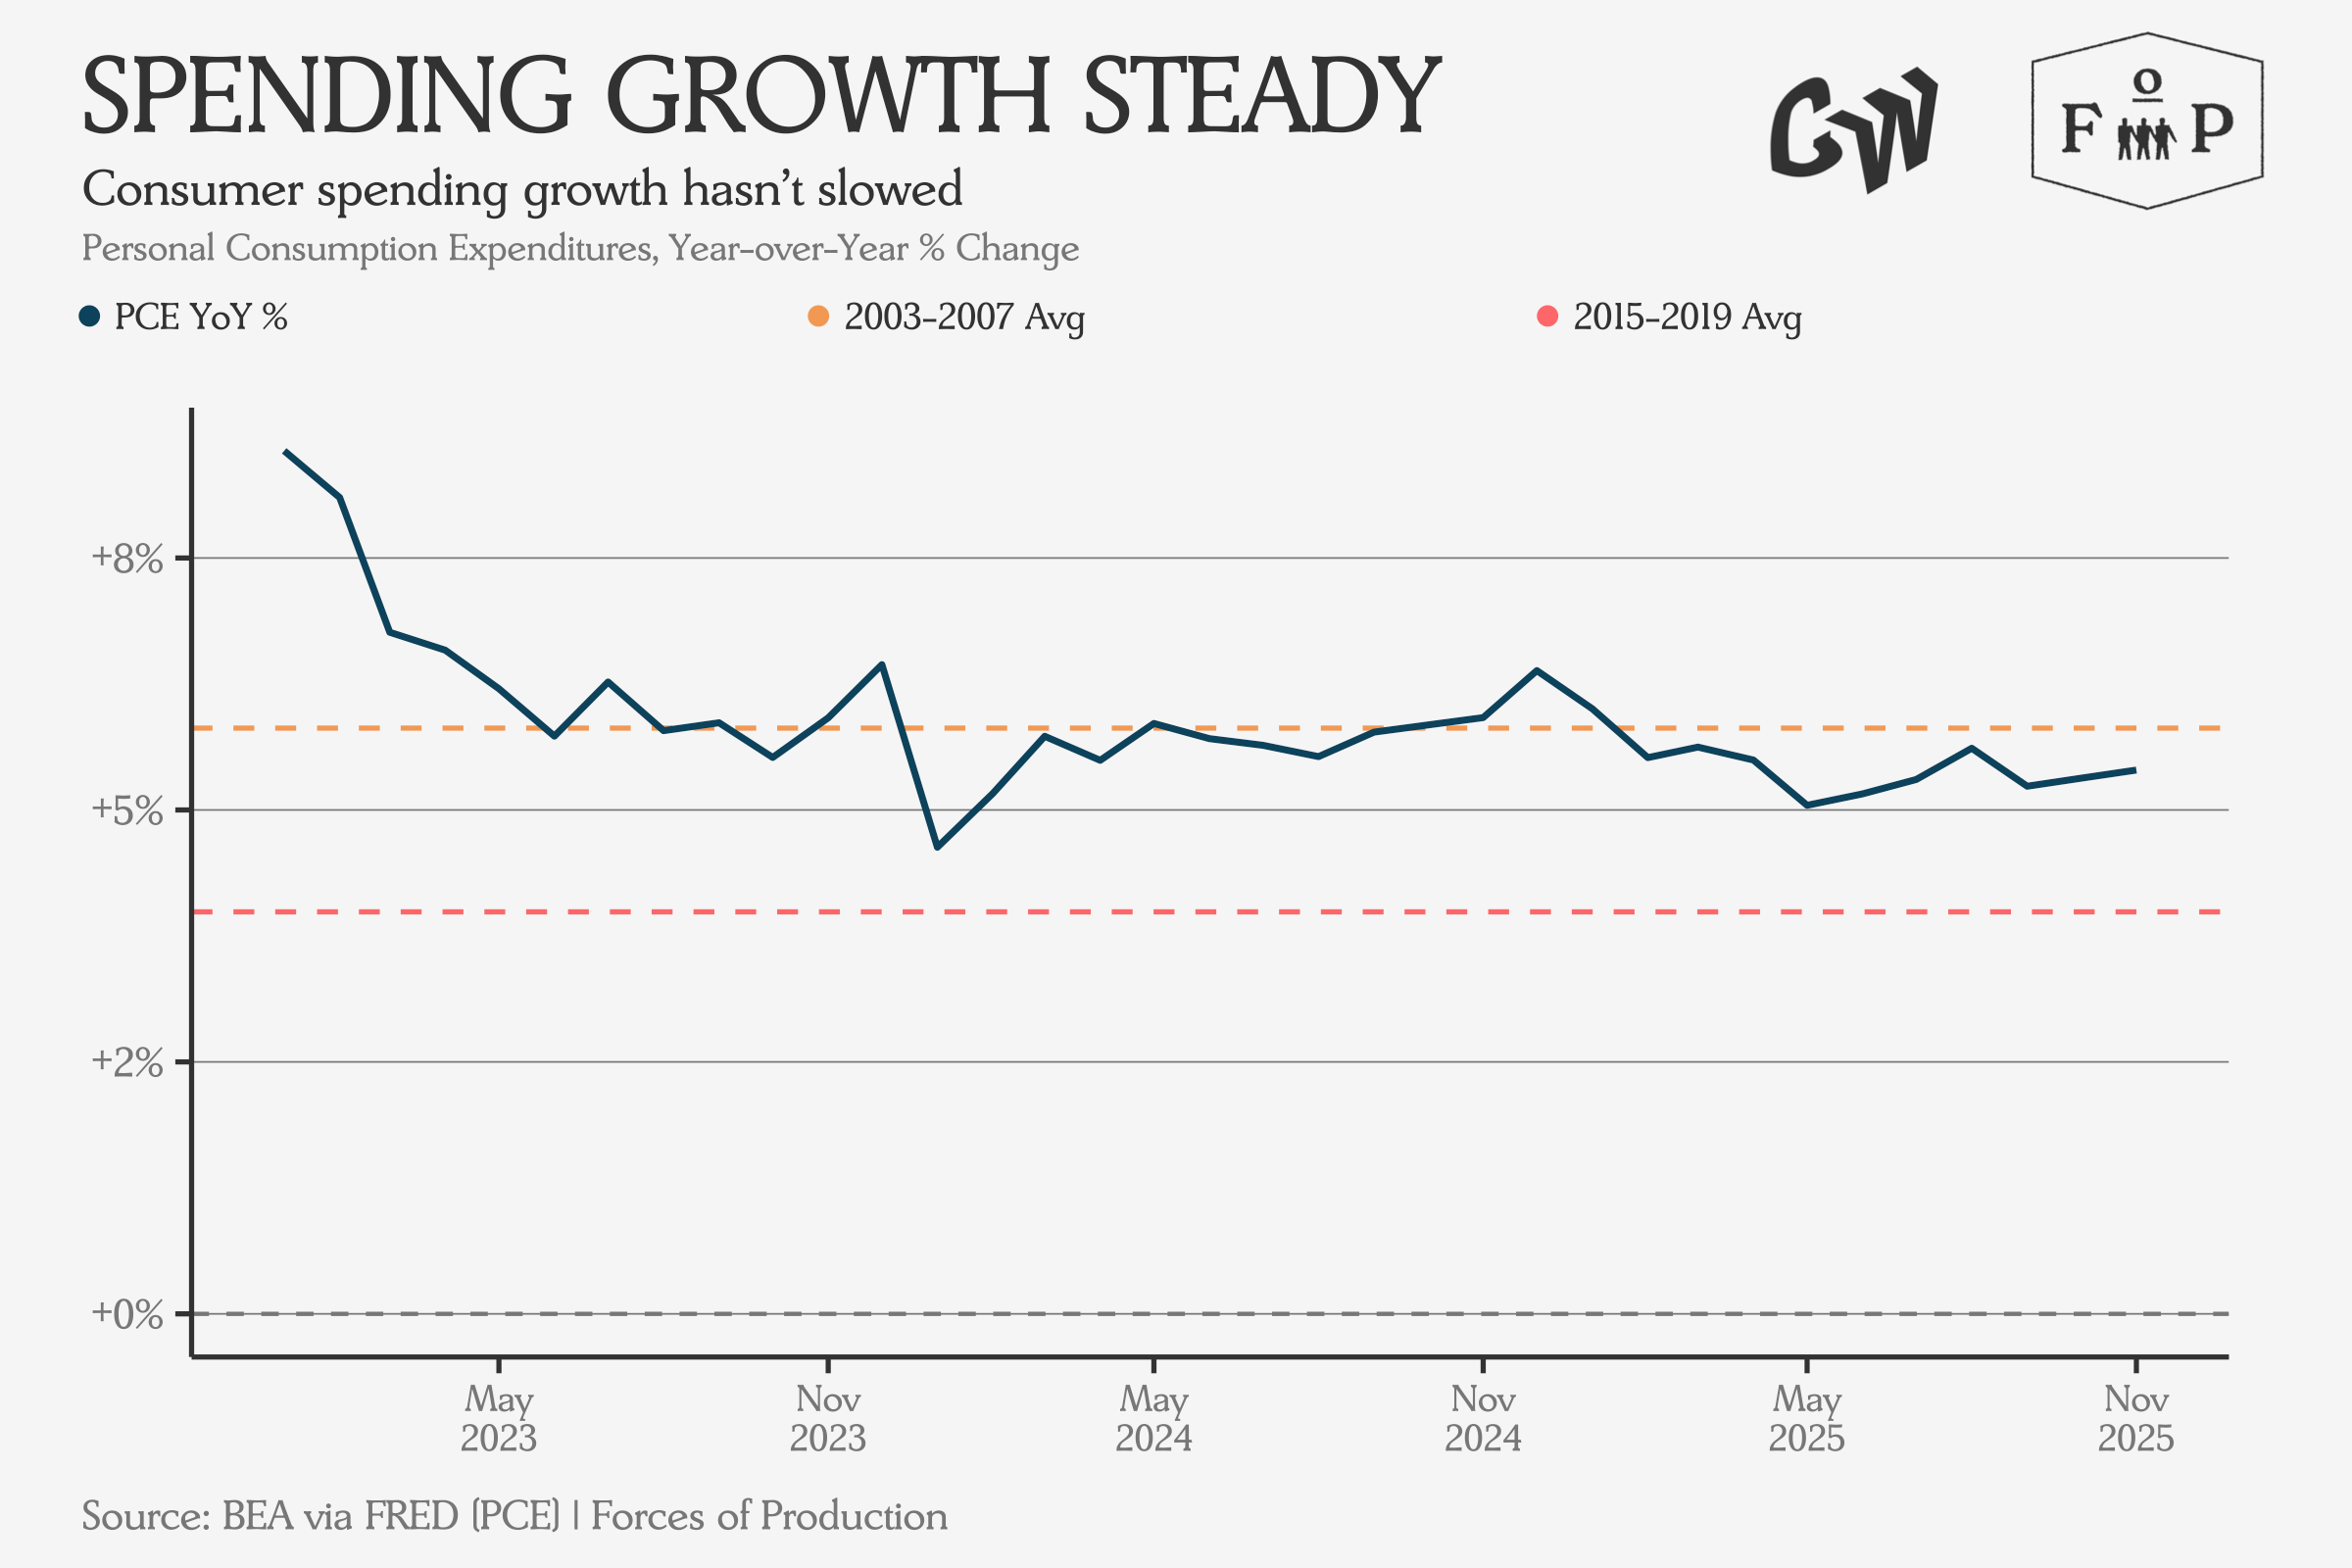
If anything, what’s happening seems like a very old business cycle dynamic. Back in the days of Keynes and Jevons, the market economy was much smaller and cycles were driven more by investment than consumption. Early macroeconomists noticed this and identified a pattern where a slowdown in investment spending would lead to a slowdown in hiring, and in output growth. This could become self-reinforcing, because the decision to invest less was validated by the lower consumer demand from lower hiring. Since today’s economy is much more insulated by consumption spending, which remains high, this dynamic can still produce a slowdown, but it will likely be muted, protracted, and mild on its own.
Despite this, the uncertainty created by a more volatile global geopolitical situation and nonsensical domestic economic policy does seem to be having an effect on investment, at least outside of AI. Manufacturers have been saying as much in Federal Reserve surveys all year.
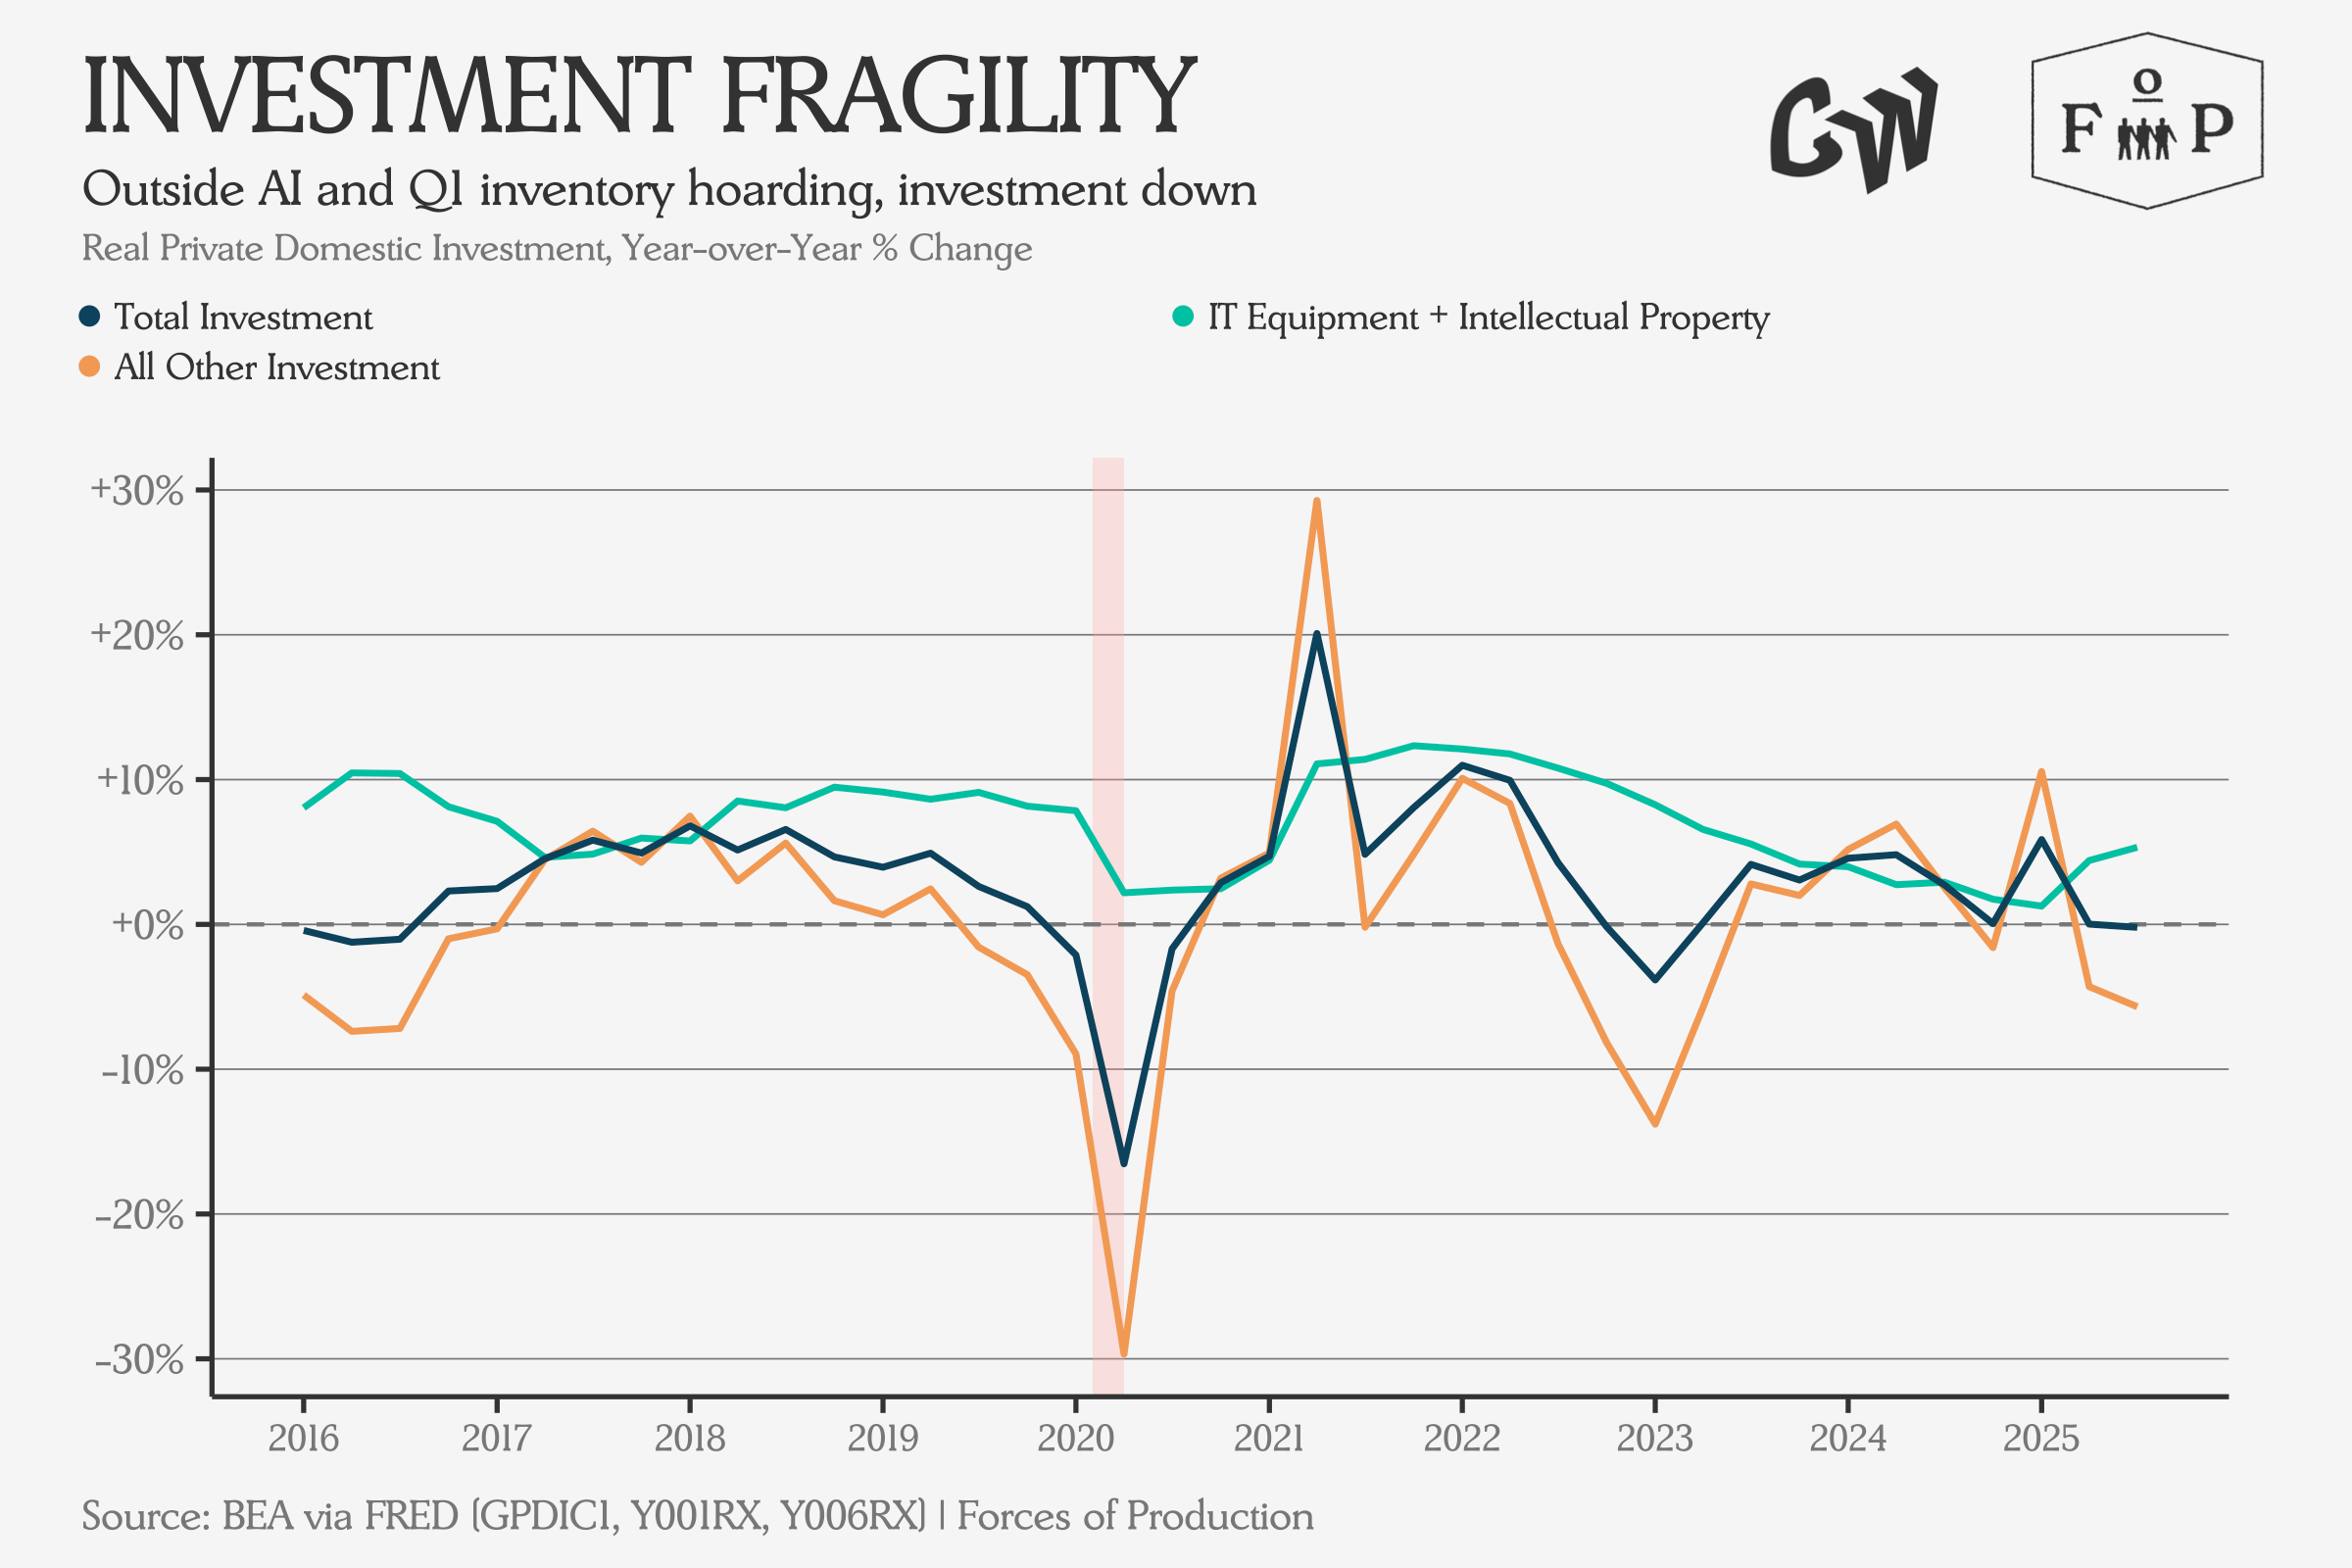
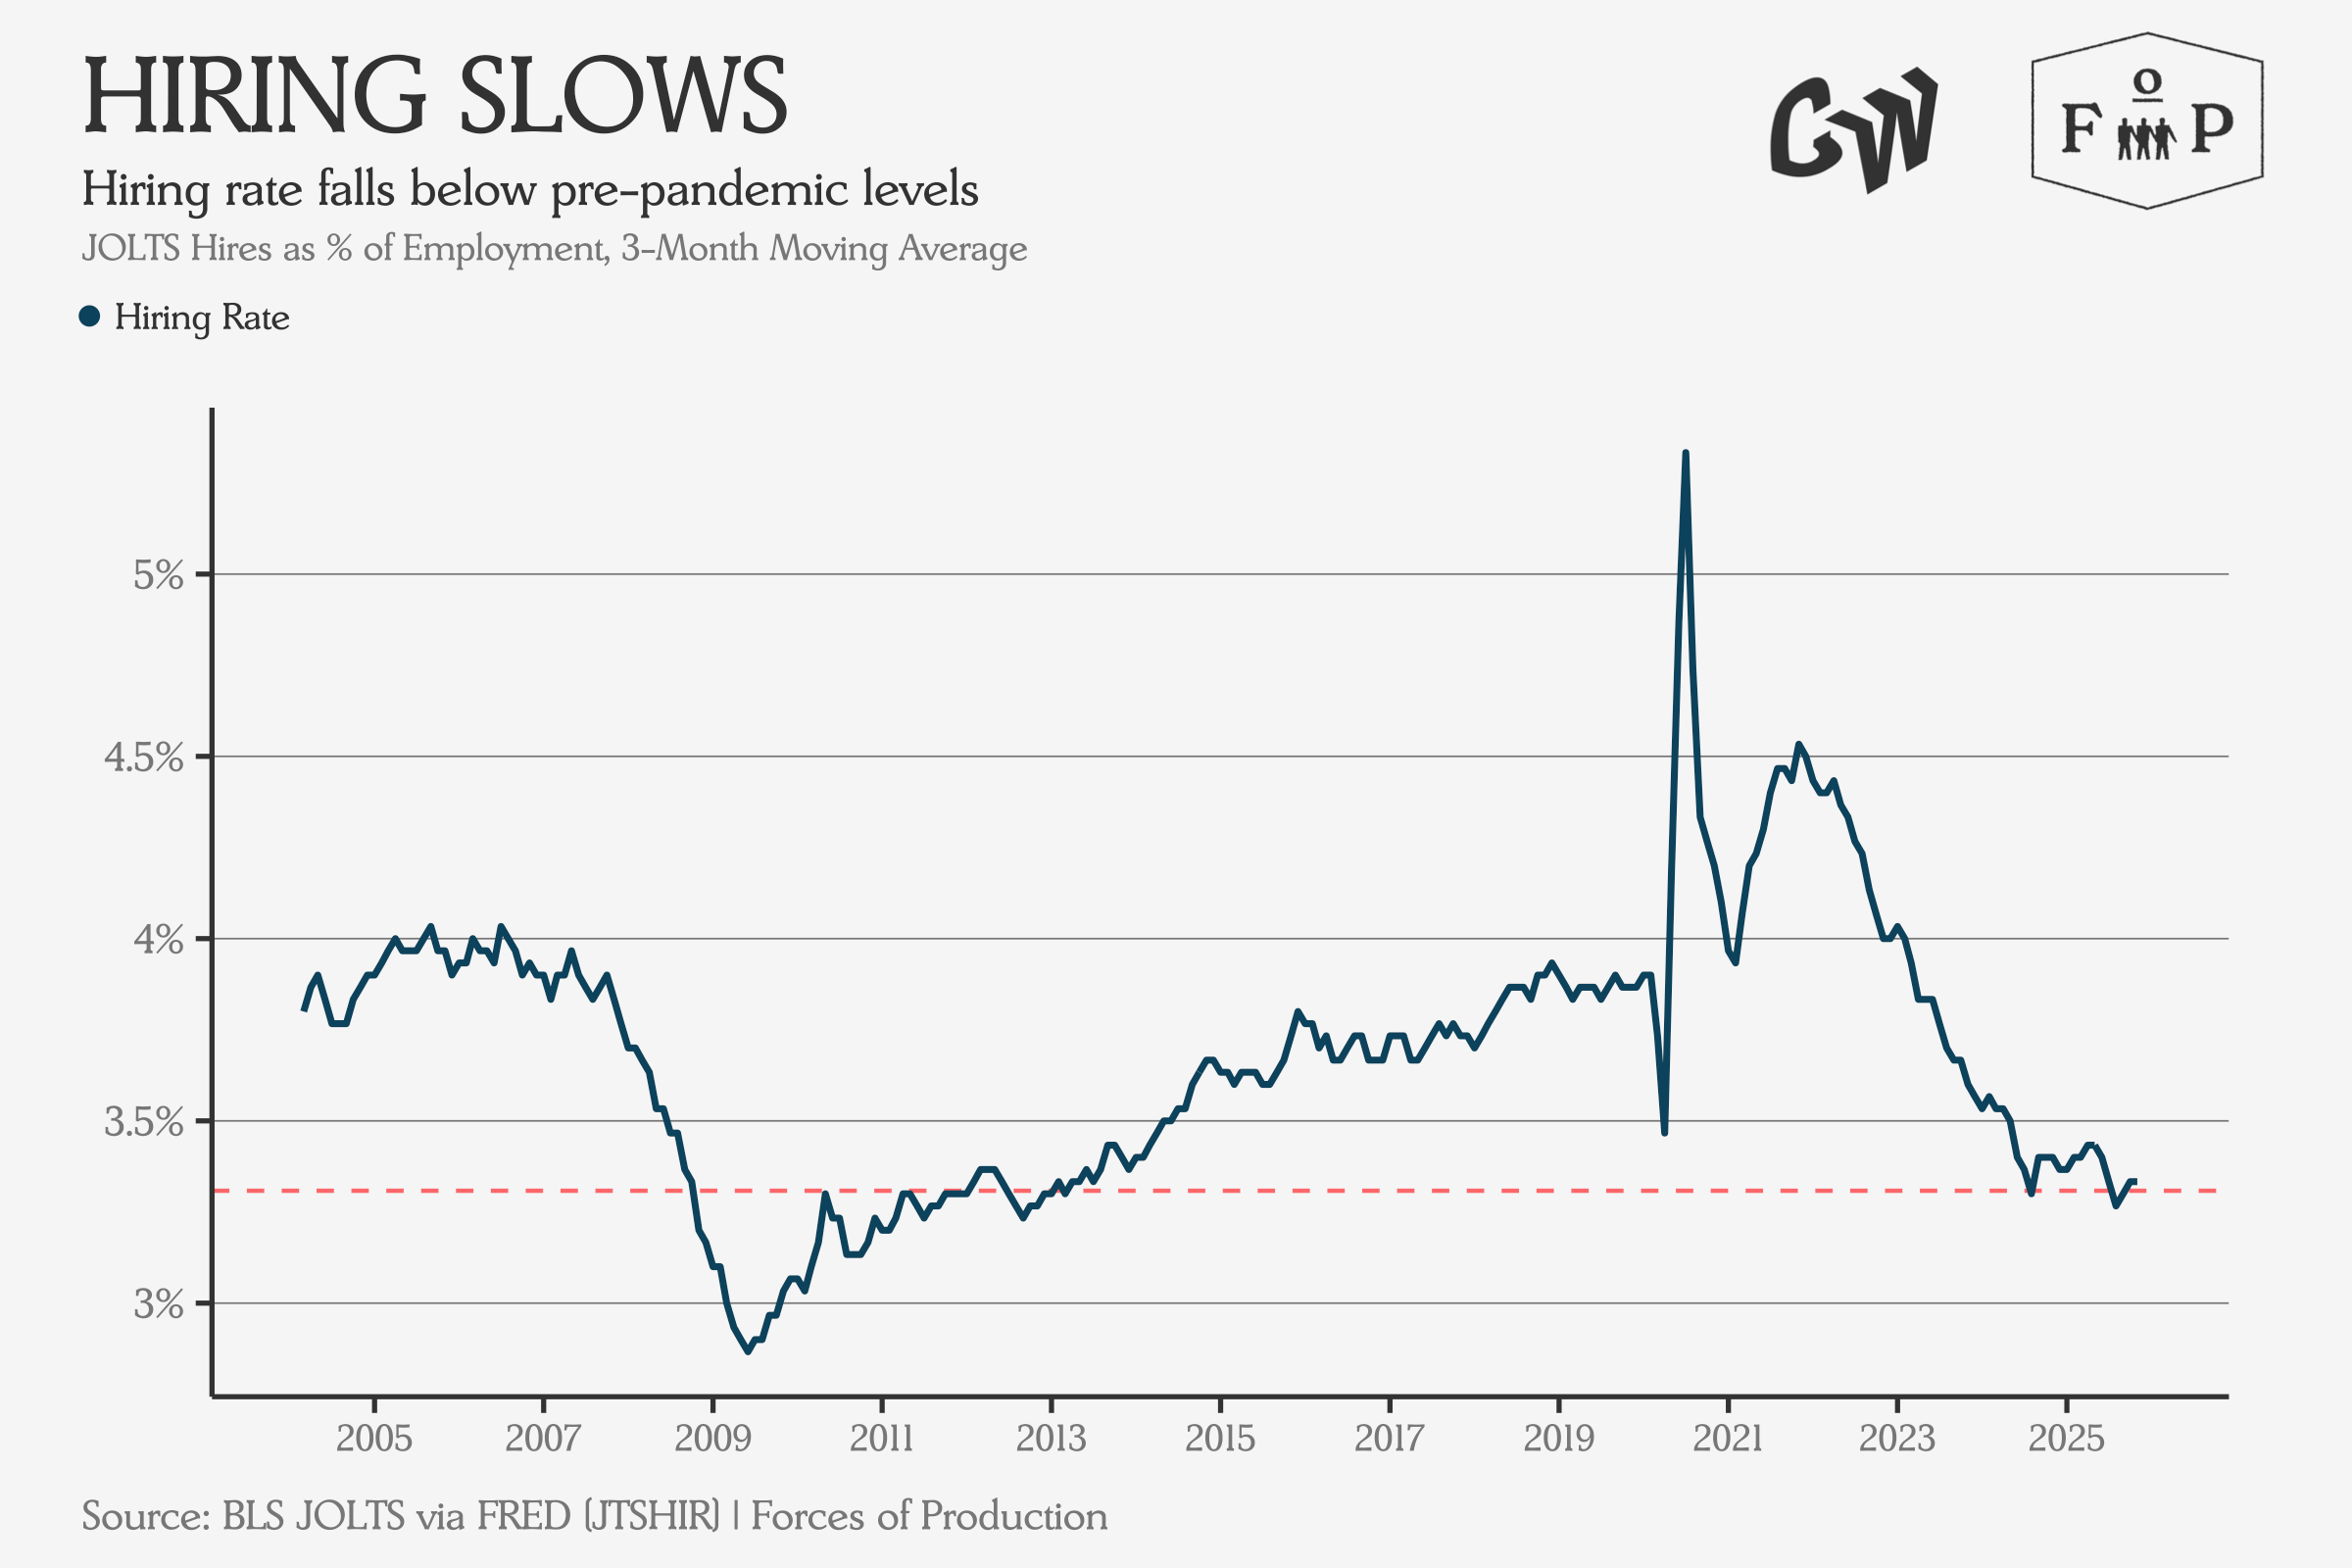
There is also evidence that this slowdown is feeding through to employment, with a lower hiring rate than any point in over a decade in 2025.