

A Chain Reaction
Asking about oil shocks using the input-output tables

As predicted at the end of last month’s newsletter, this month we are talking about oil.

And, as, I guess, predicted by Larry Summers in 2023, inflation is on its way back. The US has started a war with Iran, seemingly with the strategic goal of increasing inflation by creating a second 1970s-style oil shock. As a longstanding advocate for “Team Transitory” during the pandemic inflation, I have to admit, I did not see that one coming. Although to be fair, Paul Krugman didn’t either.
But an oil shock is also a great opportunity to explain the idea of “systemically significant prices”, and show how the mathematical machinery used to identify those prices can produce benchmark forecasts for inflation when supply shocks happen. The Consumer Price Index (CPI) data released last Friday show headline inflation of 0.87 percent month-over-month (11 percent annualized!), of which 0.67 percentage points — more than three quarters — came from direct energy price increases alone. The method we work through here would lead us to expect a further price increase on the order of 0.85 percentage points over the next few months as indirect effects push price increases through the supply side.
By now, we all know the basics. On February 28, the US and Israel attacked Iran, and Iran retaliated by closing the Strait of Hormuz to oil tankers. As we are drafting this newsletter, it is not clear how many directions this conflict will take, how and when it will be resolved, or how stable any resolution will prove. Even stockpickers are putting boots on the ground to monitor the situation at the Strait. Last week, the plan seemed to be for Iran to start charging tankers a buck a barrel to cross, but by the time you read this, it will likely be something else entirely.
The qualitative shape of an oil shock is familiar, but a shock of this magnitude is not.
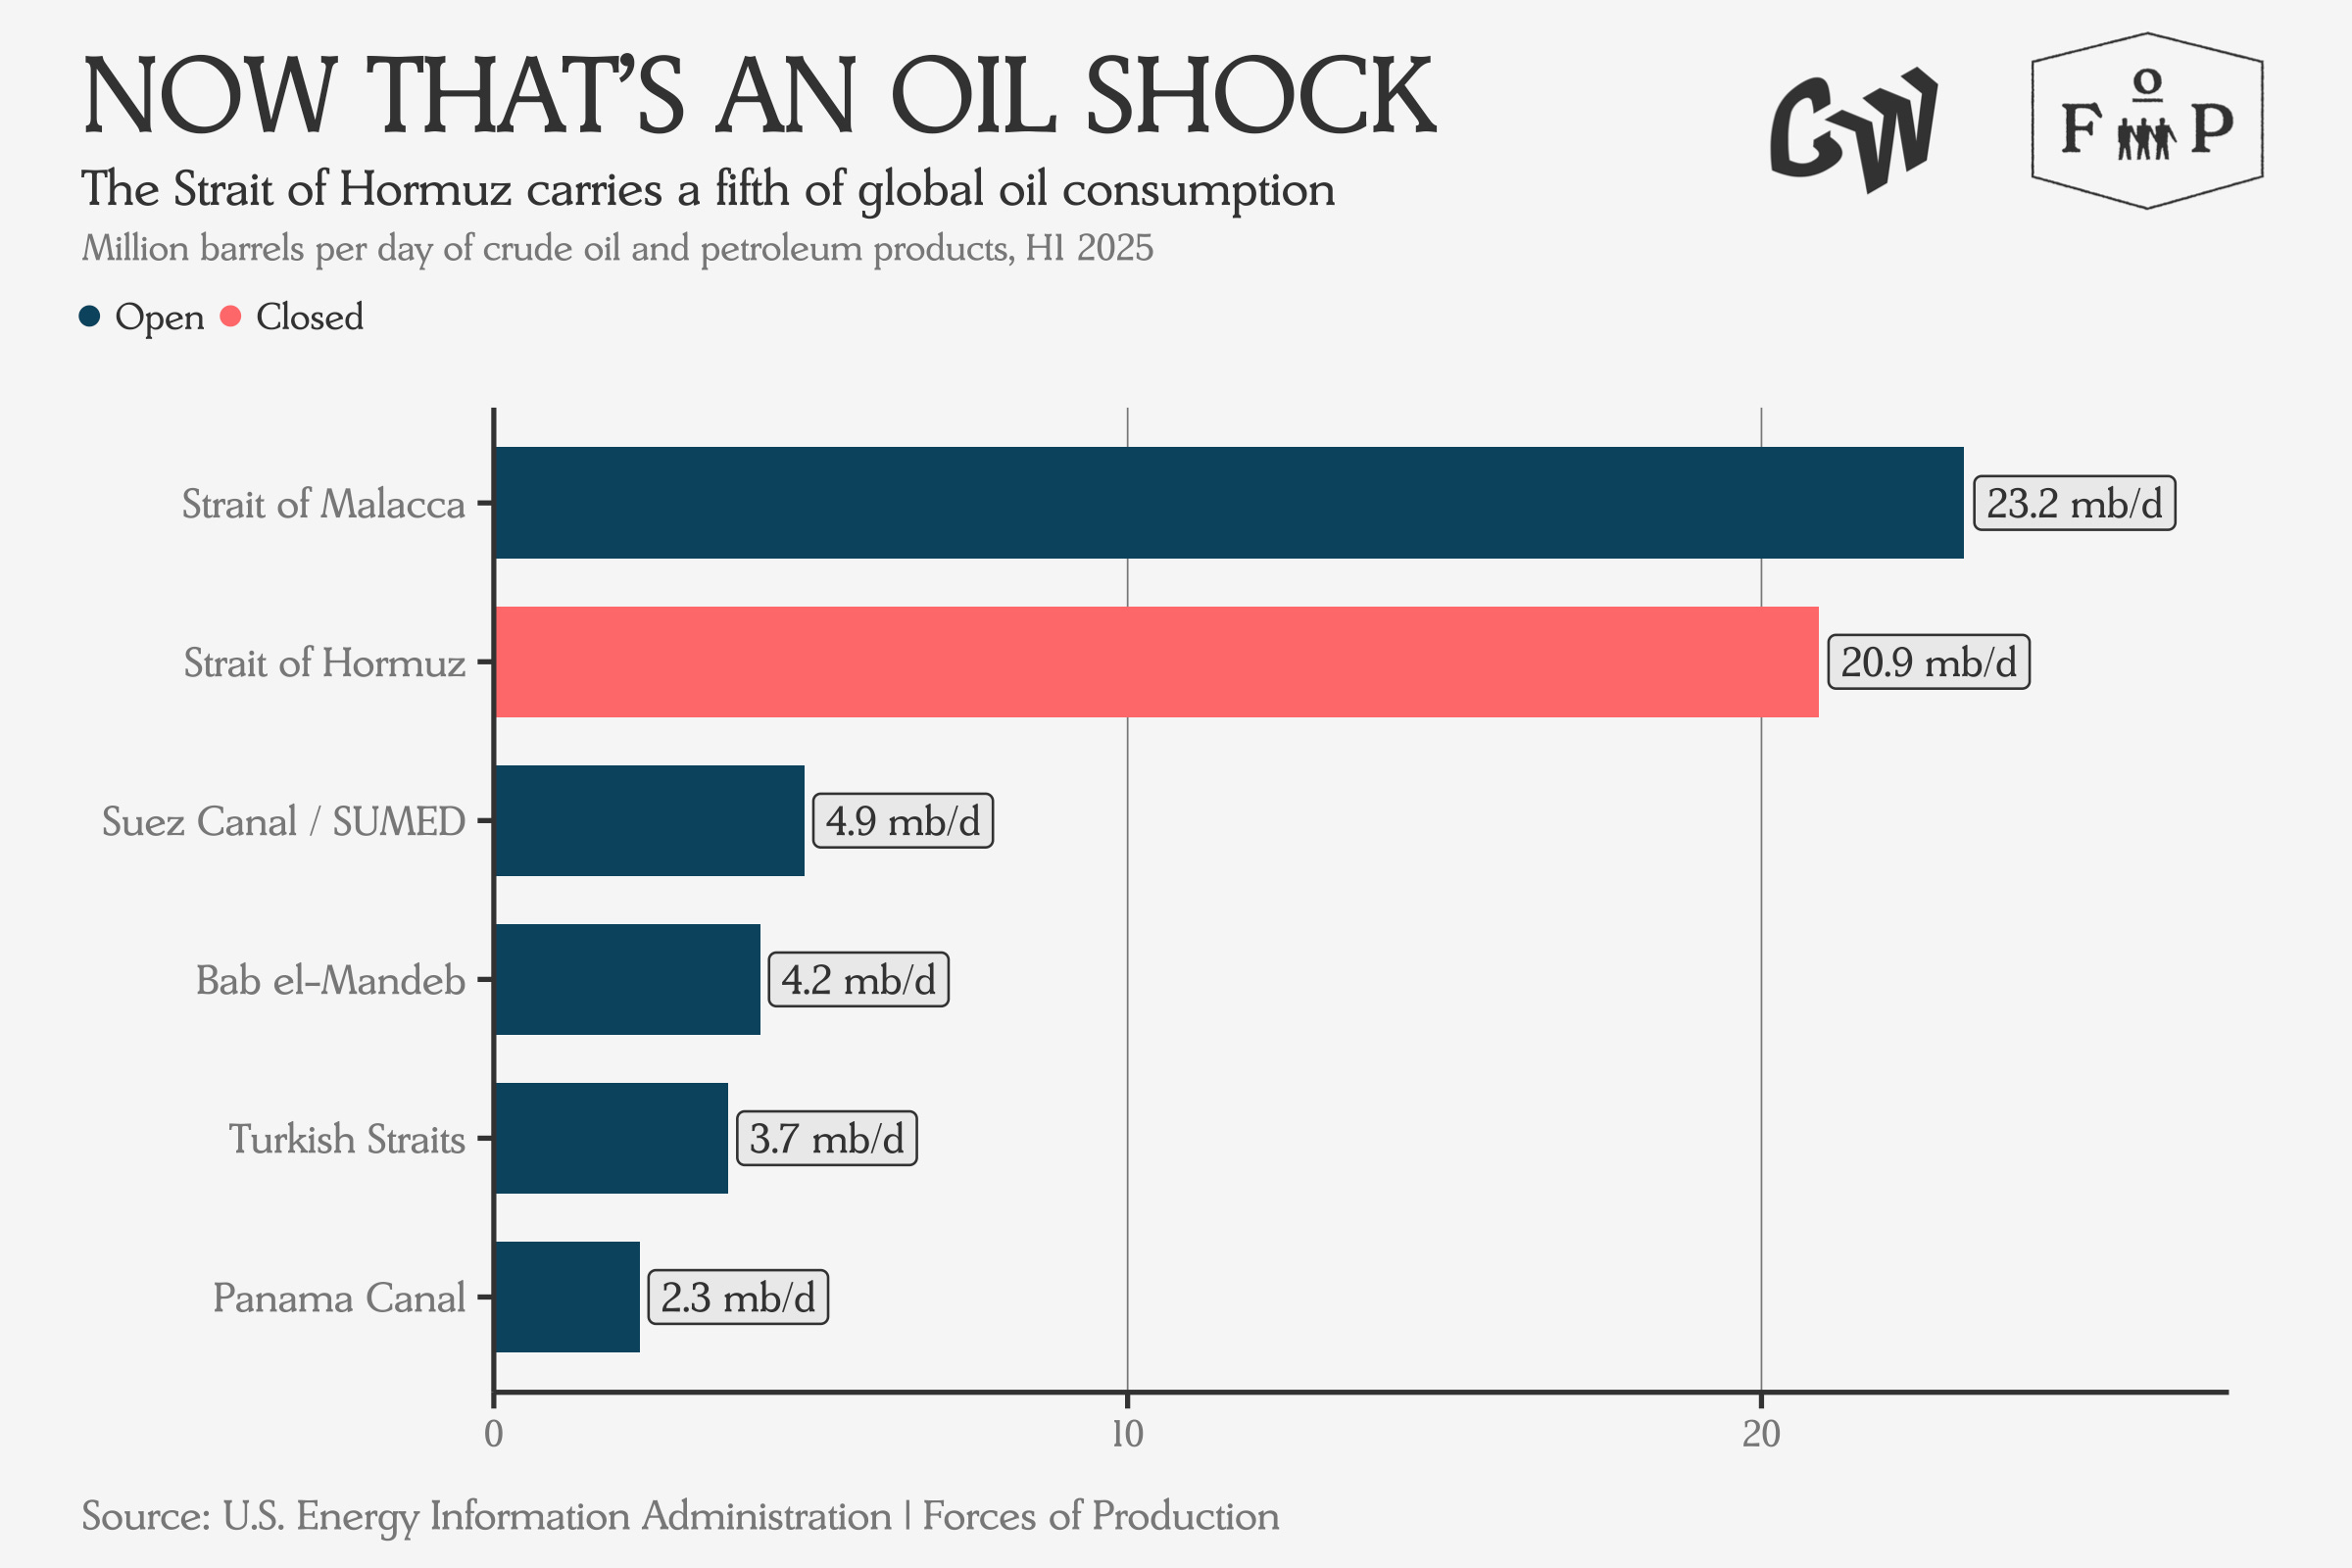
The oil shocks that defined the 1970s and produced widespread shortages removed, at their worst, about five million barrels per day from global supply. The Ukraine War shock that pulled inflation up through 2022 and 2023 removed about three million barrels per day. The Hormuz closure, if the strait remains closed, takes out roughly 20 million barrels per day — about a fifth of total global petroleum consumption, something like seven times the Ukraine disruption.
A Tool for Thinking about Inflation
In response to the 2022 inflation episode, economists and policymakers went looking for tools to better understand how specific narrow price shocks can produce broad-based inflation.
In particular, Isabella Weber, Jesús Lara Jauregui, Lucas Teixeira, and Luiza Nassif Pires published a paper using the same input-output tables we used to look at tariffs last month to show how these price shocks evolve. For a given industry, they simulate a price shock to see how it propagates through the network of who buys what from whom and show how much the resulting cost cascade would increase the price index if the shock were passed along completely at every step.
The method creates a distinction between two kinds of inflation. The first is direct inflation: the price of a thing consumers buy goes up — housing costs rise, and the housing component of the CPI rises with them. The second is indirect inflation: the price of an input rises, and the price of something consumers actually buy rises with it — aluminum gets more expensive, and the cost of a can of soda goes up a few cents.
“Systemically significant prices” are the set of prices which, when shocked, produce the largest combined increase in direct and indirect inflation.
But, if you think about it, indirect effects for the consumer are just a sequence of direct effects between different industries which all end as direct effects on the consumer. A shock to crude oil raises the price of refined petroleum products, which raises the cost of running a trucking fleet, which raises the cost of delivering groceries to the store, which raises the price you pay at the register.
We can trace the whole sequence through the input-output tables and track a single upstream shock all the way out to the consumer economy as a whole.
From Crude Oil to Everything Else
Since we are facing another oil shock, let’s see how its direct effects turn into its indirect effects.
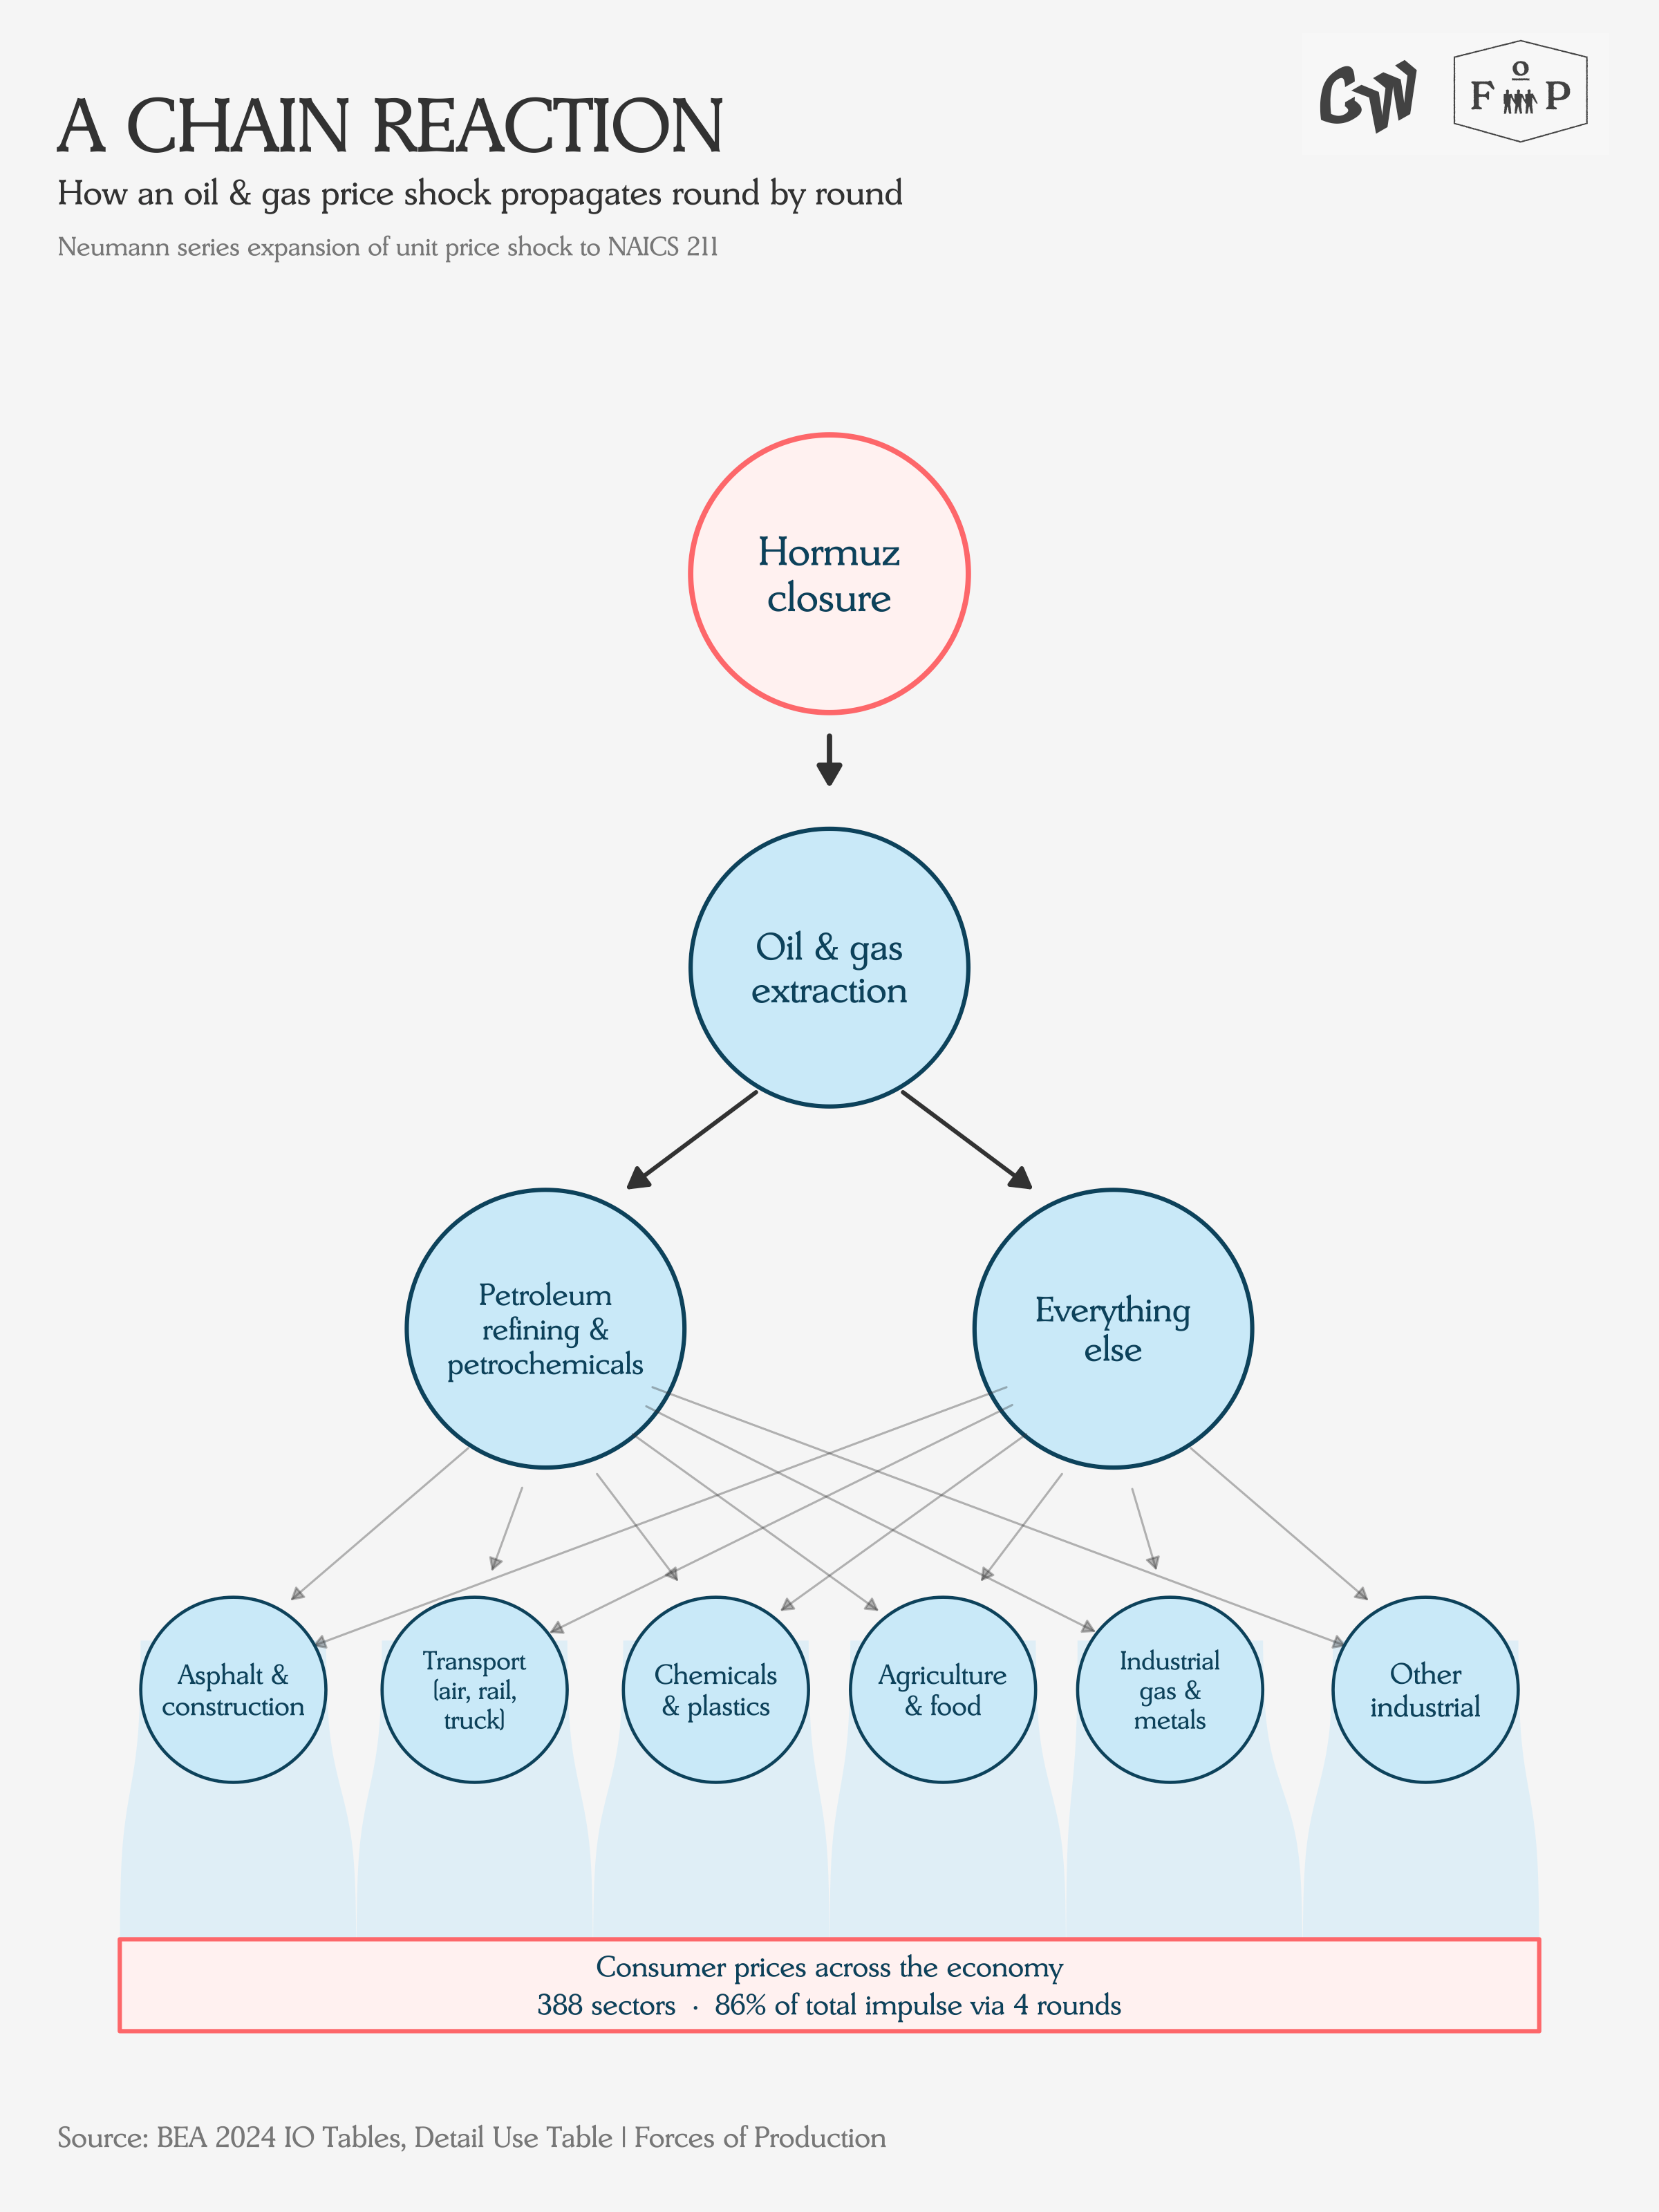
The first round of an oil shock is simple: the price shock is mostly paid by oil refineries. In the second round, that price shock fans out through refined products to different sectors in different roles. The final products of some sectors are basically made of the stuff — asphalt is not far from solidified oil — while other sectors rely on other refined products like fuel in transportation, or as feedstock for plastics, pharmaceuticals and fertilizers.
The third and fourth rounds move from those sectors to the rest of the economy. By the fourth round of tracing impacts, around 85 percent of the total indirect impact from the price shock has been passed on to consumer prices, through over hundreds of different industries. The remaining 15% of the indirect impact is spread across an indefinite echoing tail of longer paths.
However, it is important to remember that the price model used in this model computes these price shocks as if they propagate through all rounds instantaneously. In reality, firms across the affected industries have to decide to raise their prices sequentially, over time, to actually pass these price increases through to consumers. In the case of “Seller’s Inflation”, firms might even use the upstream price shock to raise their prices by more than their input costs increased.
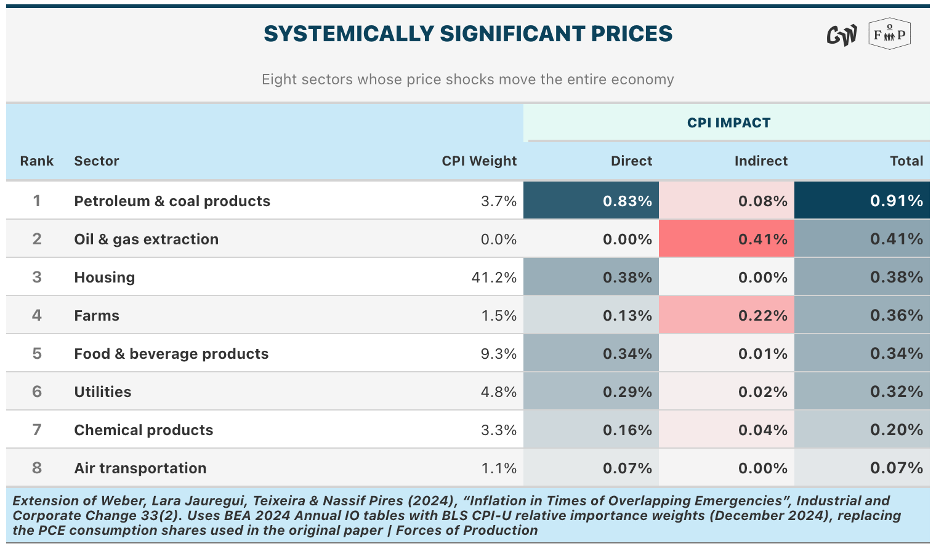
So now that we understand how both direct and indirect inflation work, which prices are actually systemically significant according to this model?
Back-of-the-Envelope
So, what does all of this mean for inflation? The table above gives us some tools to investigate.
Let’s start with oil extraction by itself. In Weber’s model, oil and gas extraction has almost zero direct CPI weight — consumers do not buy crude oil — so its entire impact on inflation is indirect. Every cent of its CPI effect has to propagate through the production network before it reaches consumer prices. In the table below, we have extended Weber’s model to speak in terms of CPI rather than PCE inflation, and to break out the direct and indirect contributions separately.
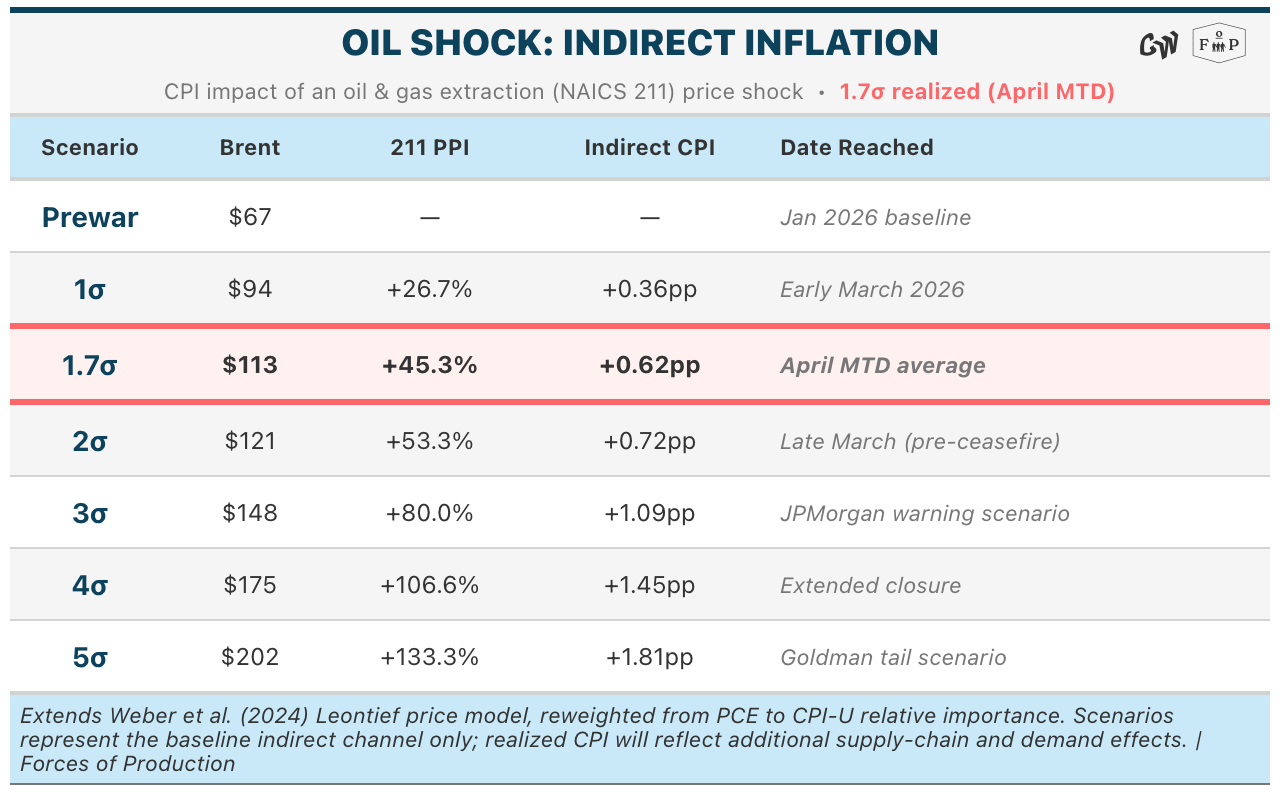
Brent crude is currently running at about 1.7 standard deviations above its pre-war baseline, which implies a minimum of 0.62 percentage points of indirect CPI inflation working its way through supply-side channels. Because these are all indirect effects — cost increases that have to pass through refineries, then through chemicals and transport, then through the industries that buy from them — they will not arrive in the measurement system all at once. This tells us the oil shock will be with us for a while, accumulating as it propagates.
But crude prices are only half the picture. We are also seeing strikes on refinery infrastructure in Iran and across the Gulf, and the resulting supply crunch in refined products has pushed downstream prices harder than upstream ones. Gasoline, diesel, and jet fuel have all moved more aggressively than the crude oil they are made from, as rationing dynamics take hold in the refining sector. To understand the full inflation picture, we need to look at the entire oil and refining complex.
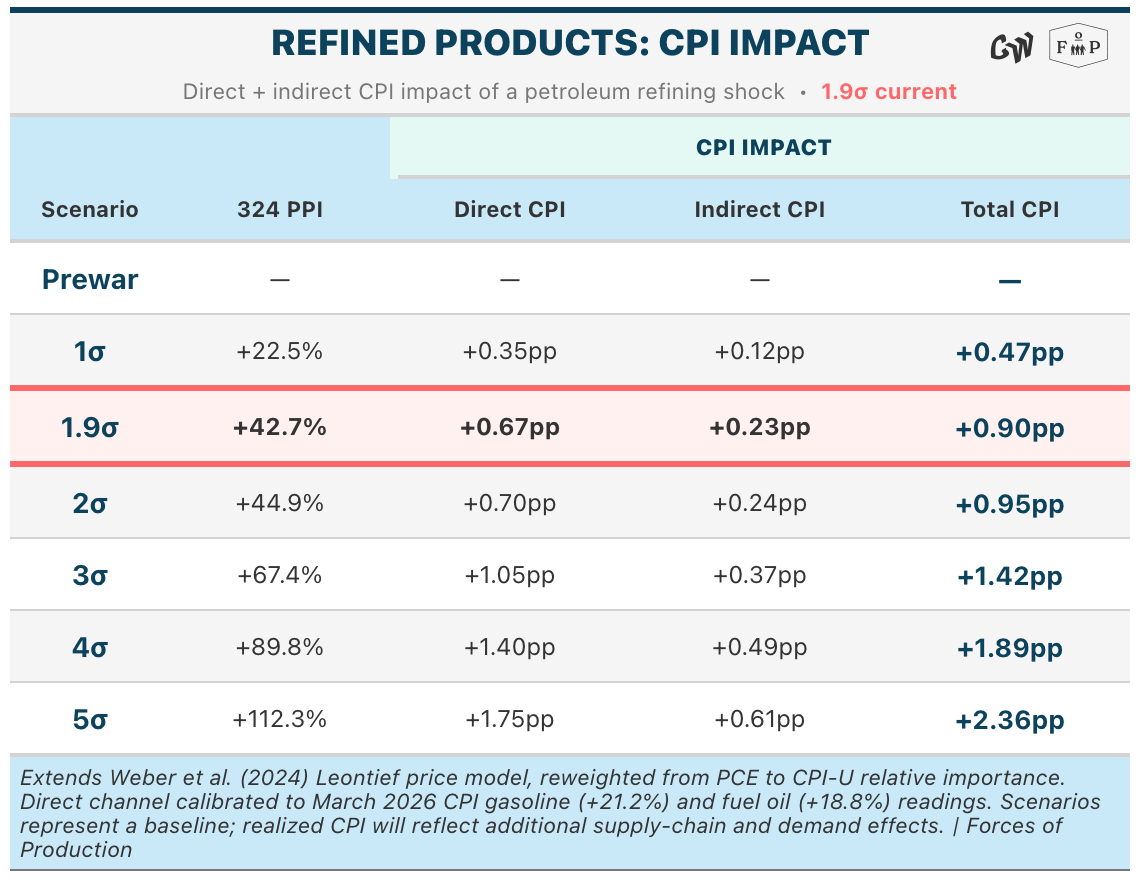
The shock to refined products has so far been larger than the shock to crude — petroleum and coal products PPI is currently running at about 1.9 standard deviations, compared to 1.7 for extraction. And unlike extraction, refining has a substantial direct channel to CPI: consumers buy gasoline, heating oil, and propane directly. At 1.9 sigmas, the model shows 0.67 percentage points of direct CPI impact plus another 0.23 percentage points of indirect impact, for a total of 0.90 percentage points from the refining shock alone.
We can already see this playing out in the March CPI data released last Friday. Gasoline prices rose 21.2 percent in a single month — the largest monthly increase since the series began in 1967. Fuel oil was up 30.7 percent. The energy index as a whole jumped 10.9 percent, its biggest move since September 2005. That is the direct channel from the refinery shocks arriving. But core CPI — everything except food and energy — came in at just 0.2 percent, right on its recent trend. The indirect effects, the ones that have to work through petrochemicals and transport and packaging before they reach the register, have not shown up yet. They will.
Now, we would expect the direct component to show up relatively quickly as companies pass through higher input costs. But the CPI and PPI measurement windows do not perfectly align, which means the unmeasured present is always running a step ahead of the measured past. Even after that record gasoline print, there is still significant direct and indirect inflation in the pipeline from closure that has already happened.
The longer the strait stays closed, the worse these numbers will get.
Conclusion
The price of oil is systemically significant because it propagates.
The tables above quantify the direct hit, but the cascade we traced from crude to everything takes time to work through contracts, inventories, and pricing cycles. March CPI showed the fastest month-over-month increase in gasoline prices in the index’s history, and that is only the first round — the direct effect. The indirect effects, the ones that move through petrochemicals into plastics, through diesel into trucking, through trucking into groceries, will take months to fully pass through.
We should already be preparing for the inflationary consequences of the strait closure to last through the midterm elections at minimum. At the same time, negotiations seem unlikely to resolve the underlying problem given the counterparty reliability issues involved.
Economic policy has become increasingly entangled with foreign policy, and the Trump administration had been benefiting from a quiet tailwind: falling energy prices were canceling out some of the aggregate price impact of its tariff regime. That tailwind will now become a headwind.
It is also worth noting that there is an obvious temptation to use the Strategic Petroleum Reserve to paper over the economic consequences of a foreign policy disaster here. The problem is, unlike the disruption during the Ukraine war, the SPR is not up to this task. It can release 4.4 million barrels per day running flat out — roughly a quarter of the twenty million lost through closure of the strait — but even at Hormuz flow rates, the entire reserve holds less than three weeks of replacement supply. The SPR is a price buffer, not a substitute for global markets. Fixing inflation requires a solution to the geopolitical problem; the SPR cannot do it alone.
This Month’s Data
Employment
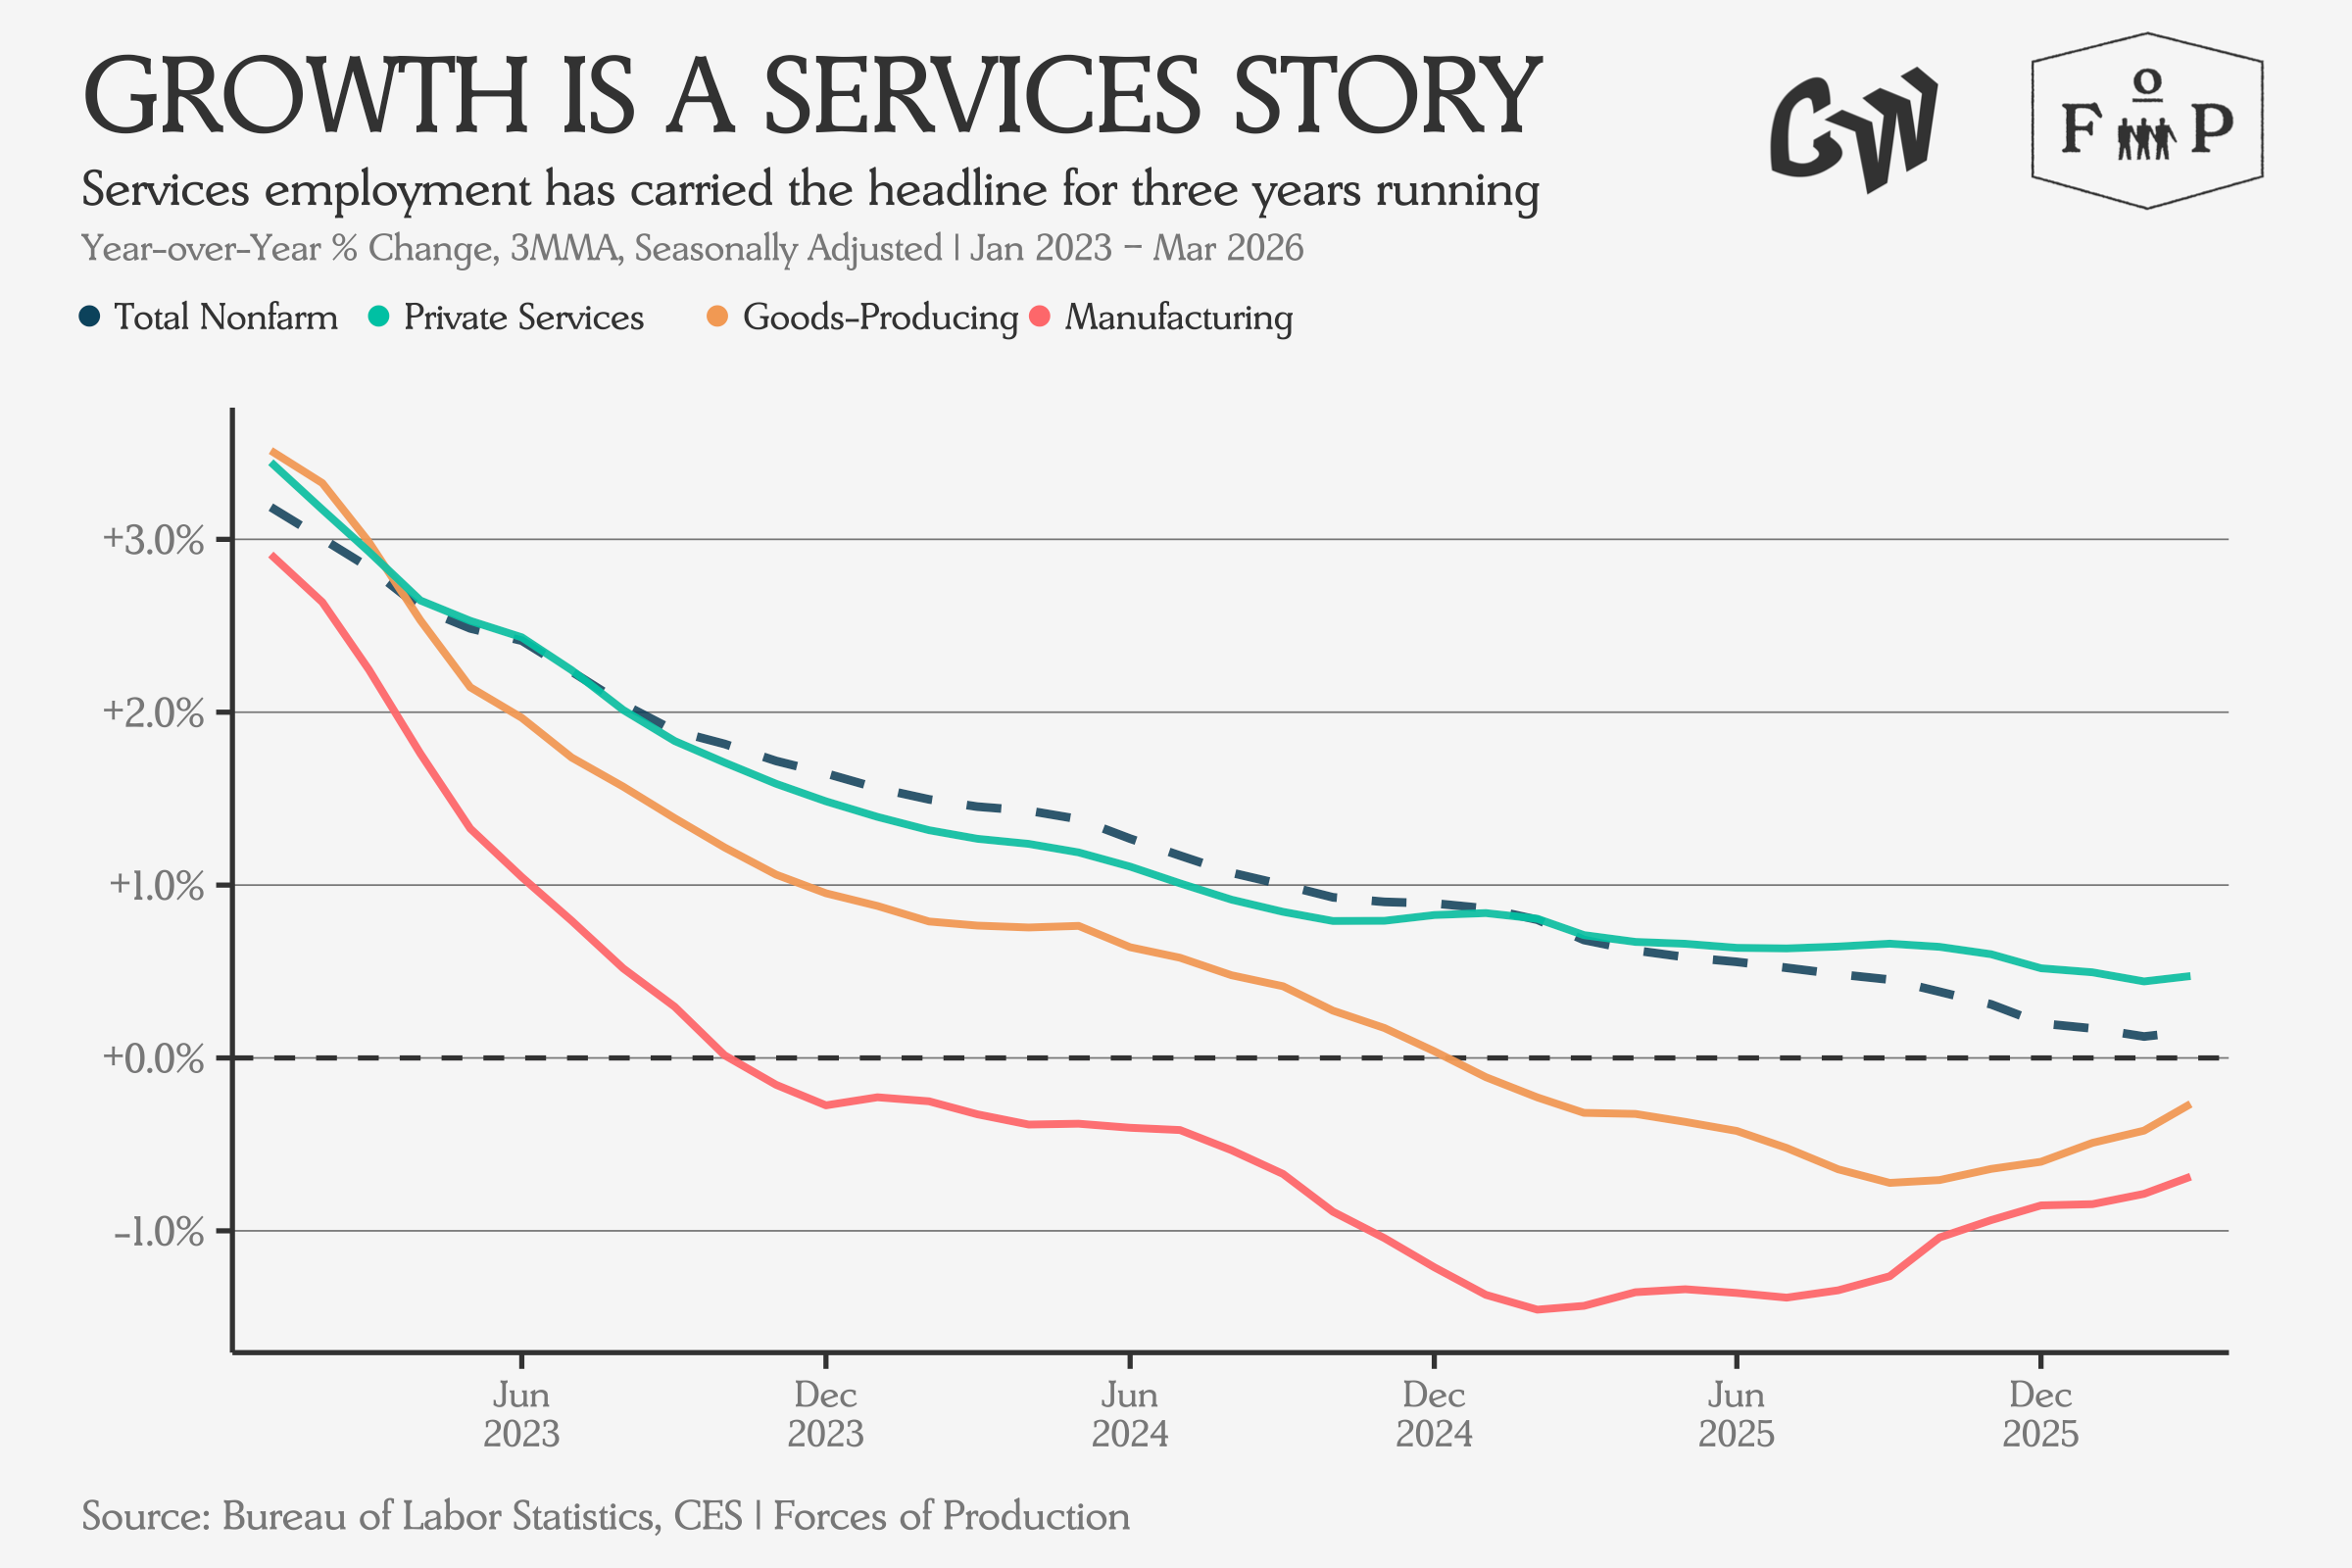
Total employment growth continues to decelerate towards zero in the March employment data.
Usually employment growth sliding towards zero would be a warning sign for the labor market, but according to a FEDS Note published last week, there are deeper problems. The Trump administration’s approach to immigration policy has slowed population growth so sharply that 2026 is on track for the weakest year since 1951. This is, fundamentally, a negative labor supply shock.
What this means, somewhat grimly, is that the breakeven pace of monthly job creation — the number needed to keep the unemployment rate from rising as the labor force grows — could fall to “nearly zero, requiring less than 10,000 new jobs per month in 2026”, down from about 85,000 in 2025. If breakeven is essentially zero, we could see the unemployment rate hold steady even with the aggregate jobs number flat or modestly negative. Another “year with no jobs, but no recession”, as Claudia Sahm has termed it.
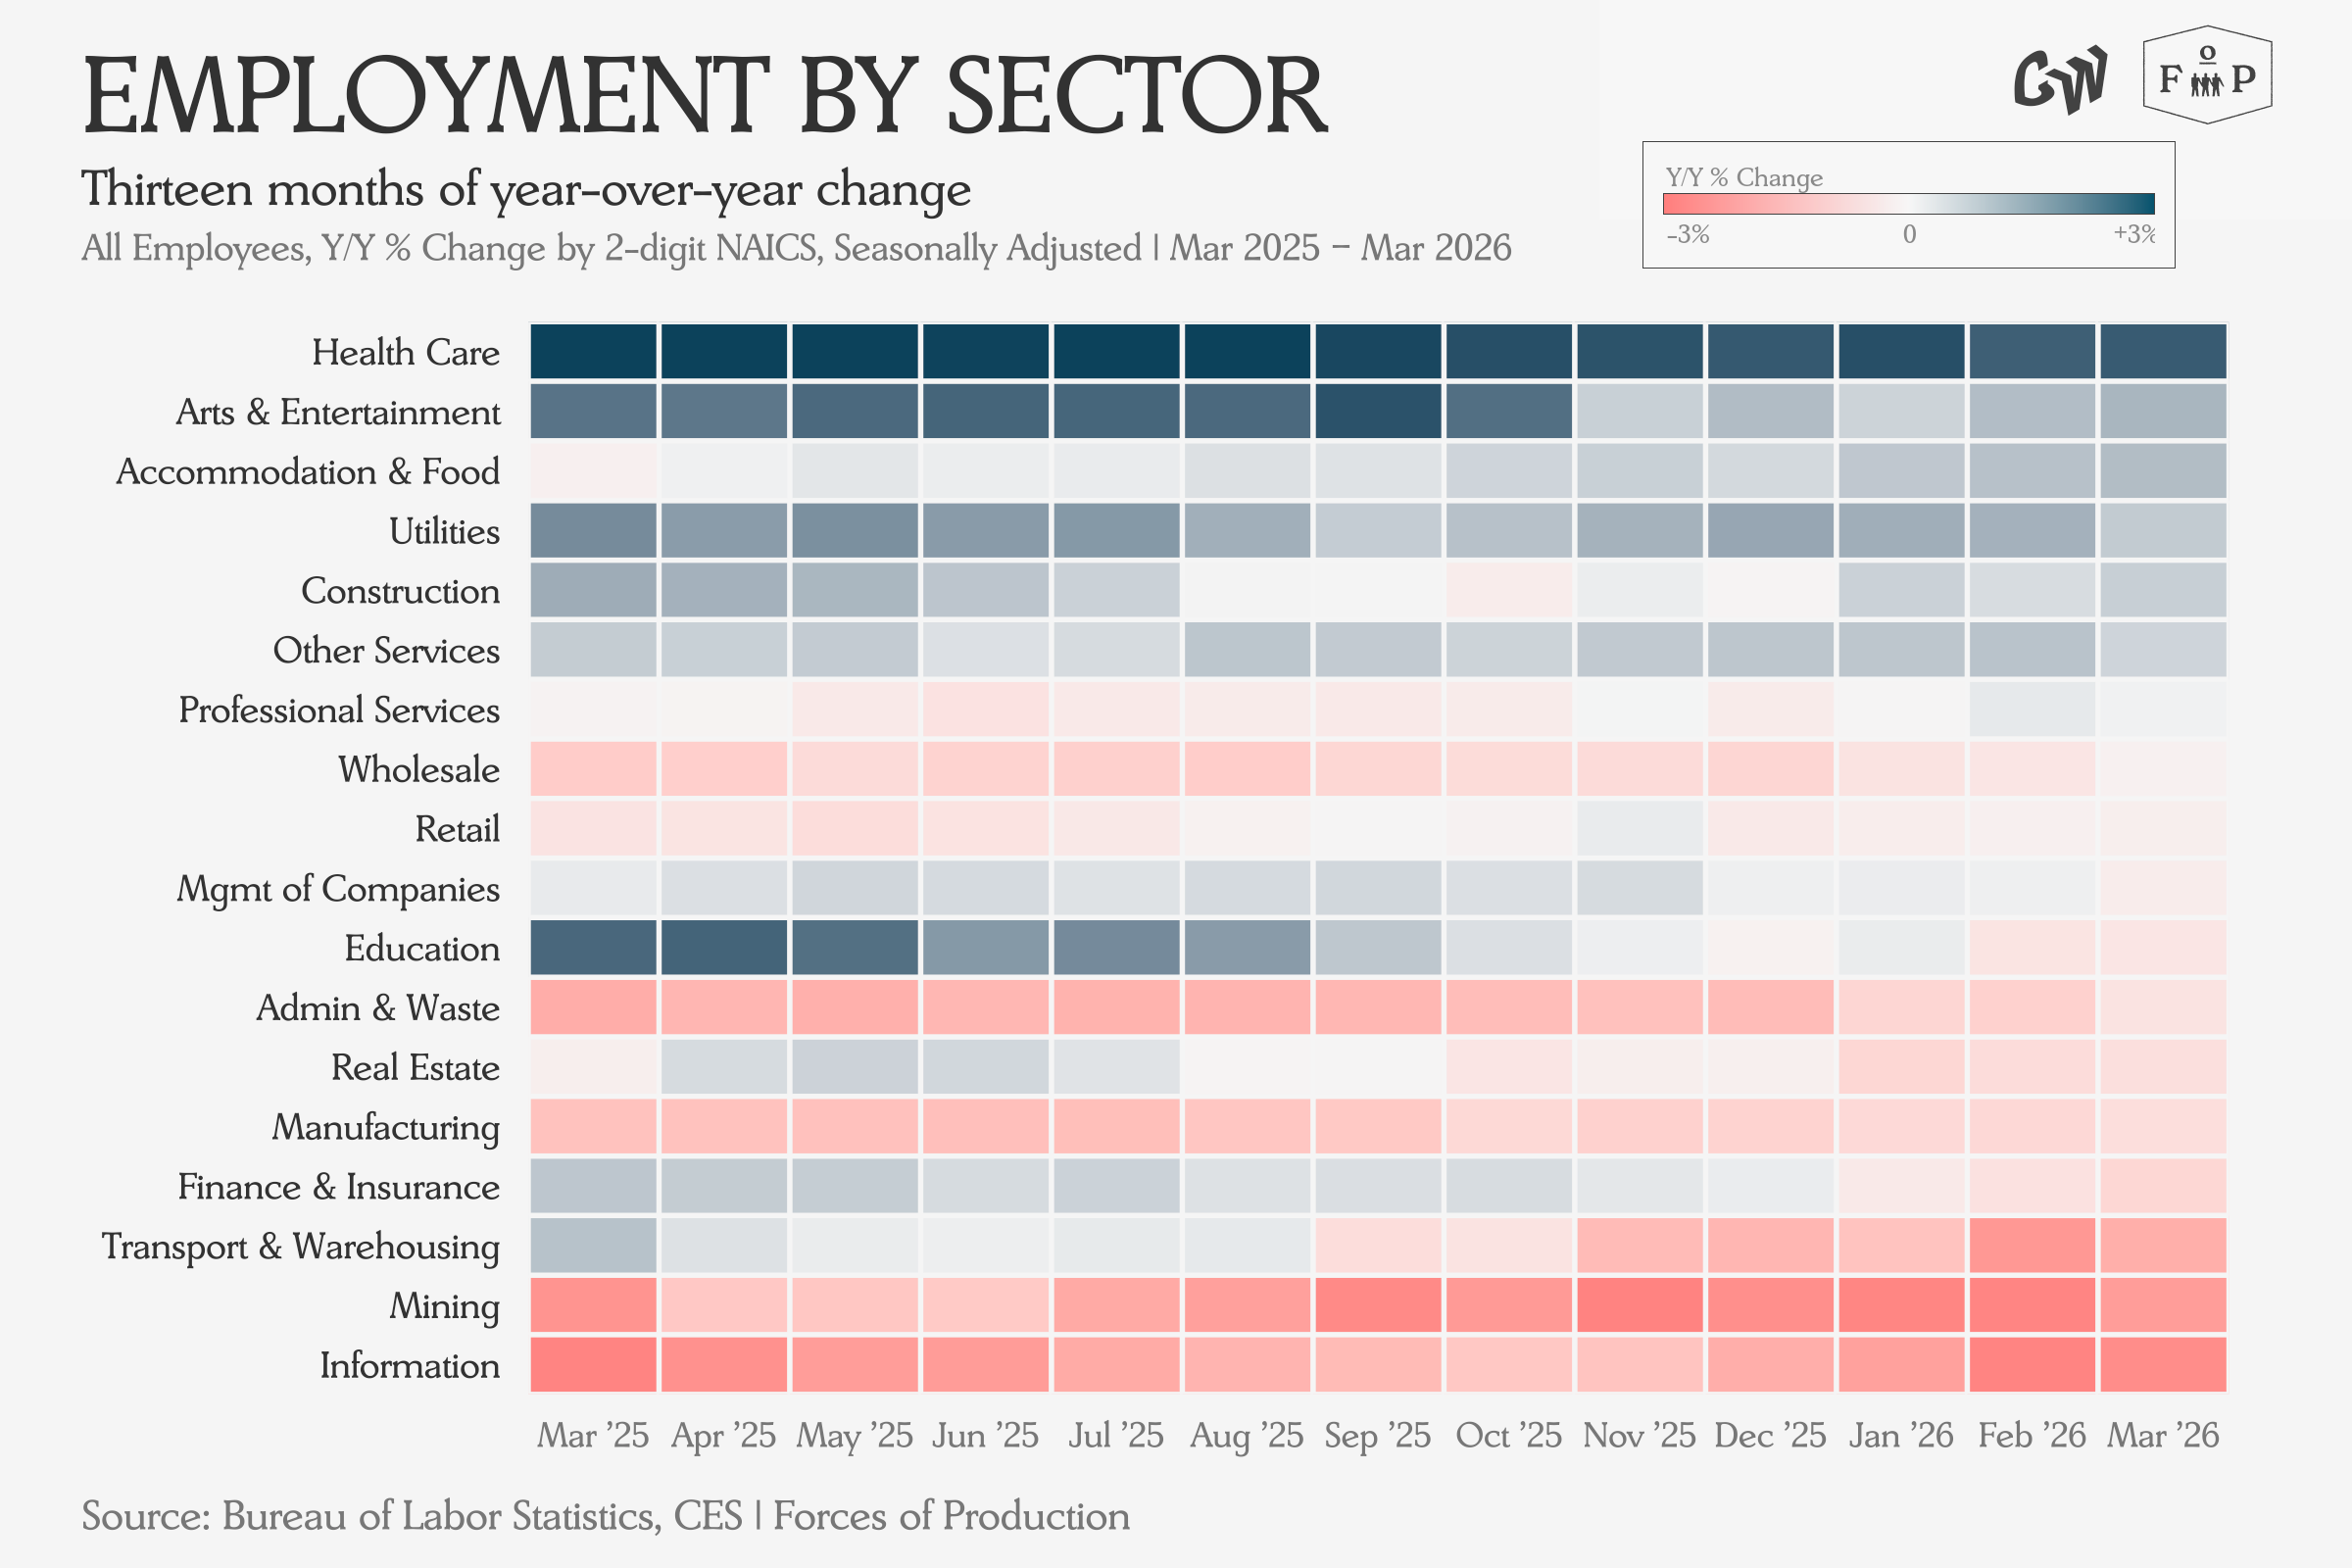
We can see the same picture in the sectoral breakout as in the headline: goods-producing industries are shedding workers, tech remains in correction as pandemic-era surge hiring continues to unwind, and health care sector employment is growing four times as fast as total employment.
Industrial Production and Capacity
Industrial production is up 1.6 percent over 2025 levels and 2.6 percent over 2017 levels. Manufacturing has fallen below its 2017 level. Capacity utilization is 76.3 percent, within a tenth of a percentage point of its 2017 average.
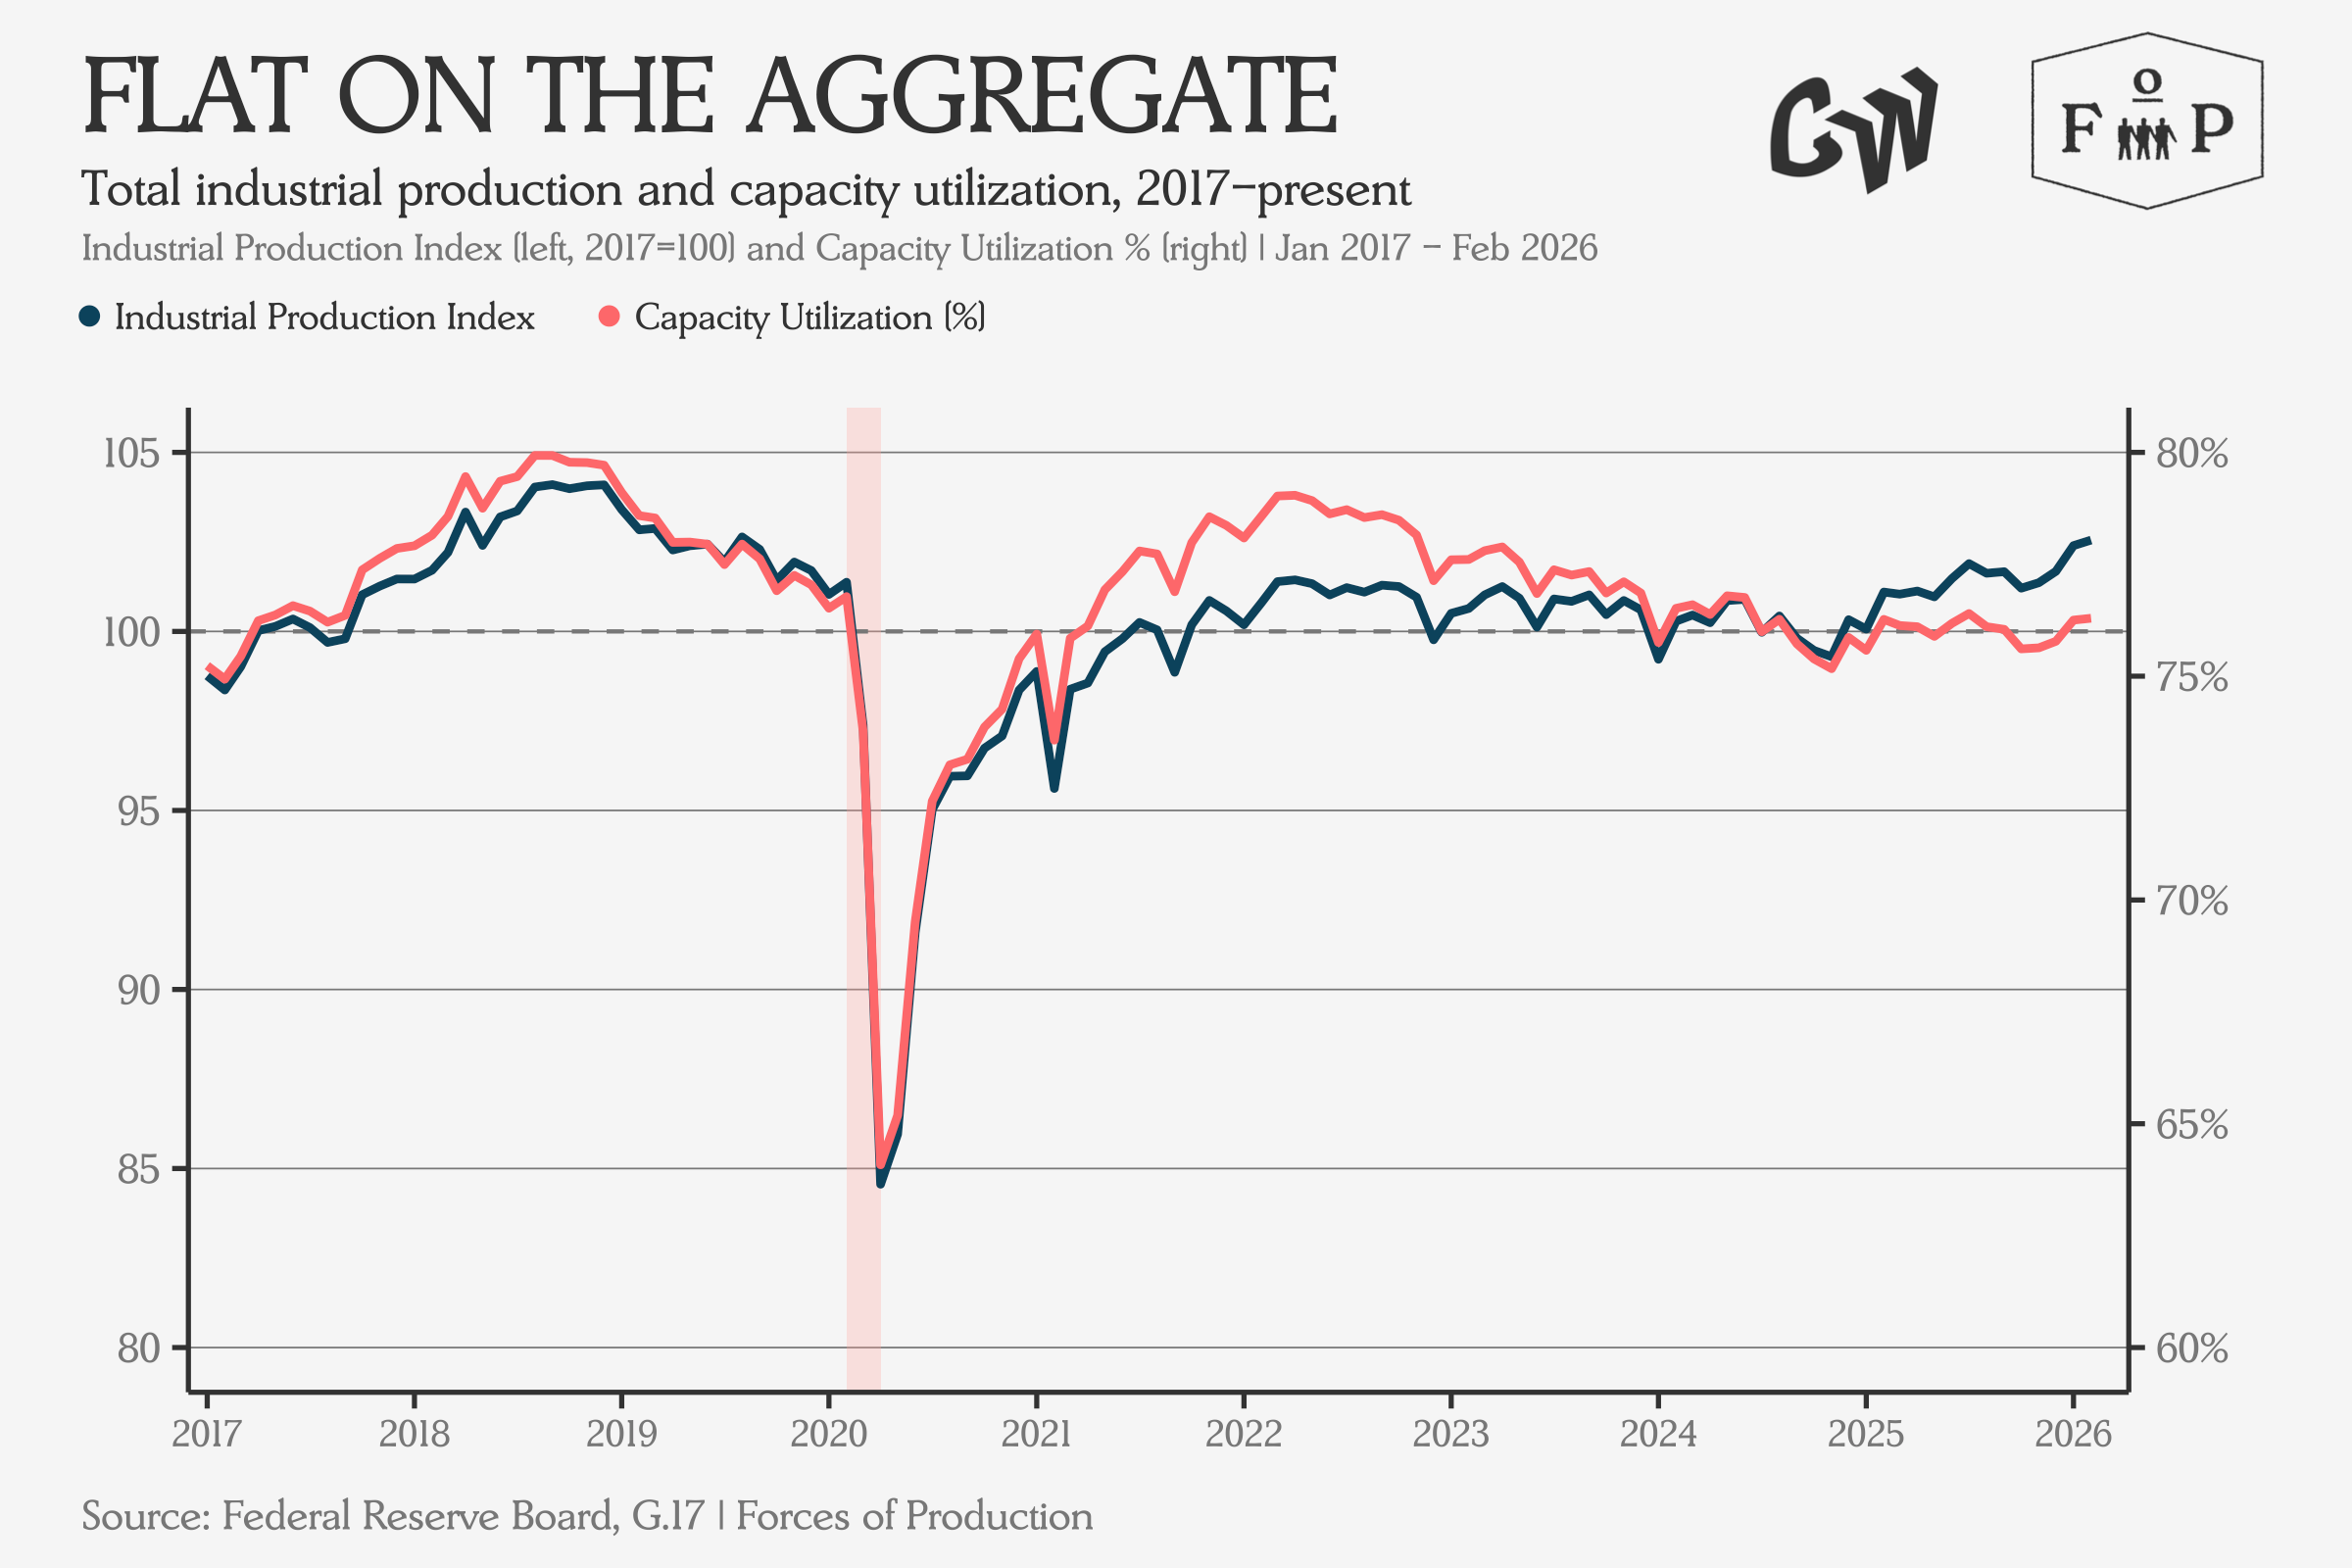
I keep harping on these 2017 numbers because Oren Cass has a new piece in the FT citing rising industrial production as evidence that the Trump tariff regime is working.
But if we look at which sectors are actually driving the acceleration, the data doesn’t quite match the story.
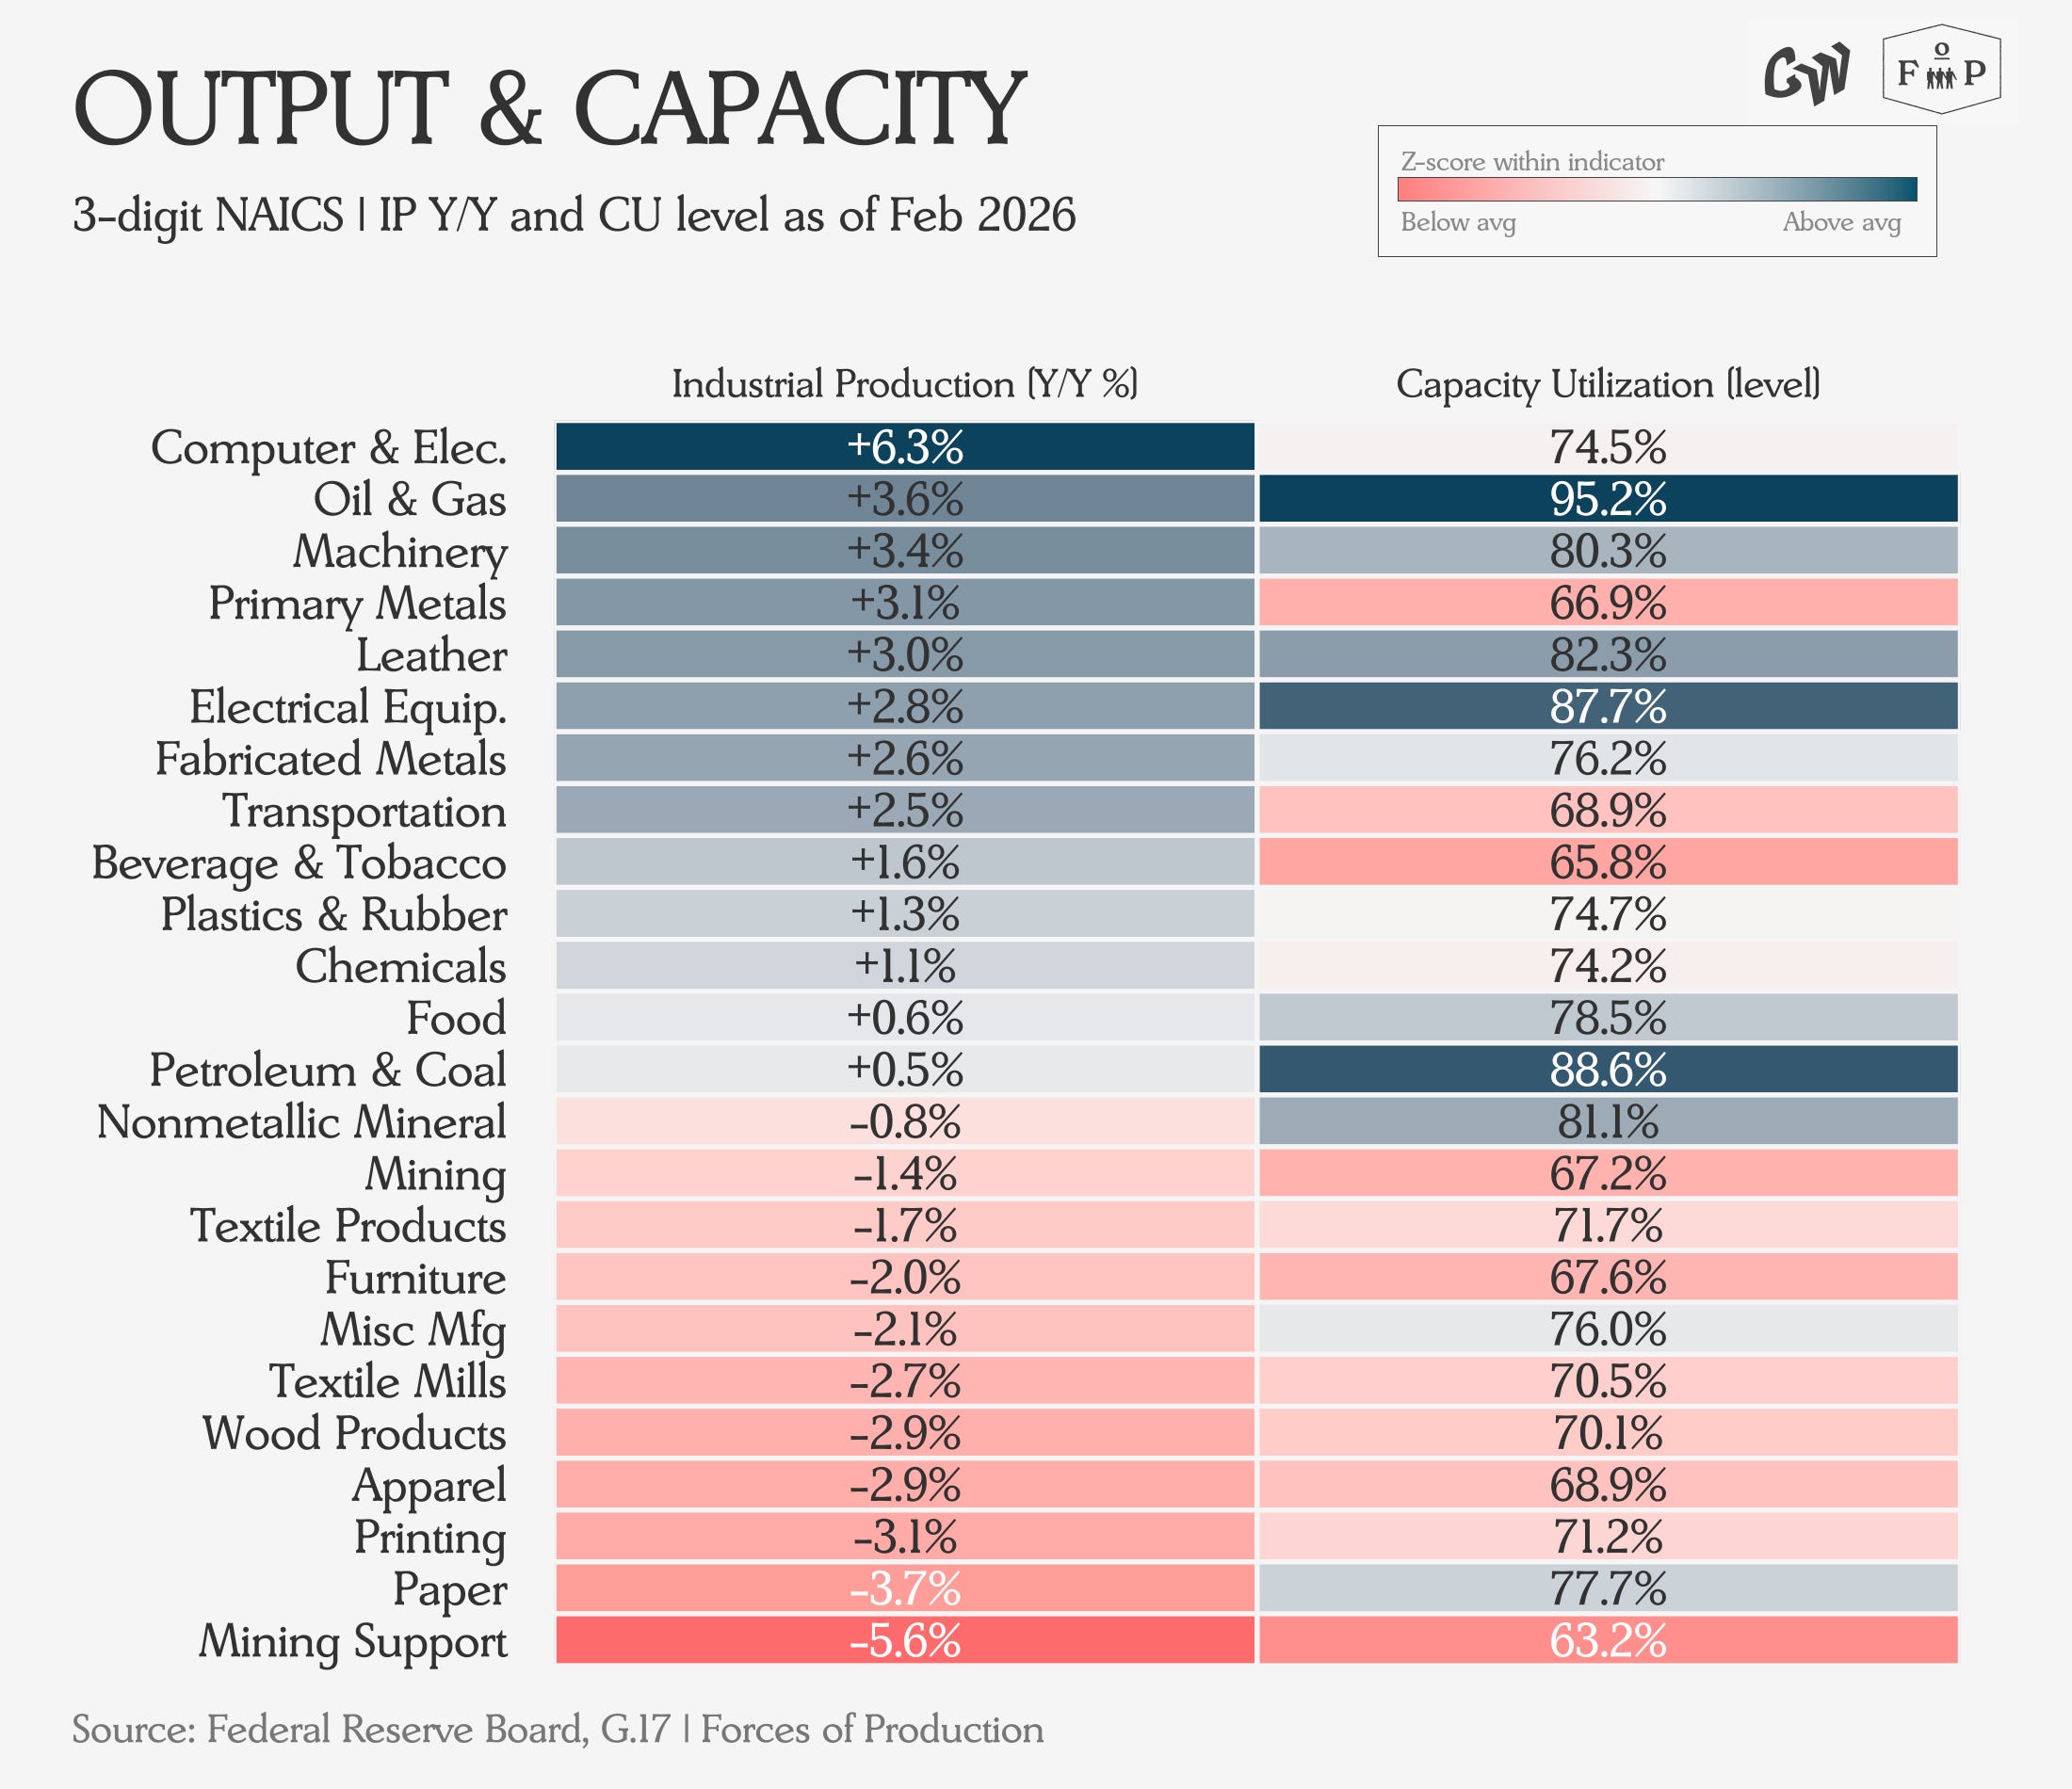
The only sector in the top five of this table with any connection to tariffs is primary metals. Oil and gas extraction has no tariff story, and rising computer and electronic products production is a CHIPS Act and onshoring story whose trajectory was set before Trump returned to office.
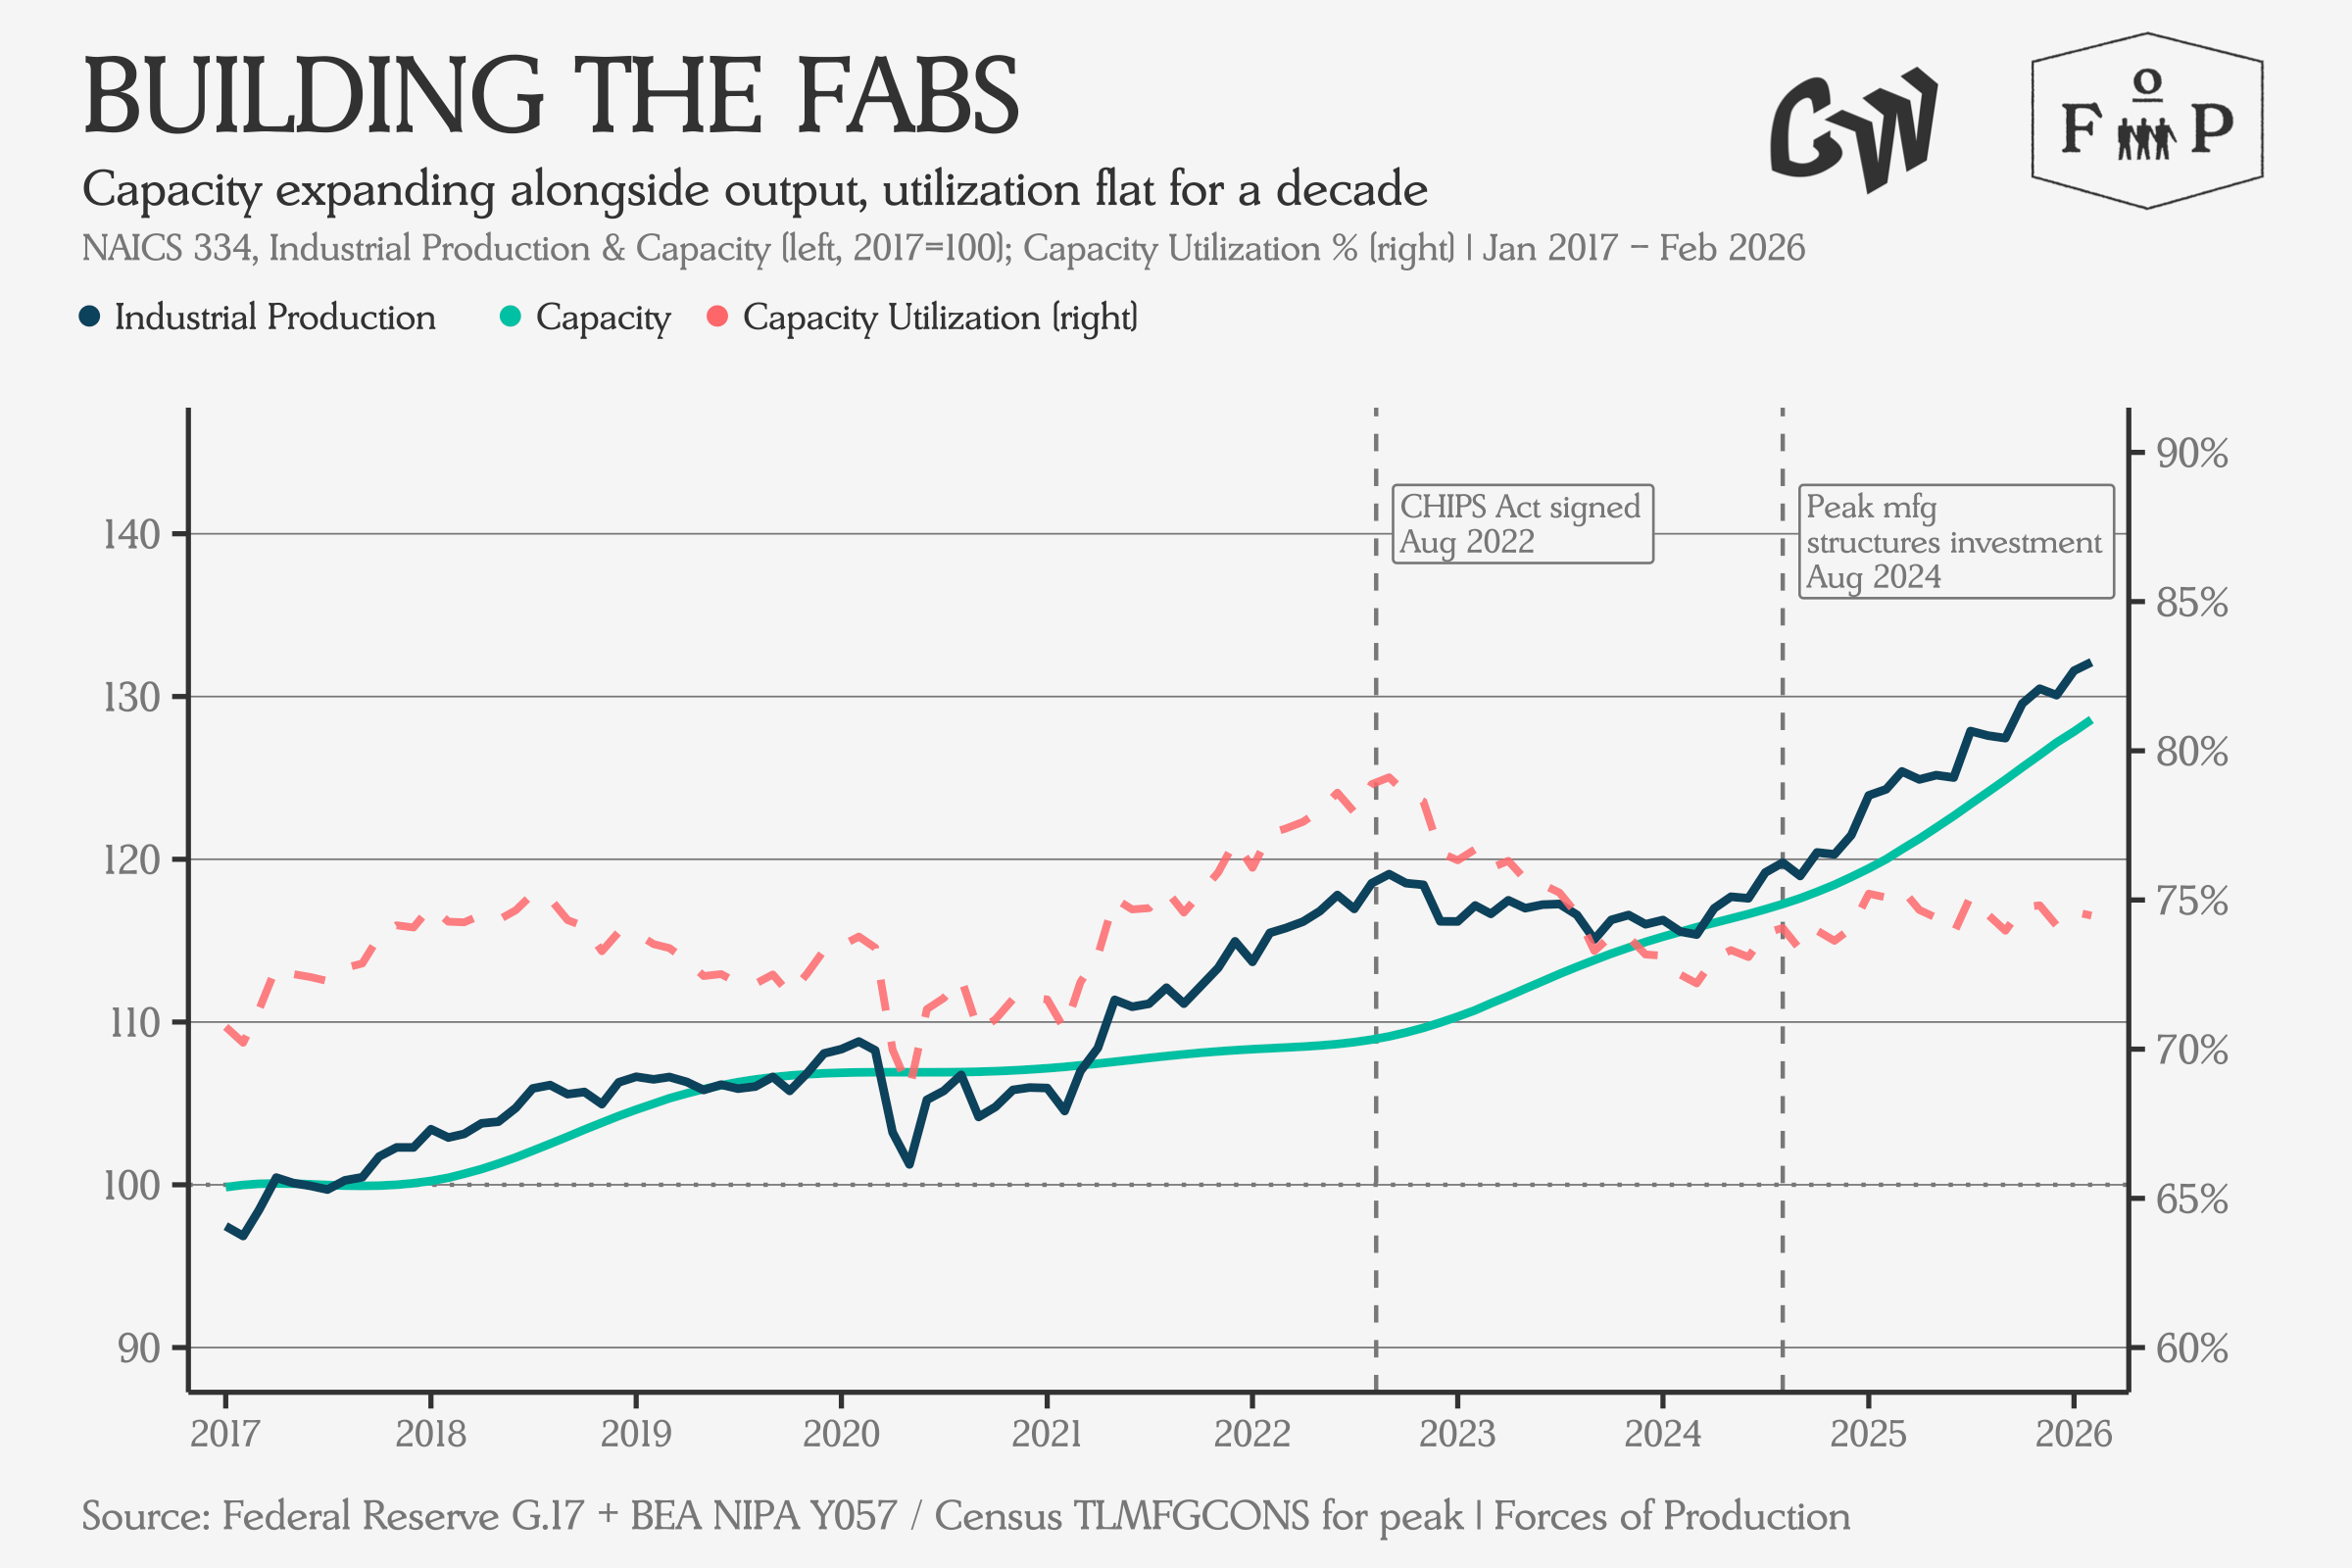
The semiconductor timeline makes this disconnect concrete. The CHIPS Act was signed at a local peak in capacity utilization, and measured capacity begins inflecting upwards as federal dollars translated into investment in the sector. Two years later, inflation-adjusted investment in manufacturing-related structures hit its own peak — right when output began inflecting upwards while utilization rates held steady. That is the shape of the CHIPS Act working its way through the data. The tariffs had nothing to do with it.
Prices
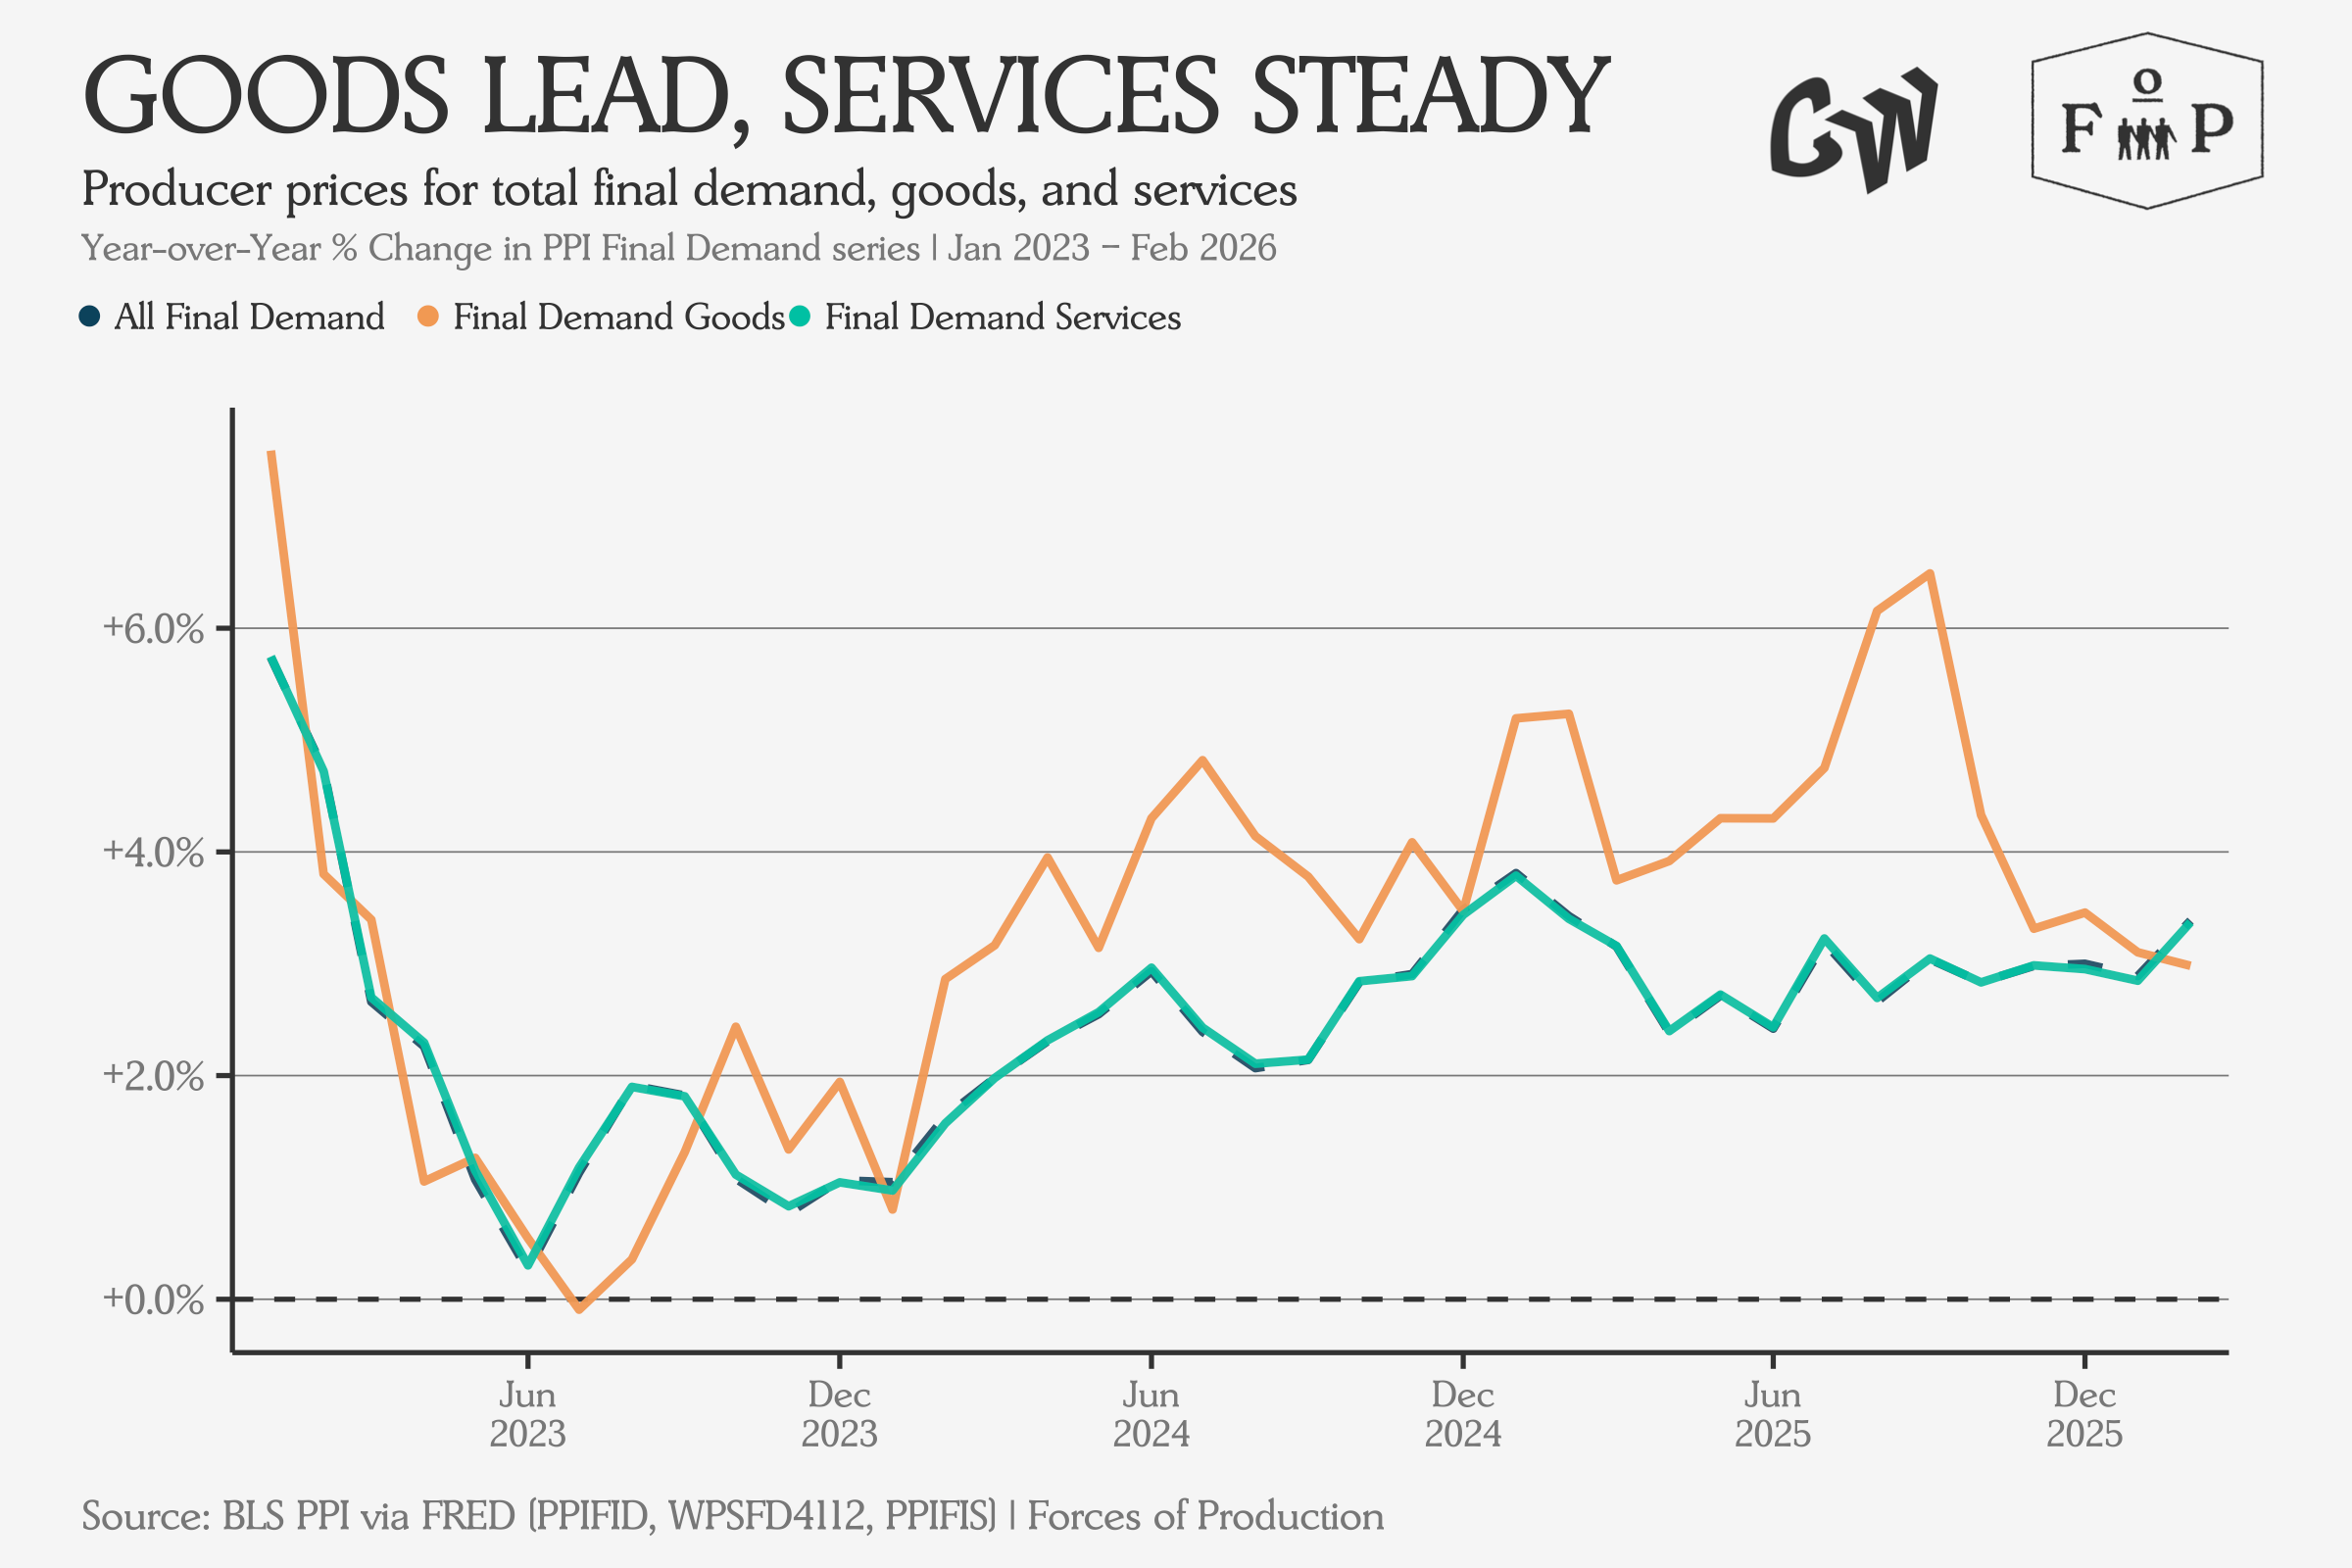
Producer prices on final demand have been running steady around three percent year-over-year for several months.
Breaking out producer prices for goods-producing sectors, we see prices rising over ten percent annually for primary metals, mining ex oil and gas, utilities, and computer and electronic products. We also see acceleration over the last six months of readings, rather than deceleration, suggesting these price rises will continue.
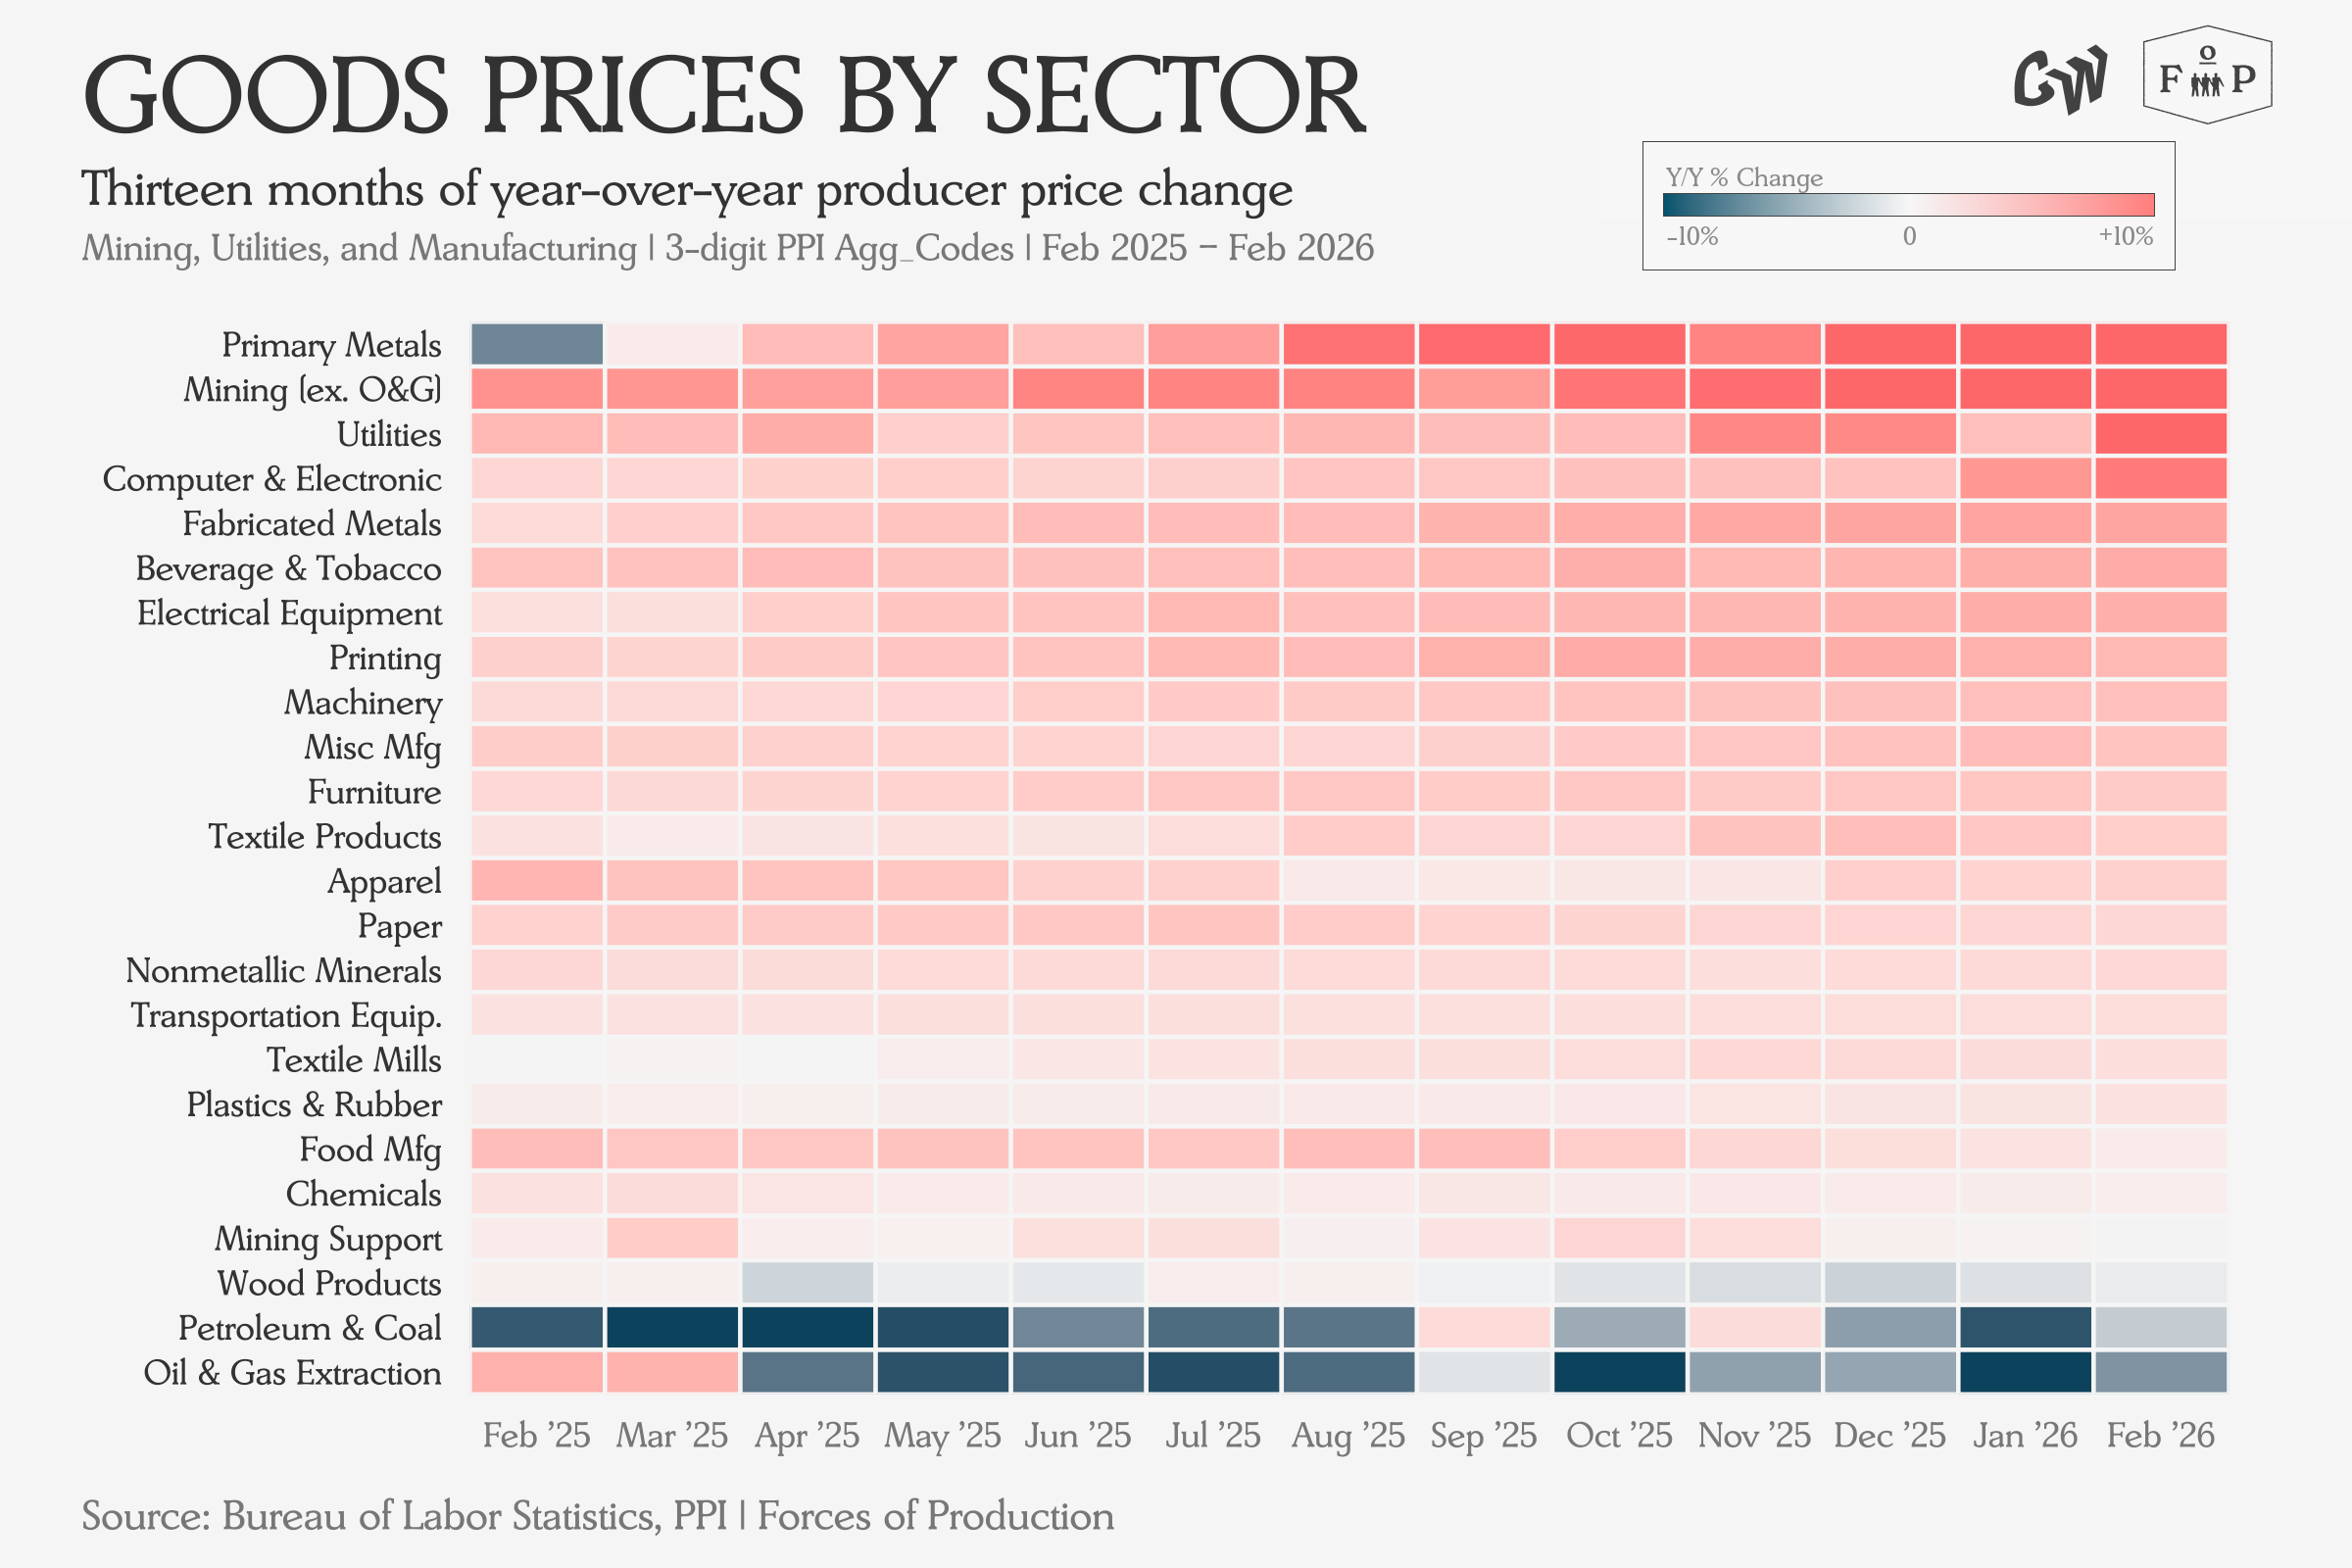
As it stands, the only goods-producing sectors holding the headline down — petroleum and coal products and oil and gas extraction — will soon be some of the biggest sources of inflationary pressure. When that happens, the offset that has been keeping headline goods PPI near three percent disappears, and the rest of the matrix is already running well above that pace. The headline will have to move with them.
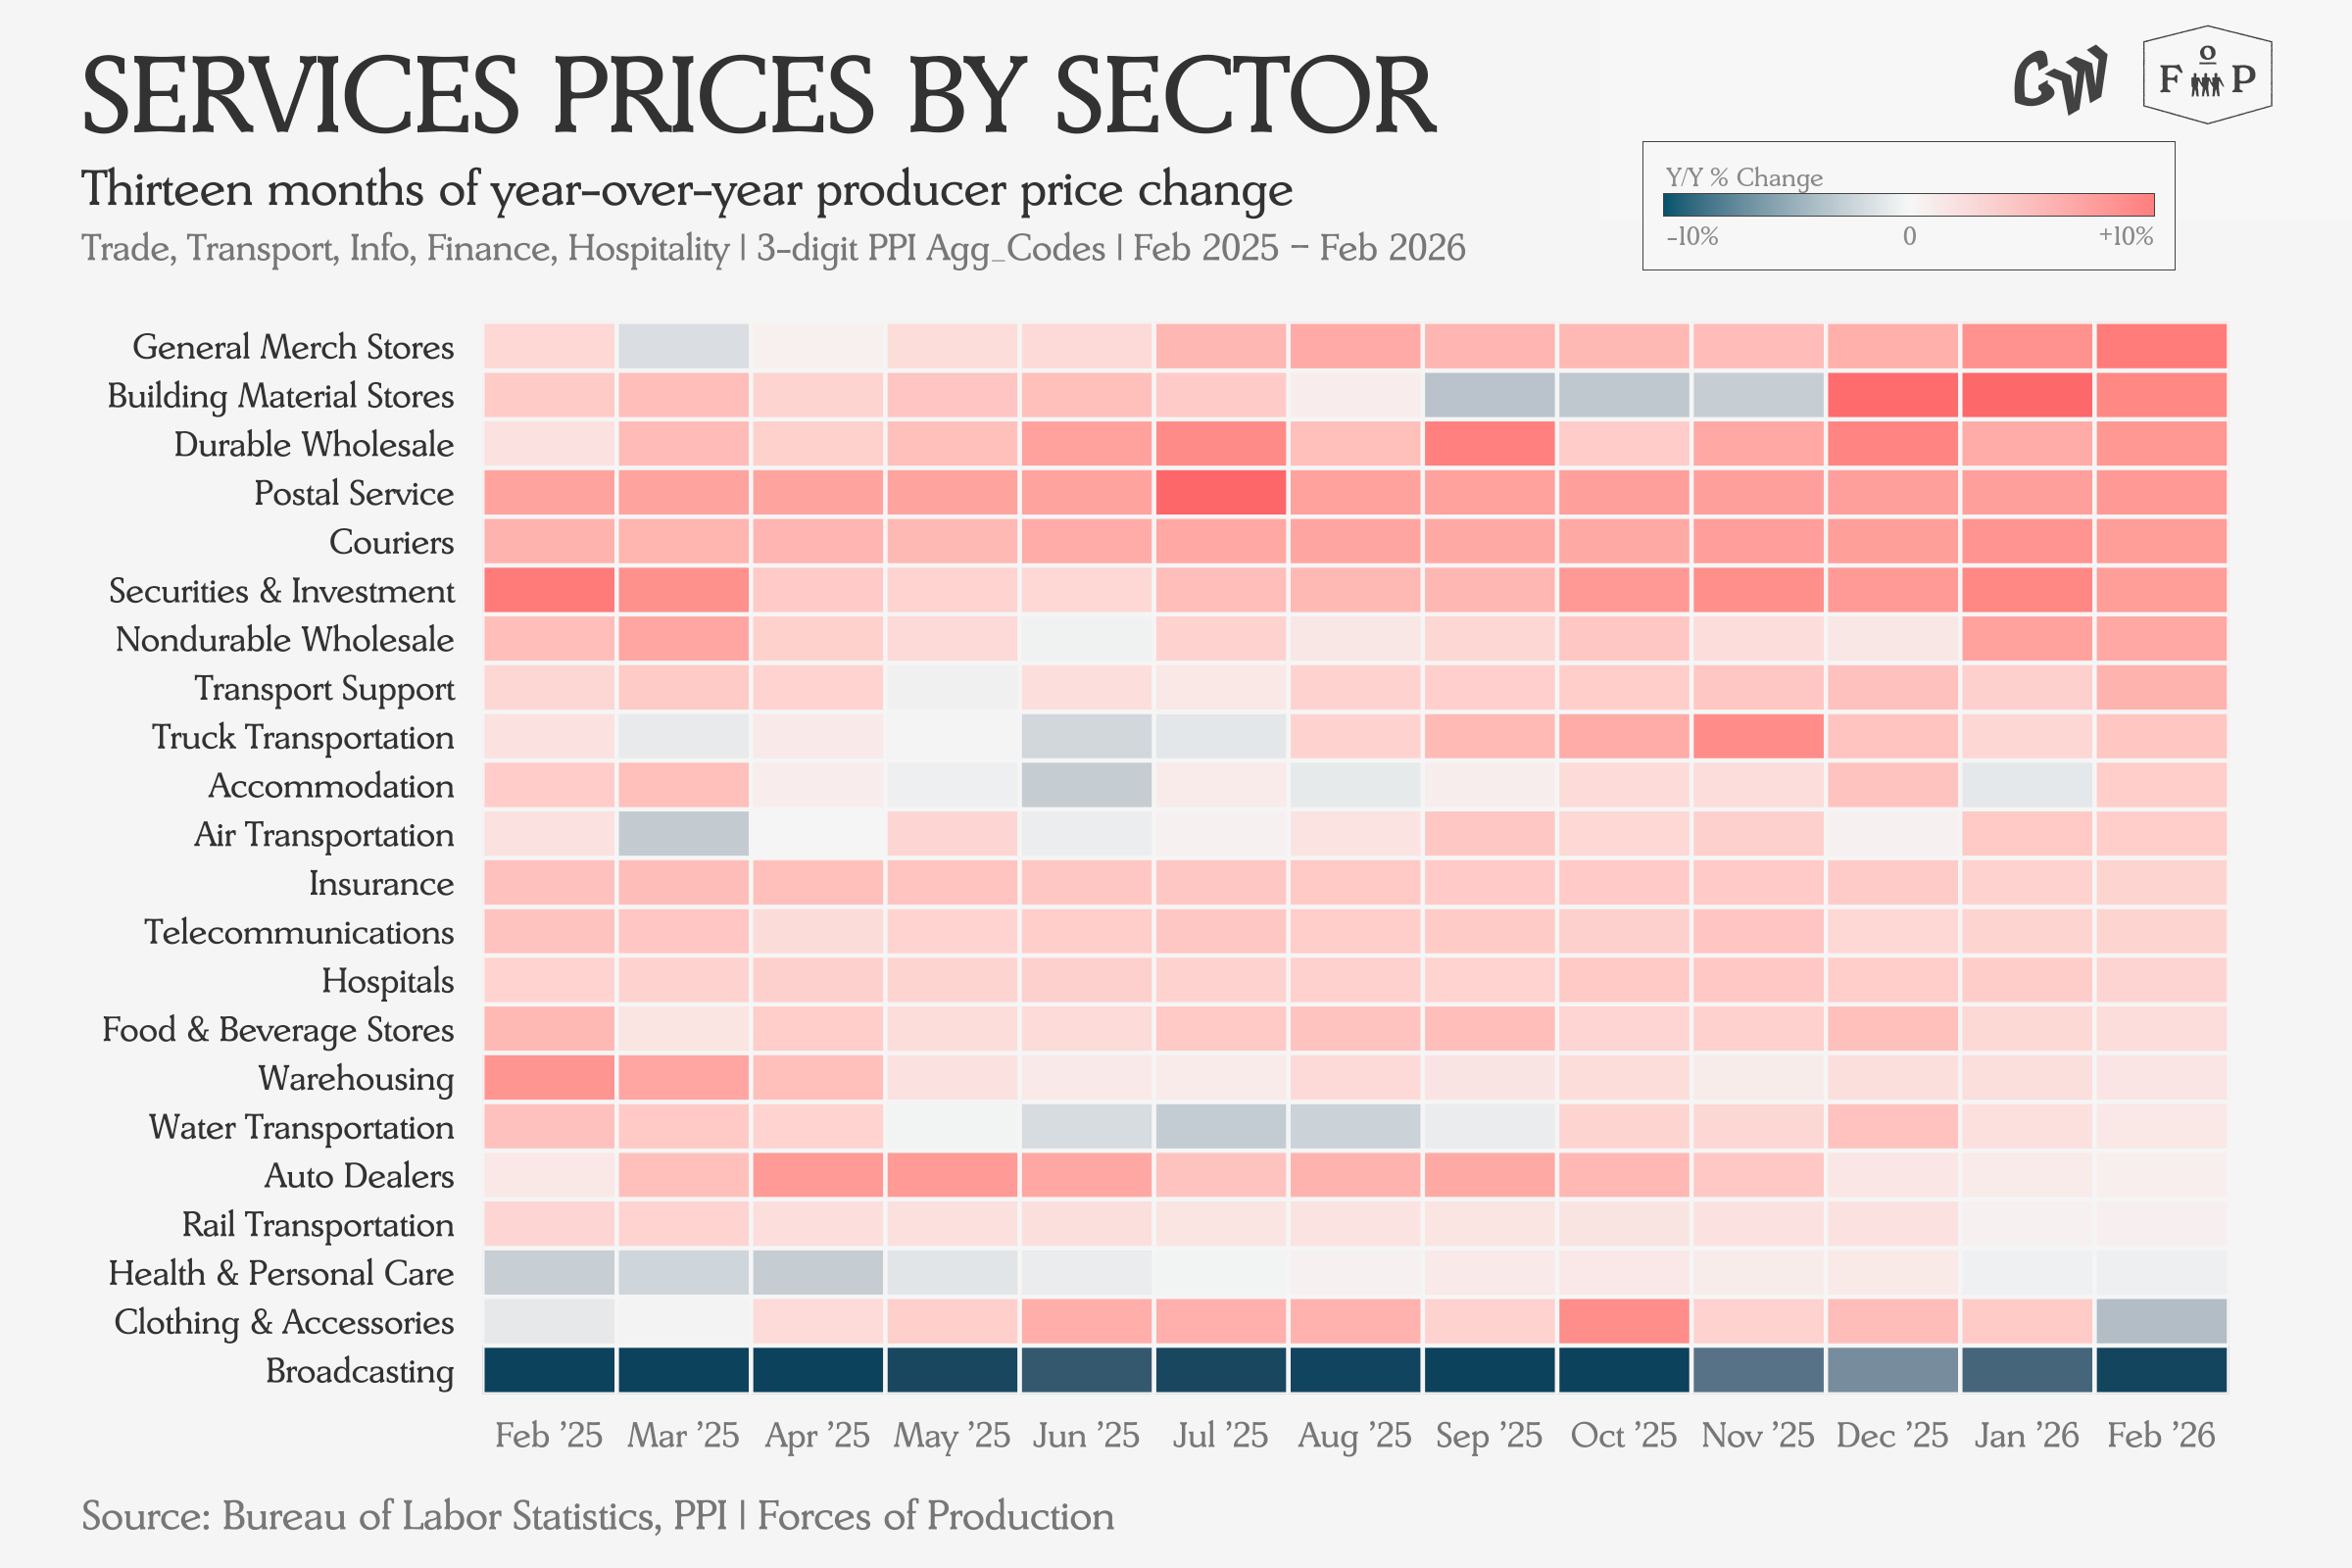
The services heatmap shows rising prices largely concentrated in wholesale trade and the retail margin sectors that sit immediately downstream of it. The only significant price decreases come from broadcasting, continuing a long deflationary streak.
Trade
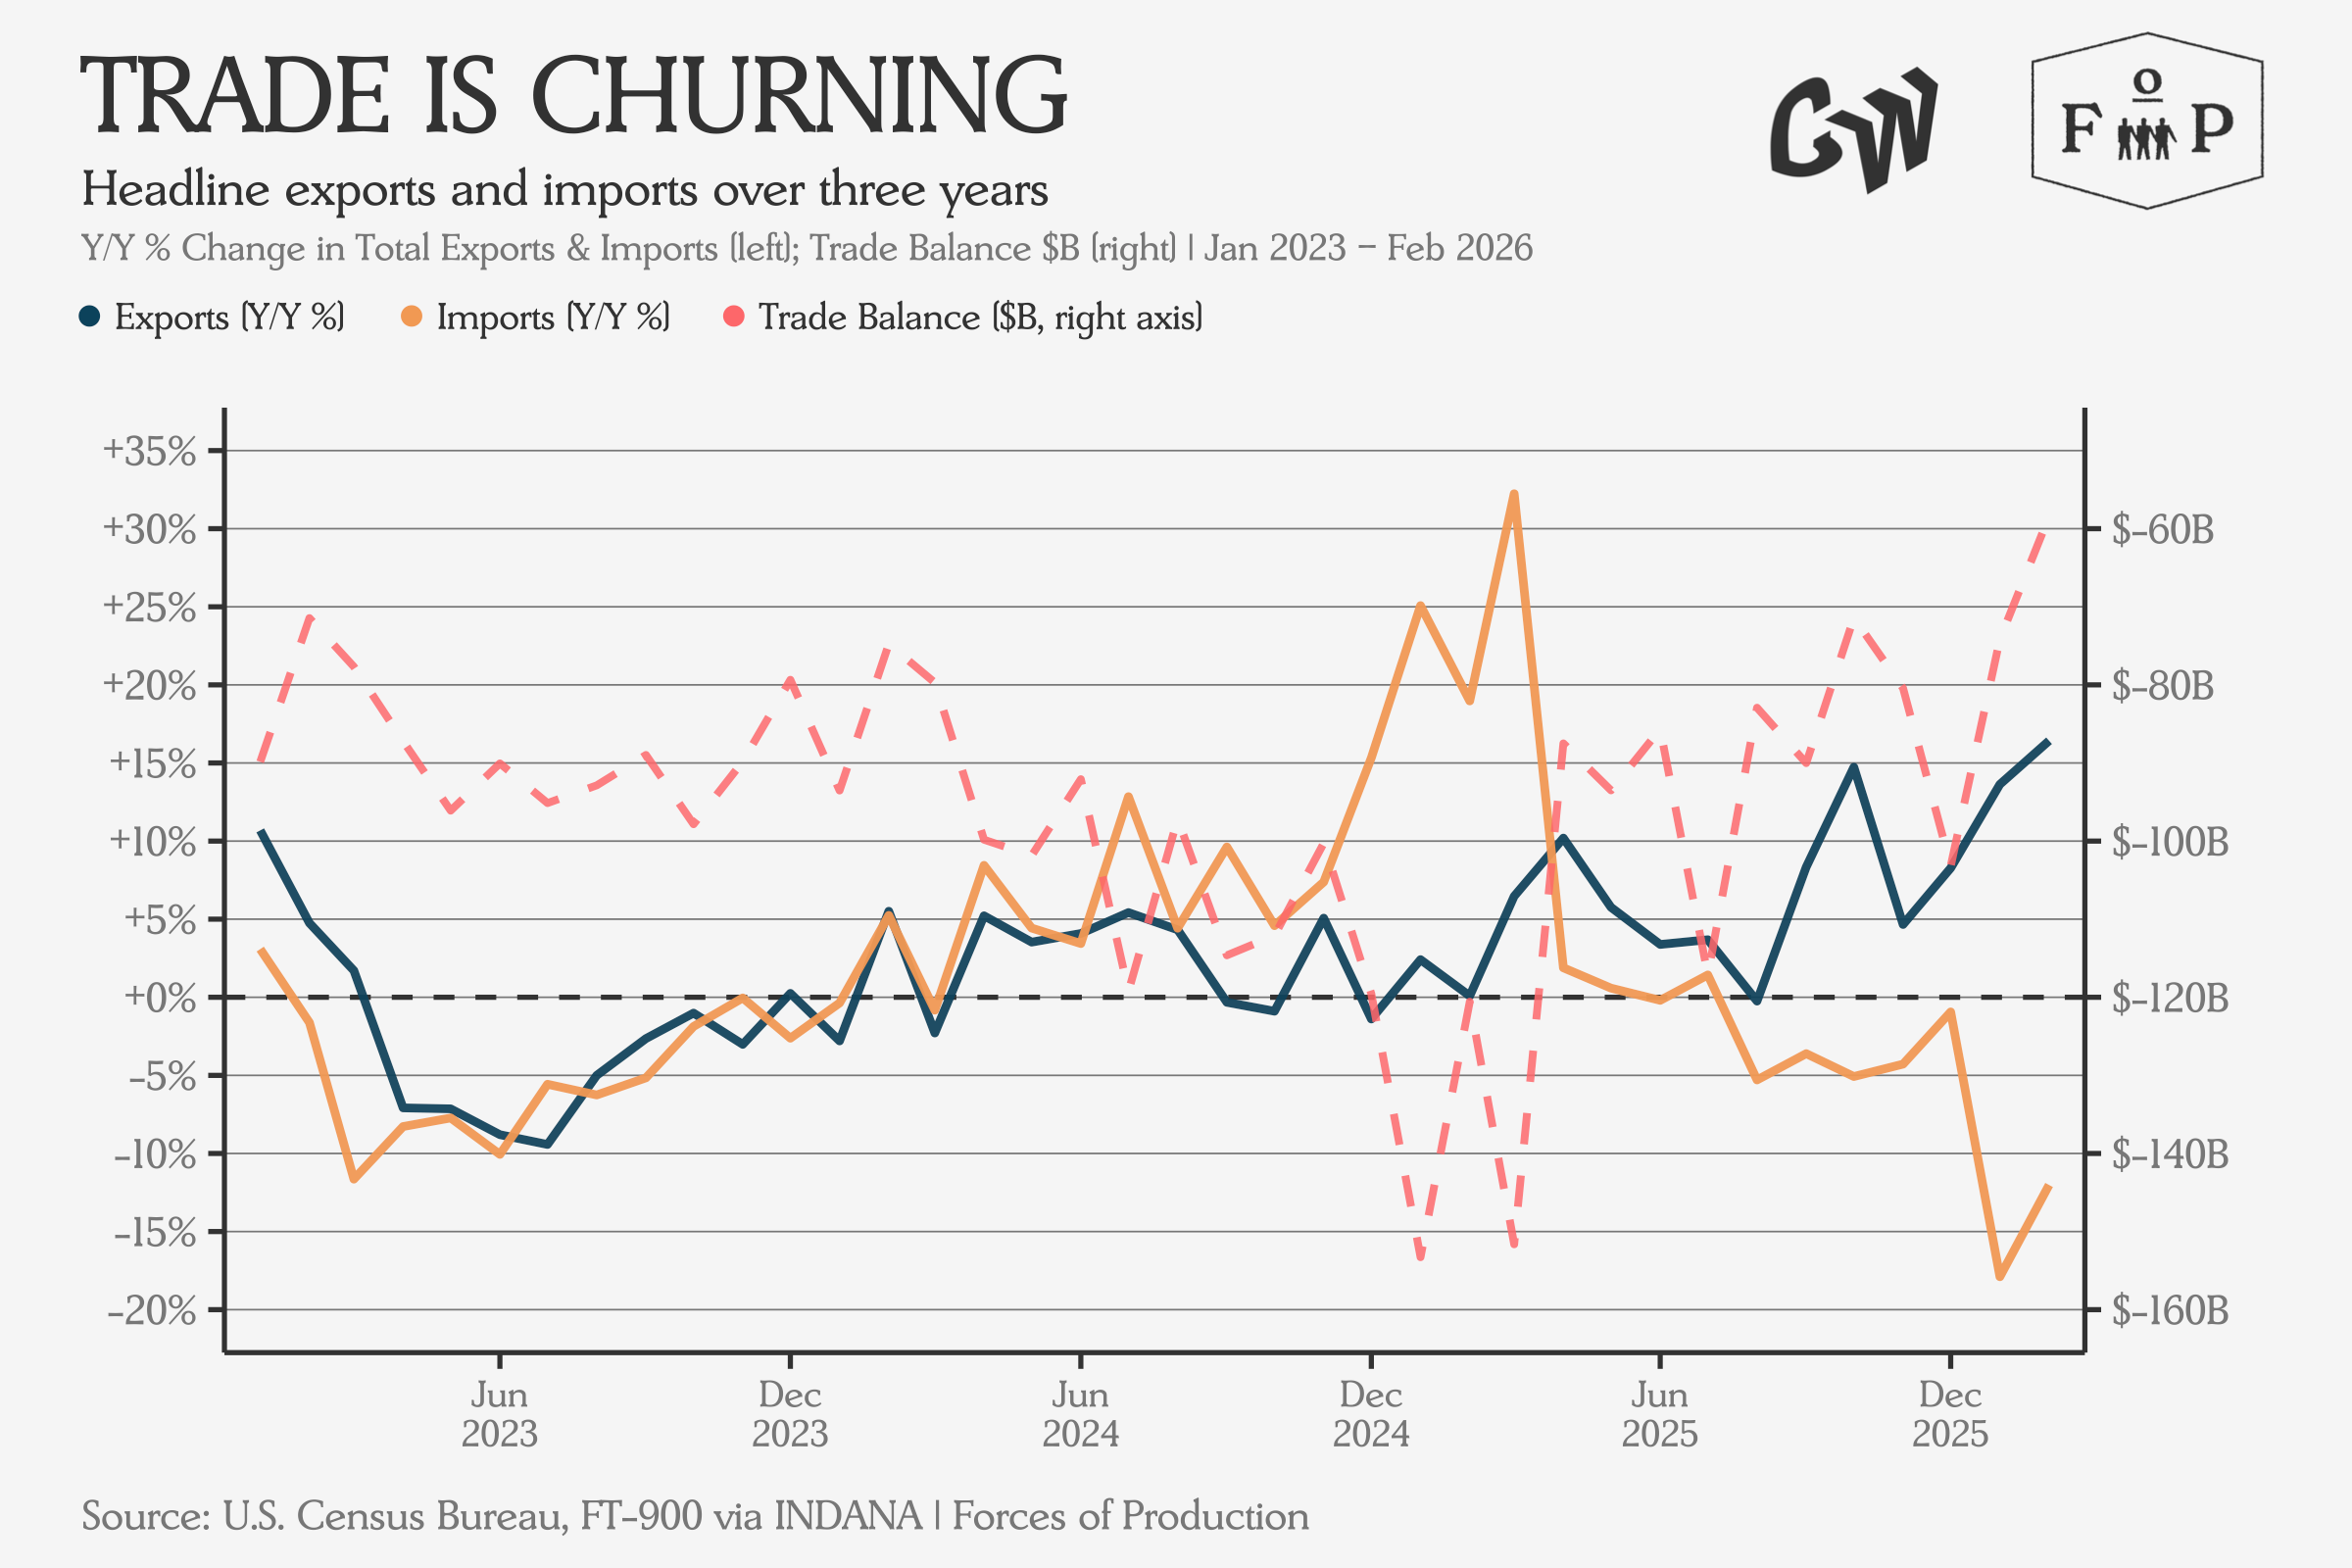
In the January data released in March, we see imports continuing to shrink, but at a decelerating rate. Export growth is rising at the same time, which cashes out to a modest improvement in the trade balance.
The same sectors whose output we see lagging in the industrial production data continue to see declining exports. Interestingly, many of them are also seeing declining imports, suggesting a demand problem as much as an issue of competitiveness. In contrast, computer and electronic products are moving in both directions at speed, with exports up 35.5 percent year-over-year and imports up 53.2 percent. This is what a globally-integrated semiconductor supply chain looks like in motion.
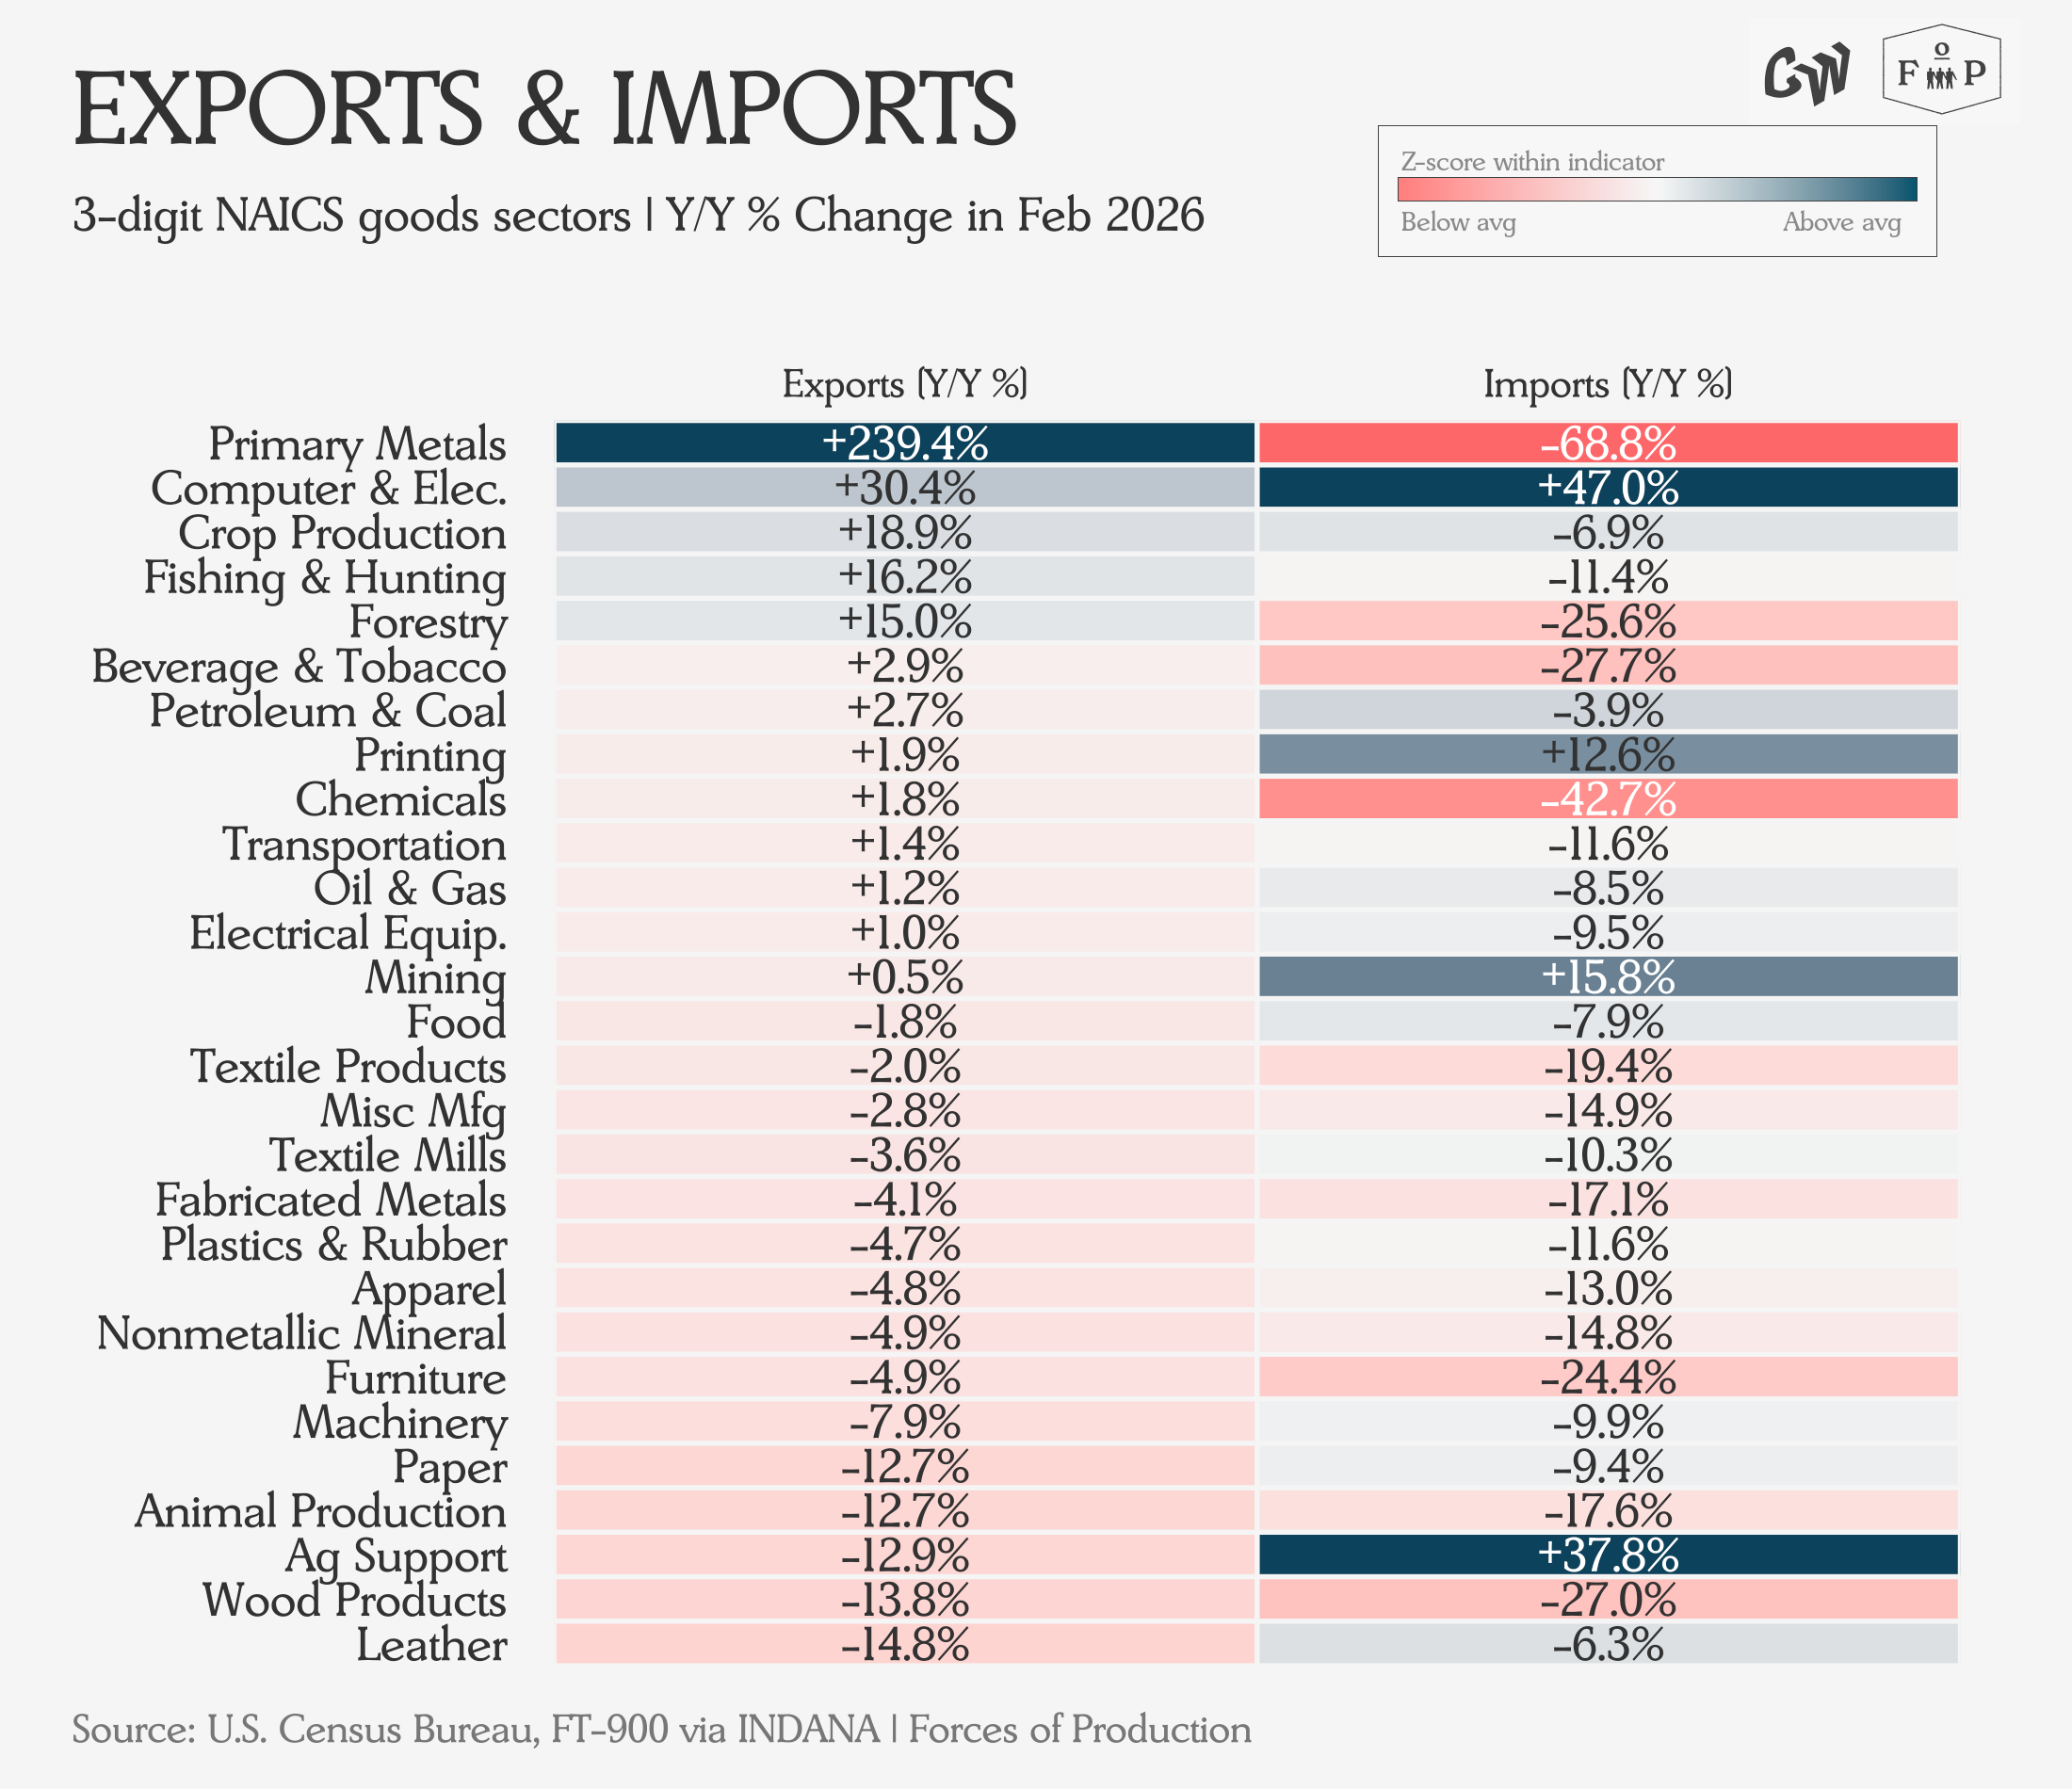
Yet, outside of extraction and tech, we see imports and domestic production are both down. Whatever is replacing the imports is not US manufacturing.
What It All Means
What this month’s data captures is a system that has been holding remarkably still in the moment before a major oil shock. Industrial production hovers around 2017 levels, capacity utilization has been roughly unchanged for a decade while employment is decelerating towards a structurally lower breakeven growth rate. Producer prices are running near three percent — things have calmed down on the supply side despite the ongoing uncertainty.
Now, inflation is coming.