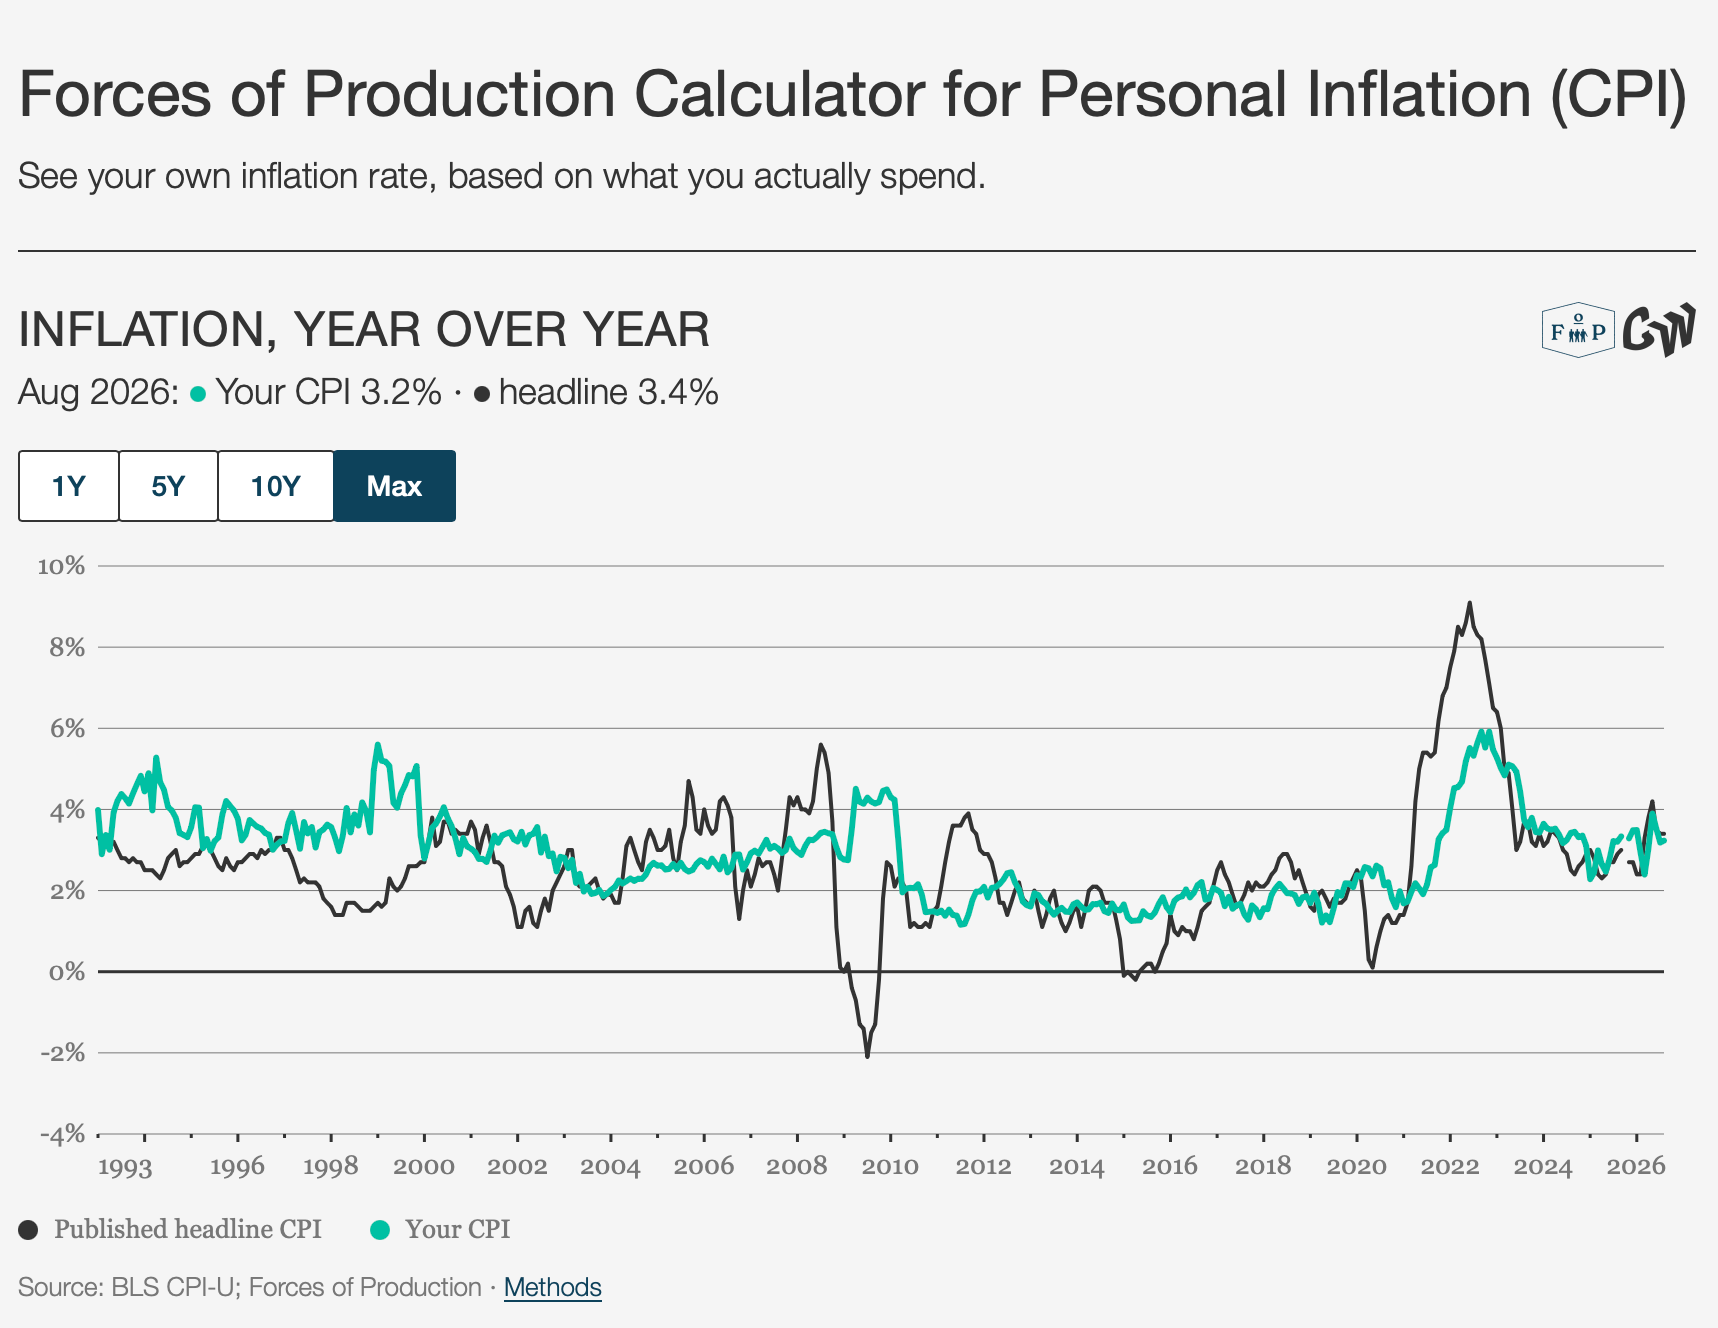
Everyone is worried about affordability going into the midterm elections in November. Luckily, we at Forces of Production have built a “Calculator for Personal Inflation (CPI)” to help our readers understand how the headline Consumer Price Index (CPI) inflation number would look if it were assembled with specifically them in mind.
Affordability
Households across the country are talking affordability, with Gallup finding that the high cost of living “continues to top Americans’ list of the most important financial problems facing their families”, while the Federal Reserve‘s household survey recently found 58 percent of adults saying that price changes over the past year had made their finances worse.
Politicians are talking affordability too, from progressive politicians putting demands for affordability at the center of their platforms to Trump dismissing the idea as irrelevant.
Meanwhile, between the market impacts of tariffs, the labor supply impacts of immigration policy and the energy supply impacts of foreign policy, the Trump Administration has set a course to bring inflation back.
What makes affordability so complex is that it is more than just inflation. Where inflation metrics track the aggregated rate of change in the level of measured prices in a general way, affordability questions are always about the individual, and about their wages and the cost of living, rather than just the “fast and slow” change in prices. Affordability is really about all of the individual relationships between wages and prices, and how those relationships combine to produce different households’ individual economic situations.
Every household uses different amounts and sources of income to consume different amounts of different things, and both sides of the equation are constantly changing. Now, granted, there are some essentials for a dignified life which every household must buy: housing, food, energy, healthcare. But different households will satisfy these basic needs — and other broader needs — in different ways, consuming different market baskets whose contents’ prices all change at different rates in different places and at different times!
We at Forces of Production are proud to present a new tool for thinking through this mess: our Calculator for Personal Inflation (CPI).
It is designed to allow the user to take control of the inflation data and change the market basket to something a bit closer to what you actually buy each month. It runs on the same granular data from the Consumer Price Index as the headline CPI numbers published every month by the BLS.
Rather than trying to explain how the “value of a dollar” has changed, with this tool, users can use the same statistics to explore how much their own cost of living has changed over time.
Calculating Personal Inflation
So, take a look here and build your own basket with the “Walkthrough” or just start tweaking.
As you change the share of one category, you will see the rest of them change to compensate. Once you’ve got the share set right, you can use the lock in the bottom corner to anchor that category. These locks only hold at their own level though — click on a category and it shows you the subgroups that comprise it, down to the most granular level of the public data.
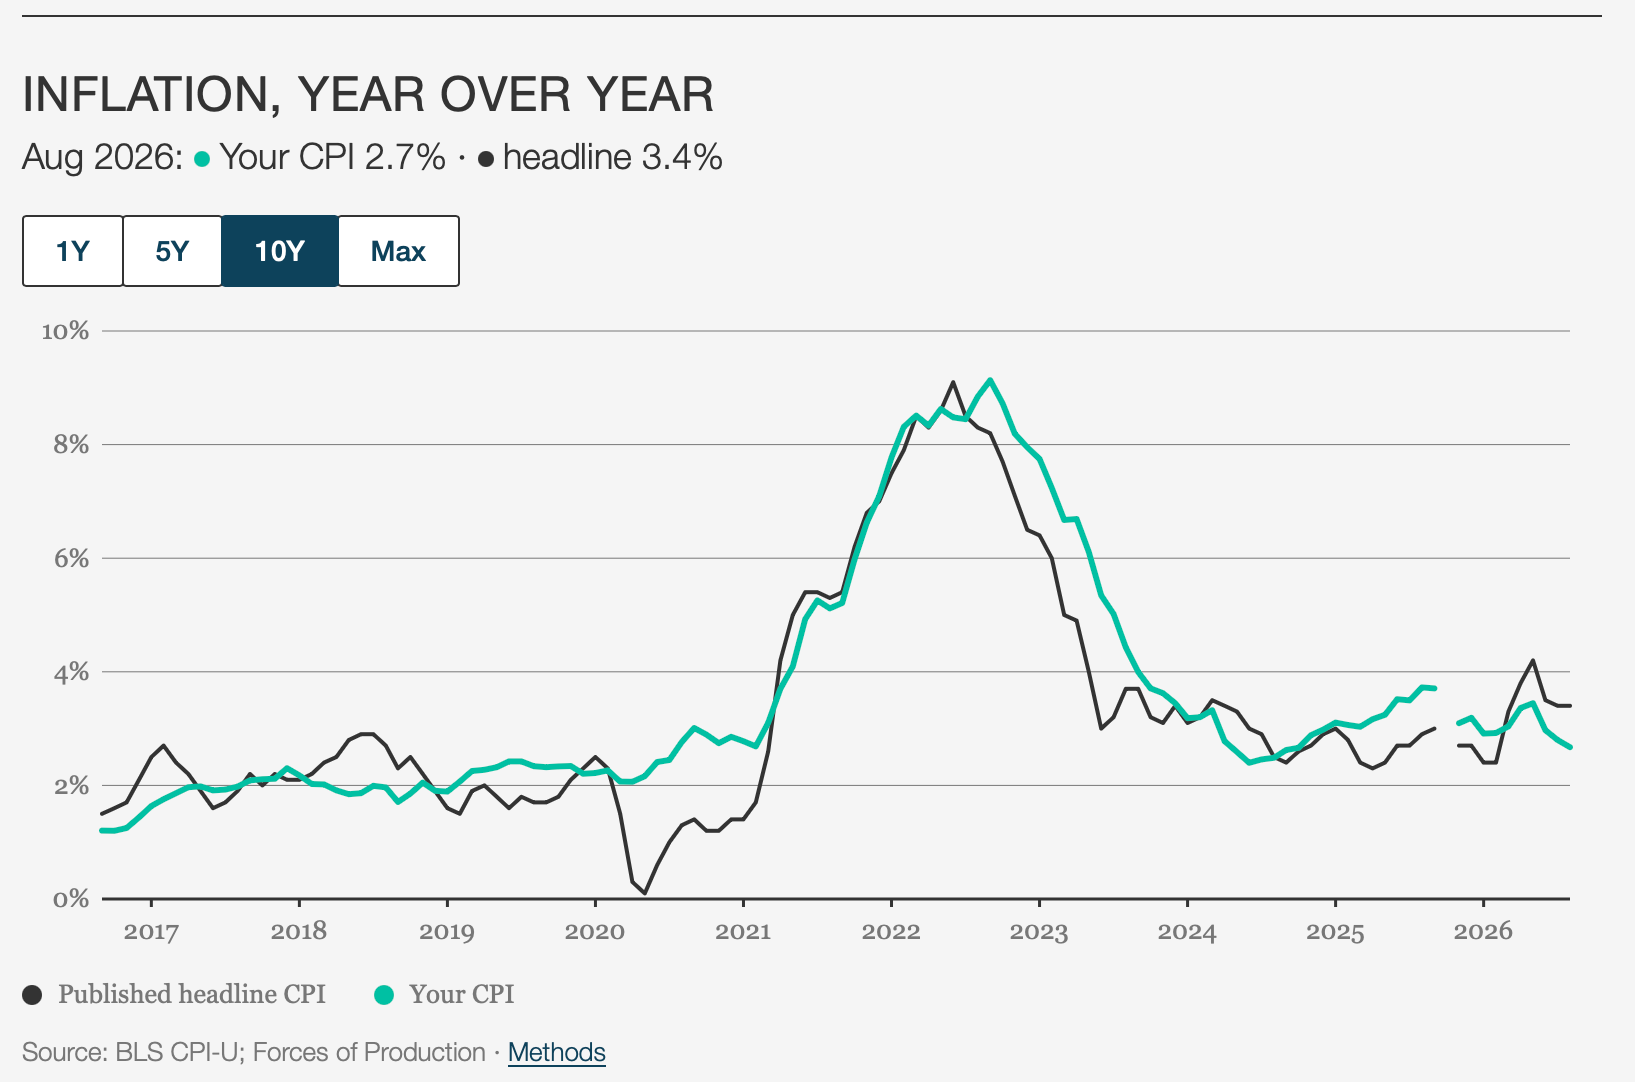
Once the index is customized to your liking, the chart at the top shows your current inflation rate and how it has changed over time relative to the headline inflation rate. After you’ve got it customized, to save your settings, you can download a text file to reupload and restore your settings.
I ran mine — with the budget for musical instruments noticeably higher than in the BLS version — and it came through surprisingly smooth relative to historical inflation, and is actually below the headline number right now. Not bad!
Affordability Beyond Inflation
But affordability is more than just inflation. Inflation is just one side of the relationship between wages and prices. Wages change differently and for different people over time, both in the sense of individual lifetimes and historical time across business cycles and waves of technical innovation. This creates a desire for a single metric to compare and real wages are often used for this without mentioning the aggregation issues involved (see, for example, the Cato Institute and Jason Furman).
As I have argued elsewhere, this is bad practice. For real wages to accurately capture these changing dynamics of affordability over time, we would need massively more granular and resampled income and spending data, and an aggregation system which tracks those same households consistently. Without that, changes in real wages are unreliable as an affordability metric and are basically dominated by changes in the price of gas.
A number of researchers and institutions have also identified this limitation and have stepped into the gap by putting forward a range of approaches to the affordability question. The Affordability Dashboard at the Economic Security Project organizes a range of indicators around the idea that “we should move our unit of affordability analysis away from macro variables and toward micro ones”. Meanwhile, Groundwork Collaborative has put forward a Shoppers’ Bill of Rights focusing on the mechanisms by which corporate pricing power is used to gouge households instead of deliver affordability. On the right, Oren Cass’s Cost-of-Thriving Index at American Compass estimates how many weeks a male single-earner must work to cover a middle-class family’s food, housing, health care, transportation and college fees (also explored at conceptual length here).
At Forces of Production, we believe a Productive State approach with the aim of decommodifying essentials is at the base of any serious long-term commitment to address affordability issues, as well as the engine of a new growth and development strategy based around public investment and public ownership. By decommodification, we mean direct provision by the government, which improves affordability by cutting specific rising costs out of household market baskets while also cutting off the ability of private actors to extract profits without corresponding productivity-enhancing investment in the sector.
Many of life’s essential services have increased in price without the sector significantly increasing in productivity: housing, child and elder care, education, the list goes on. These challenges have concentrated in non-tradeable services, whose prices receive a significant amount of what Hyman Minsky called the “markup”, and which were famously identified as candidates for government provision by William Baumol.
Yet we also believe that to successfully implement the scale of decommodification and public investment that our country needs, we will need to invest massively in our public statistical apparatus. Even before the Trump Administration’s more recent attacks on the integrity of the statistical system, these agencies have been last in line for funding increases for far too long.
For a government that cares about affordability, growth, or transparency, funding broader, deeper and more precise collection of economic statistics should be a top priority. Unlike Japan — which still publishes a capital-flow table to track the structure of investment — the US abandoned the publication of comparable statistical tables after the 1997 edition. As decarbonization proceeds, this kind of information will be critical to planning and allocating investment.
At the same time, sample size limitations which could be alleviated by higher funding introduce systematic noise to the statistics we should be most sensitive to: those that cover individual sectors, individual occupations, individual geographies. Meanwhile, response rates to voluntary data collections have been steadily falling just as the BLS is being forced by budget cuts to limit staff increases that would improve the data collection process.
So, while you are finding your personal inflation rate here, please take a moment to add “increased funding to produce public economic statistics” to your political demands.
This Month’s Data
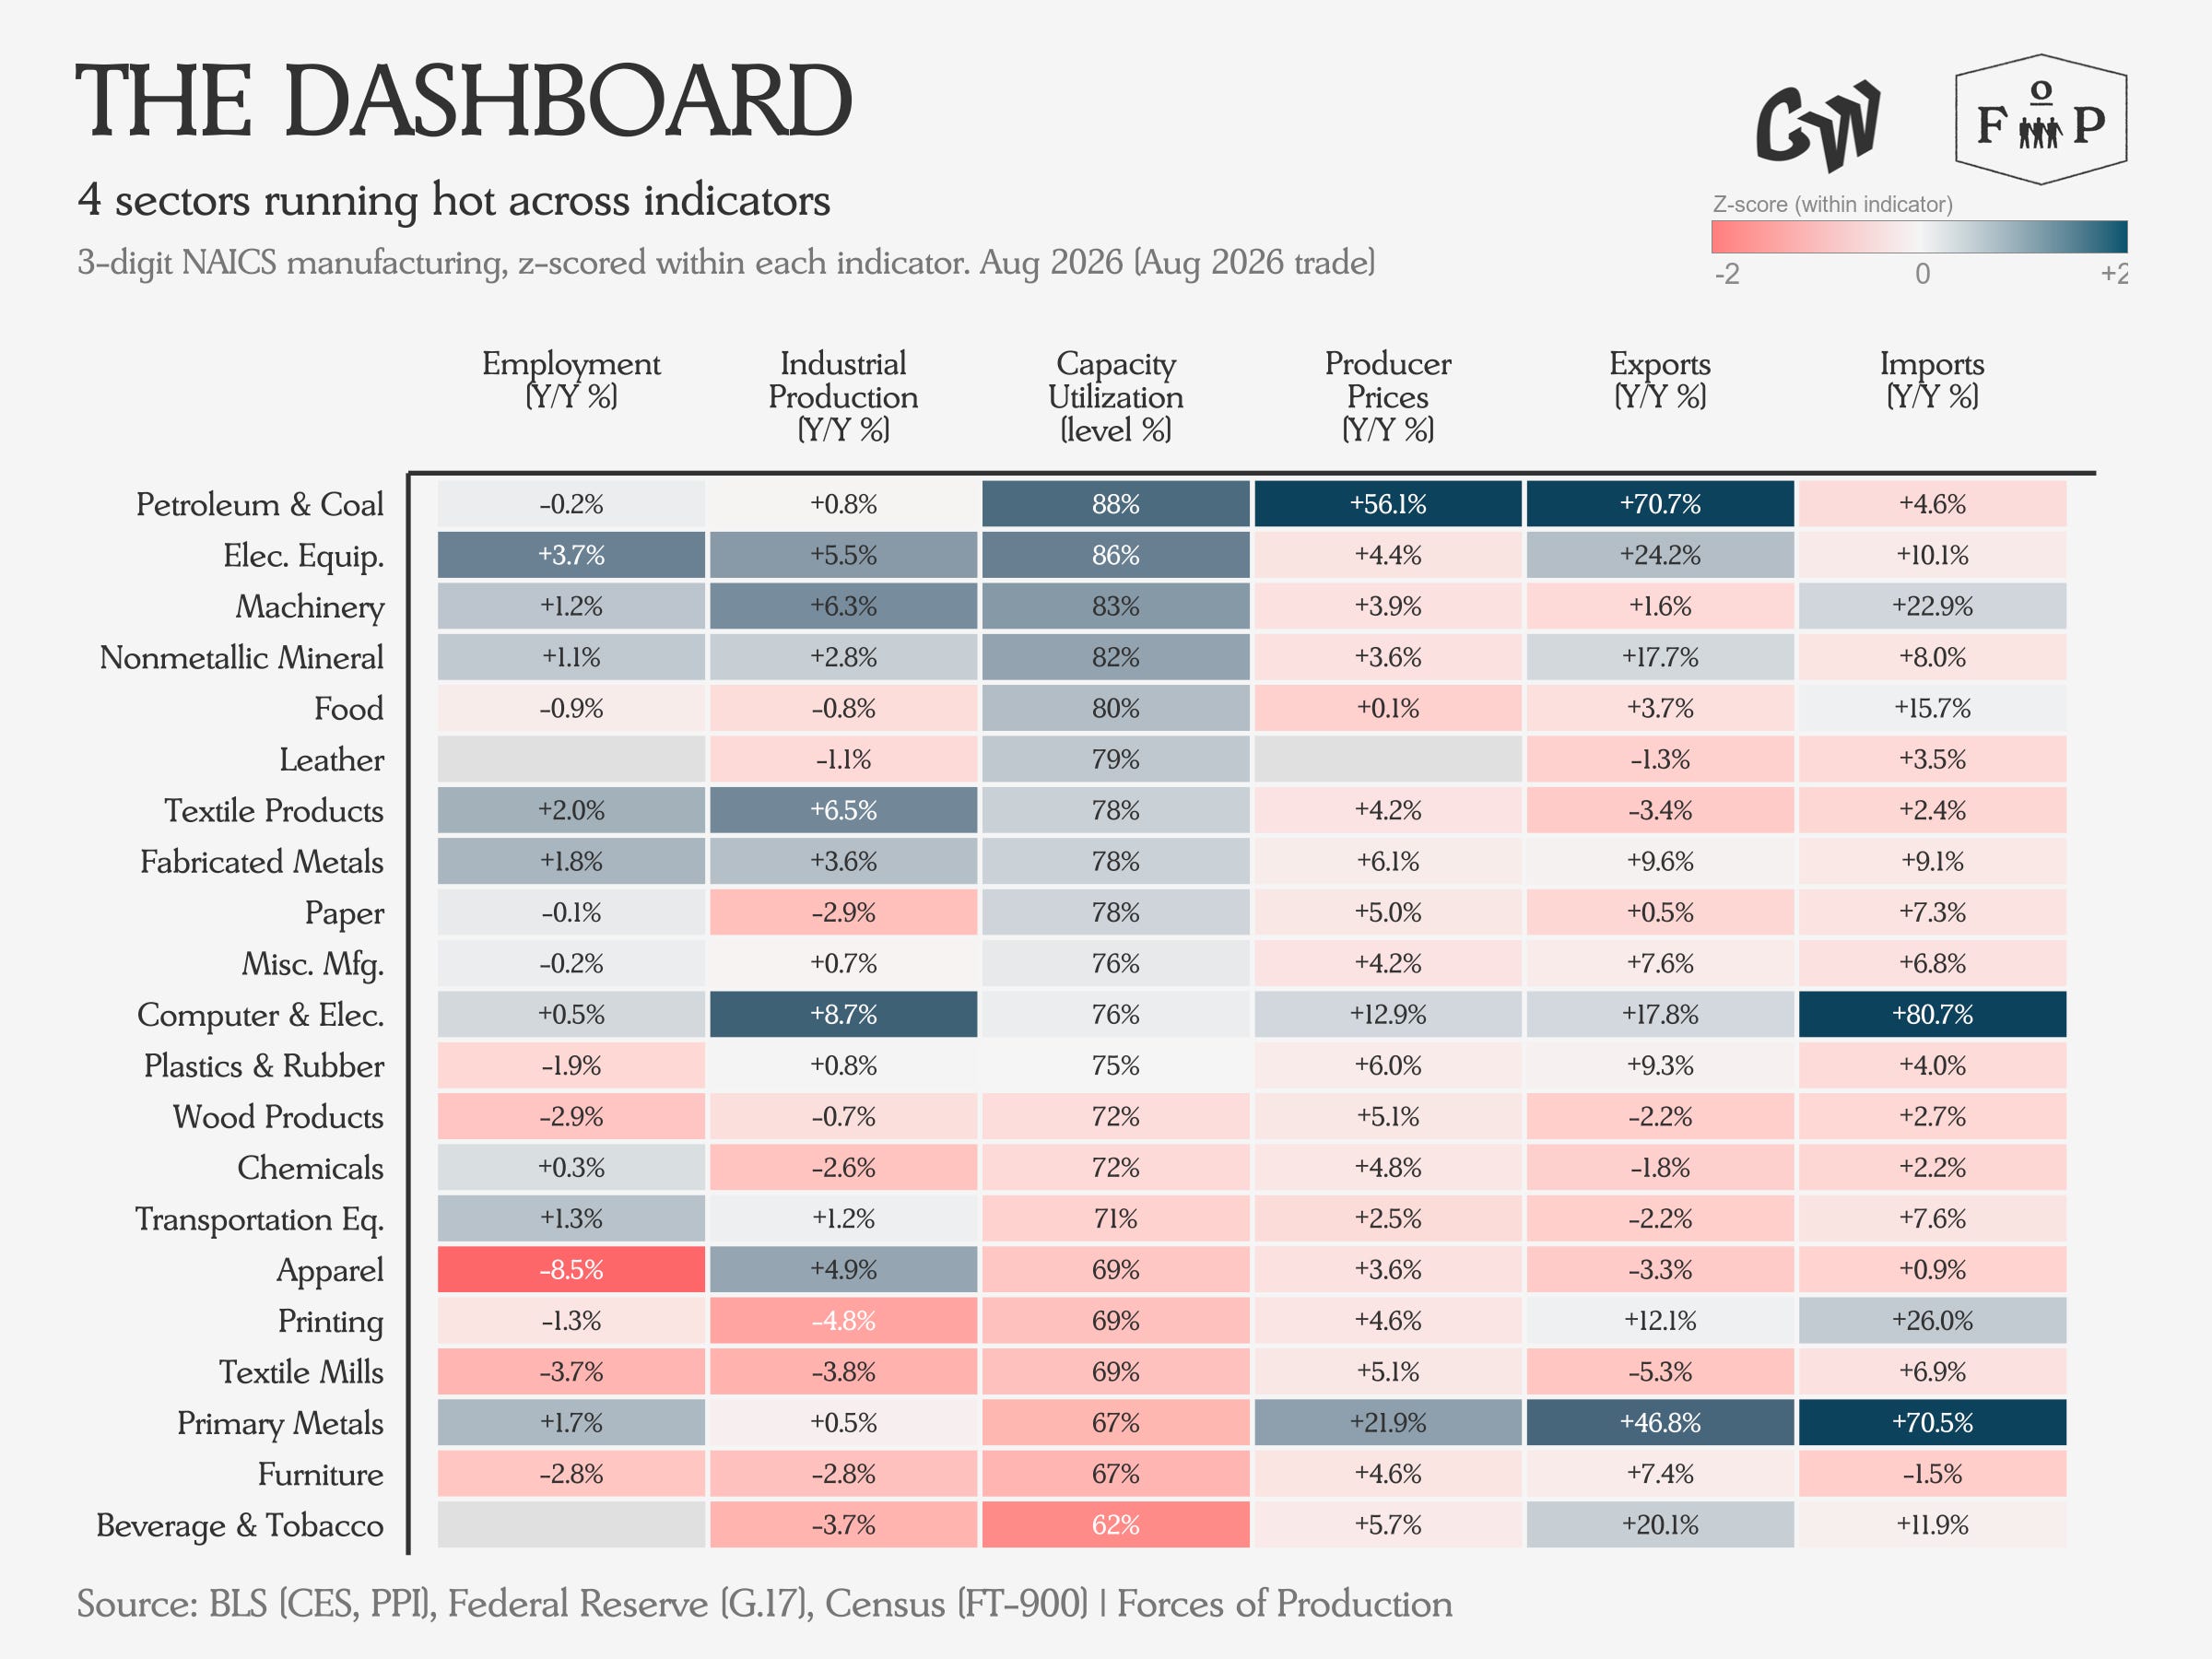
Overall, the August data showed a reasonably resilient economy continuing to rotate towards AI, Healthcare and the grid.
Employment
August payrolls came in above expectations before being revised marginally downwards. The recovery represented a rebound from weak hiring in June and July and supported the labor market case for a rate hike at the Federal Reserve’s FOMC meeting in September. With that said, the gains were largely concentrated in Restaurants and Bars as well as Local Government Education. The unemployment rate held steady at 4.1 percent on slow labor supply growth.
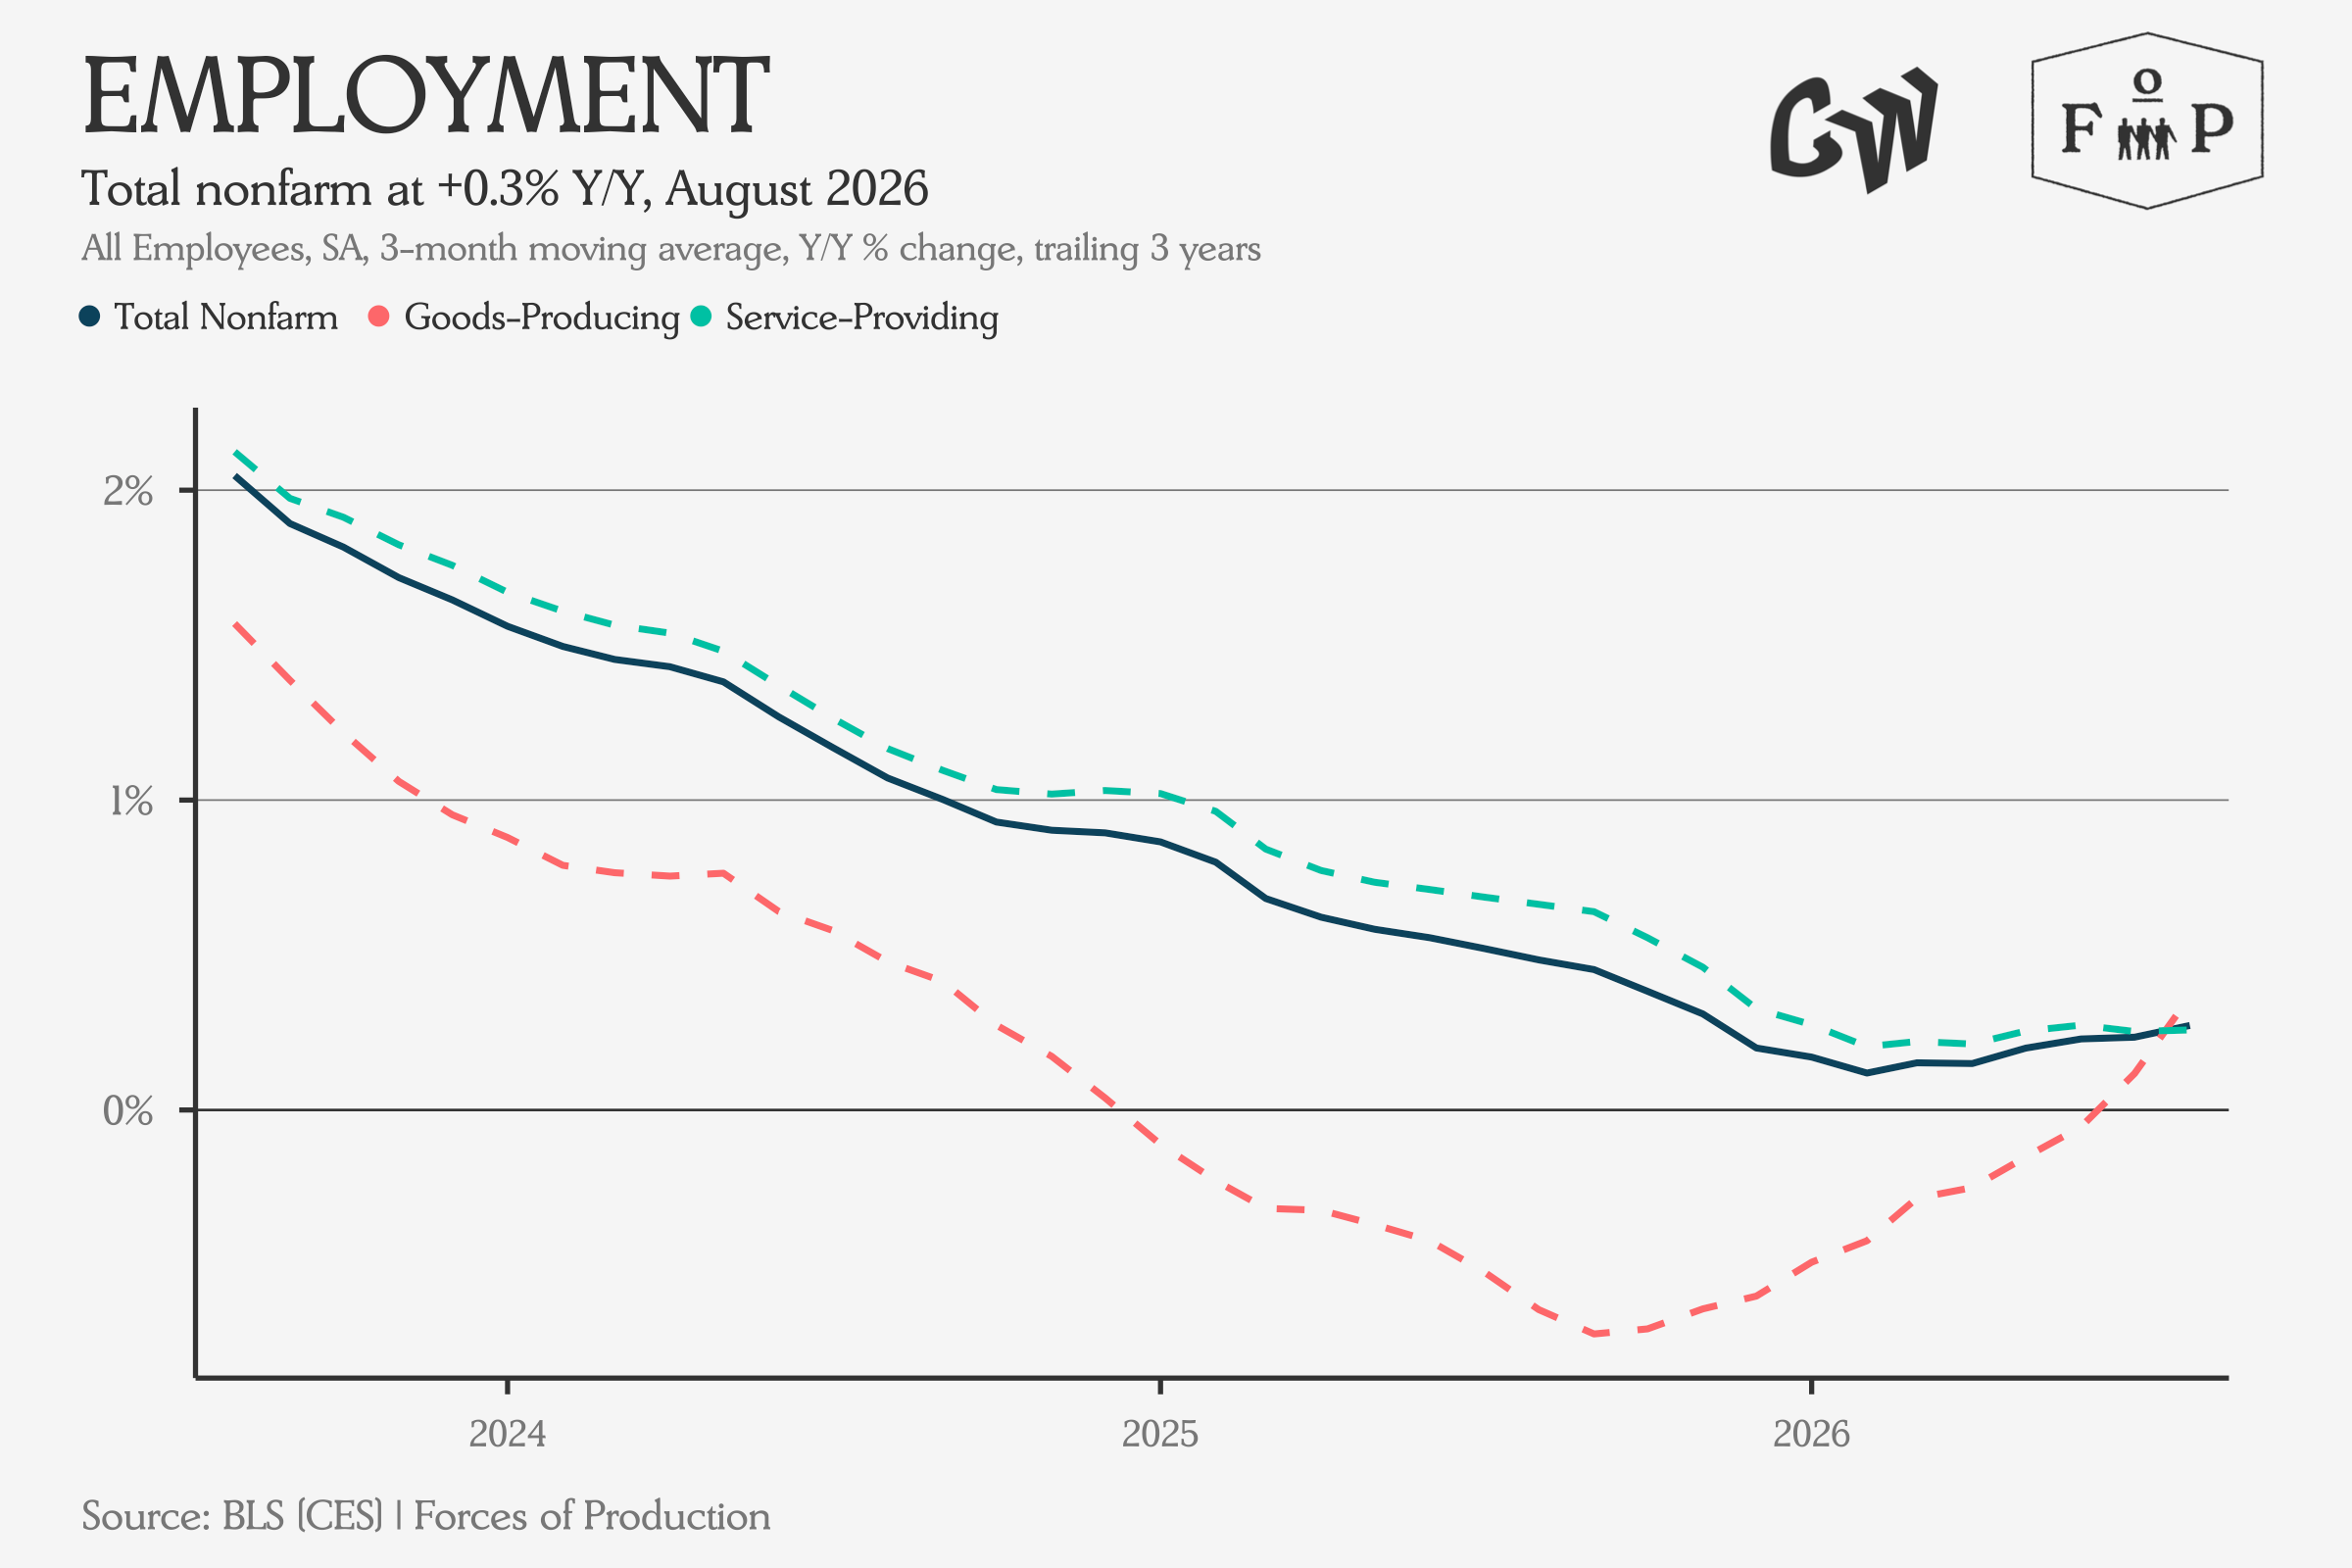
Goods-Producing sectors continue to see a hiring rebound after 18 months of decline, showing faster year-over-year growth than Service-Providing sectors for the first time in years.
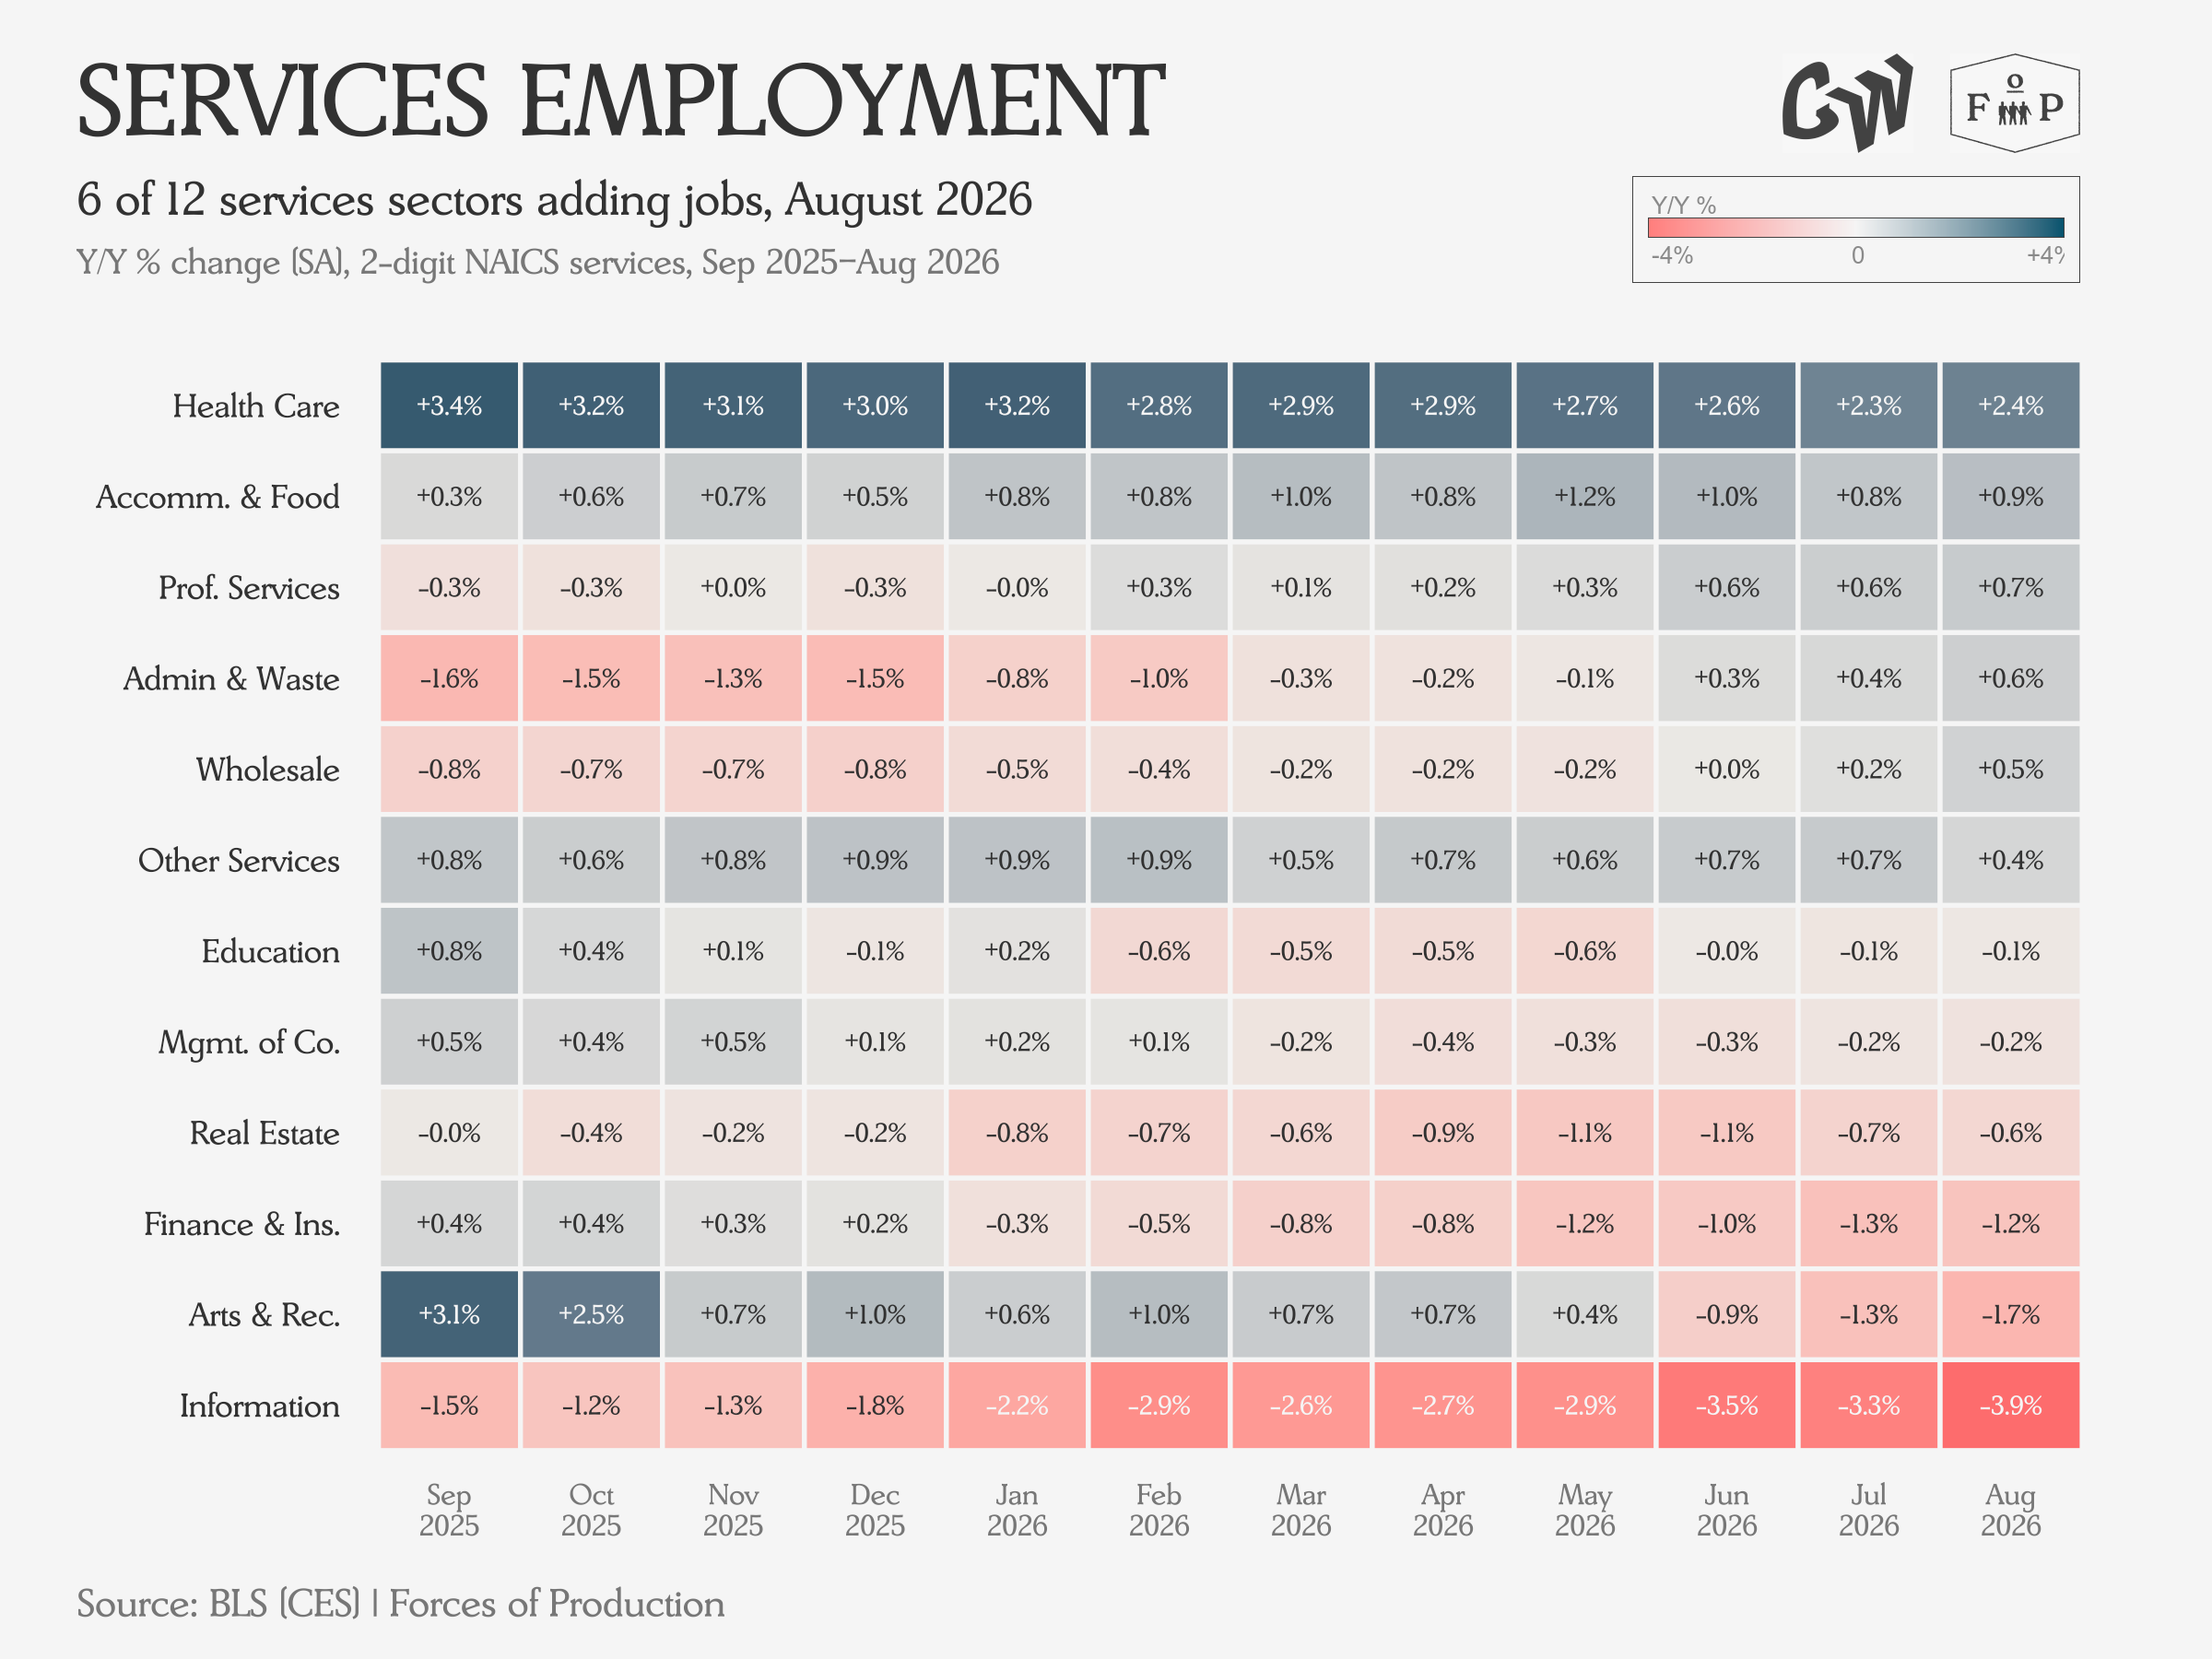
Health Care employment growth is beginning to decelerate more significantly without other sectors stepping in to pick up the slack. The rout in Information employment is gathering speed, with employment levels in the sector down almost four percent as compared to last August.
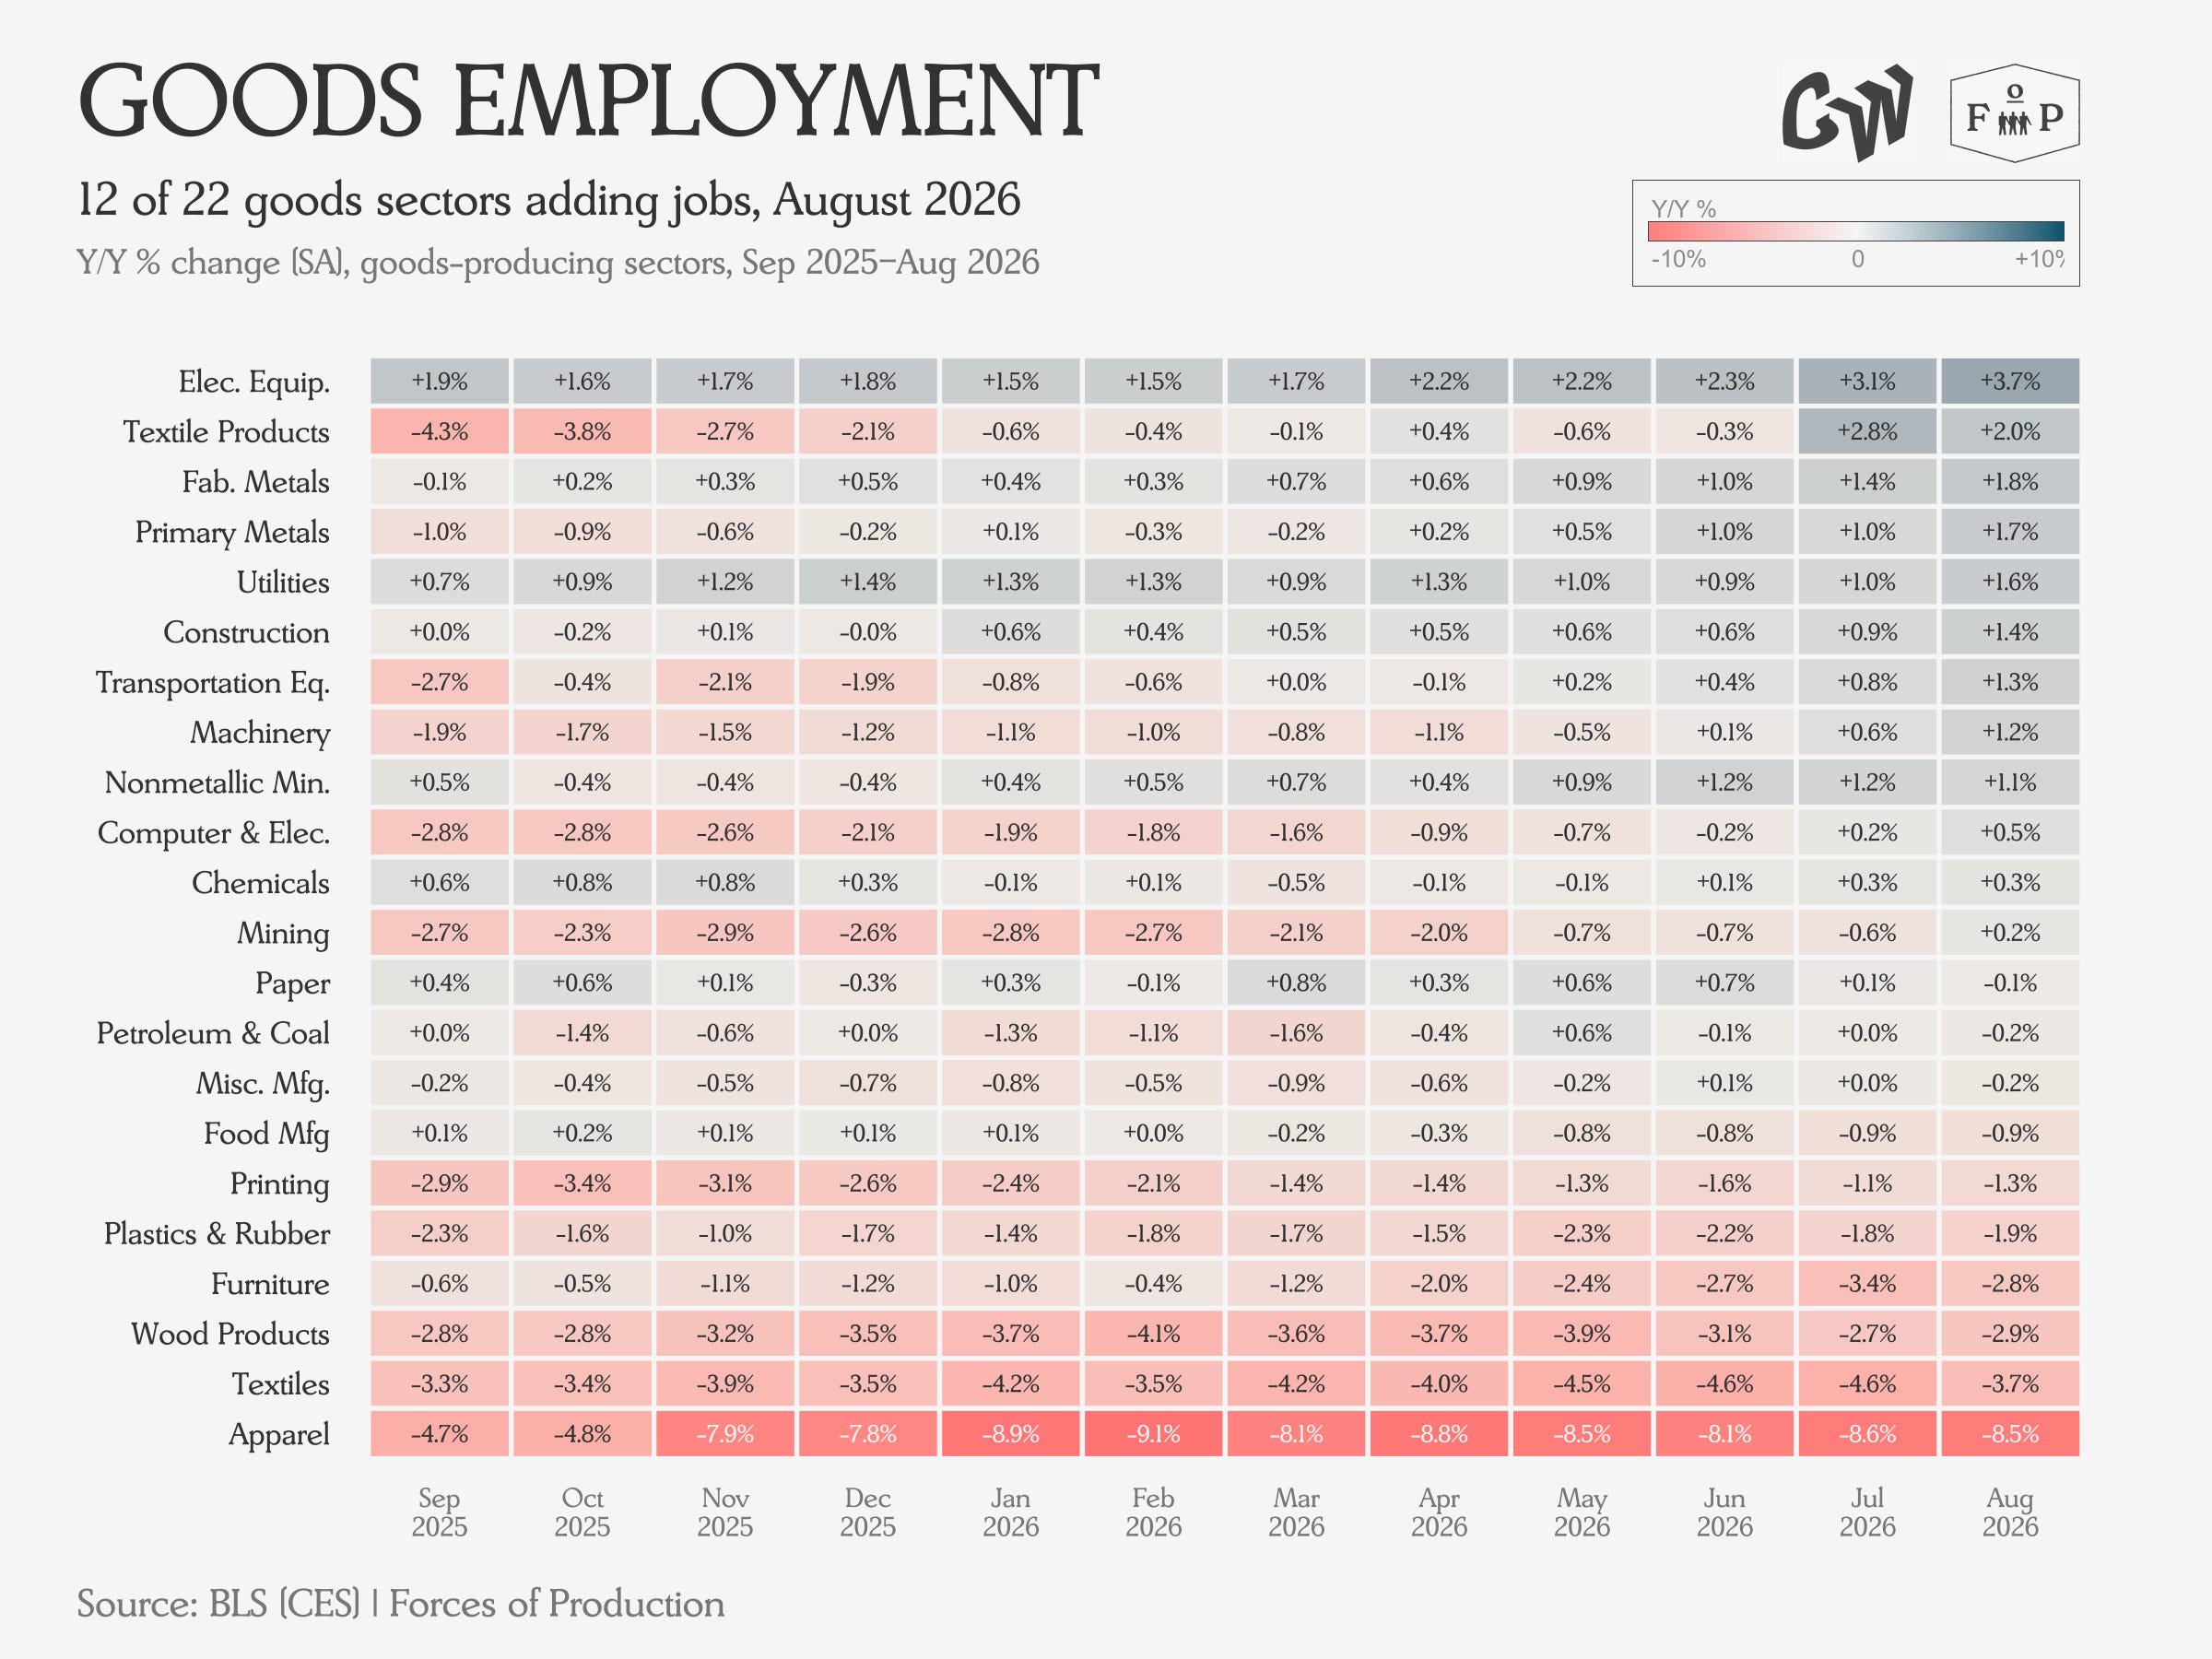
Electrical Equipment continues to build momentum, nearing a four percent year-over-year increase in the August data, nearly doubling the next-fastest-growing sectors. Utilities and Primary Metals also saw noticeable jumps as the economy continues to electrify, whether to serve AI data centers or decarbonization.
Producer Prices
Producer Prices rose as expected in August, with much of the increase driven by rising energy prices, especially diesel. Diesel scarcity has gotten worse rather than better in the meantime, while in the August data wholesale inflation hit its highest annual rate of 2026.
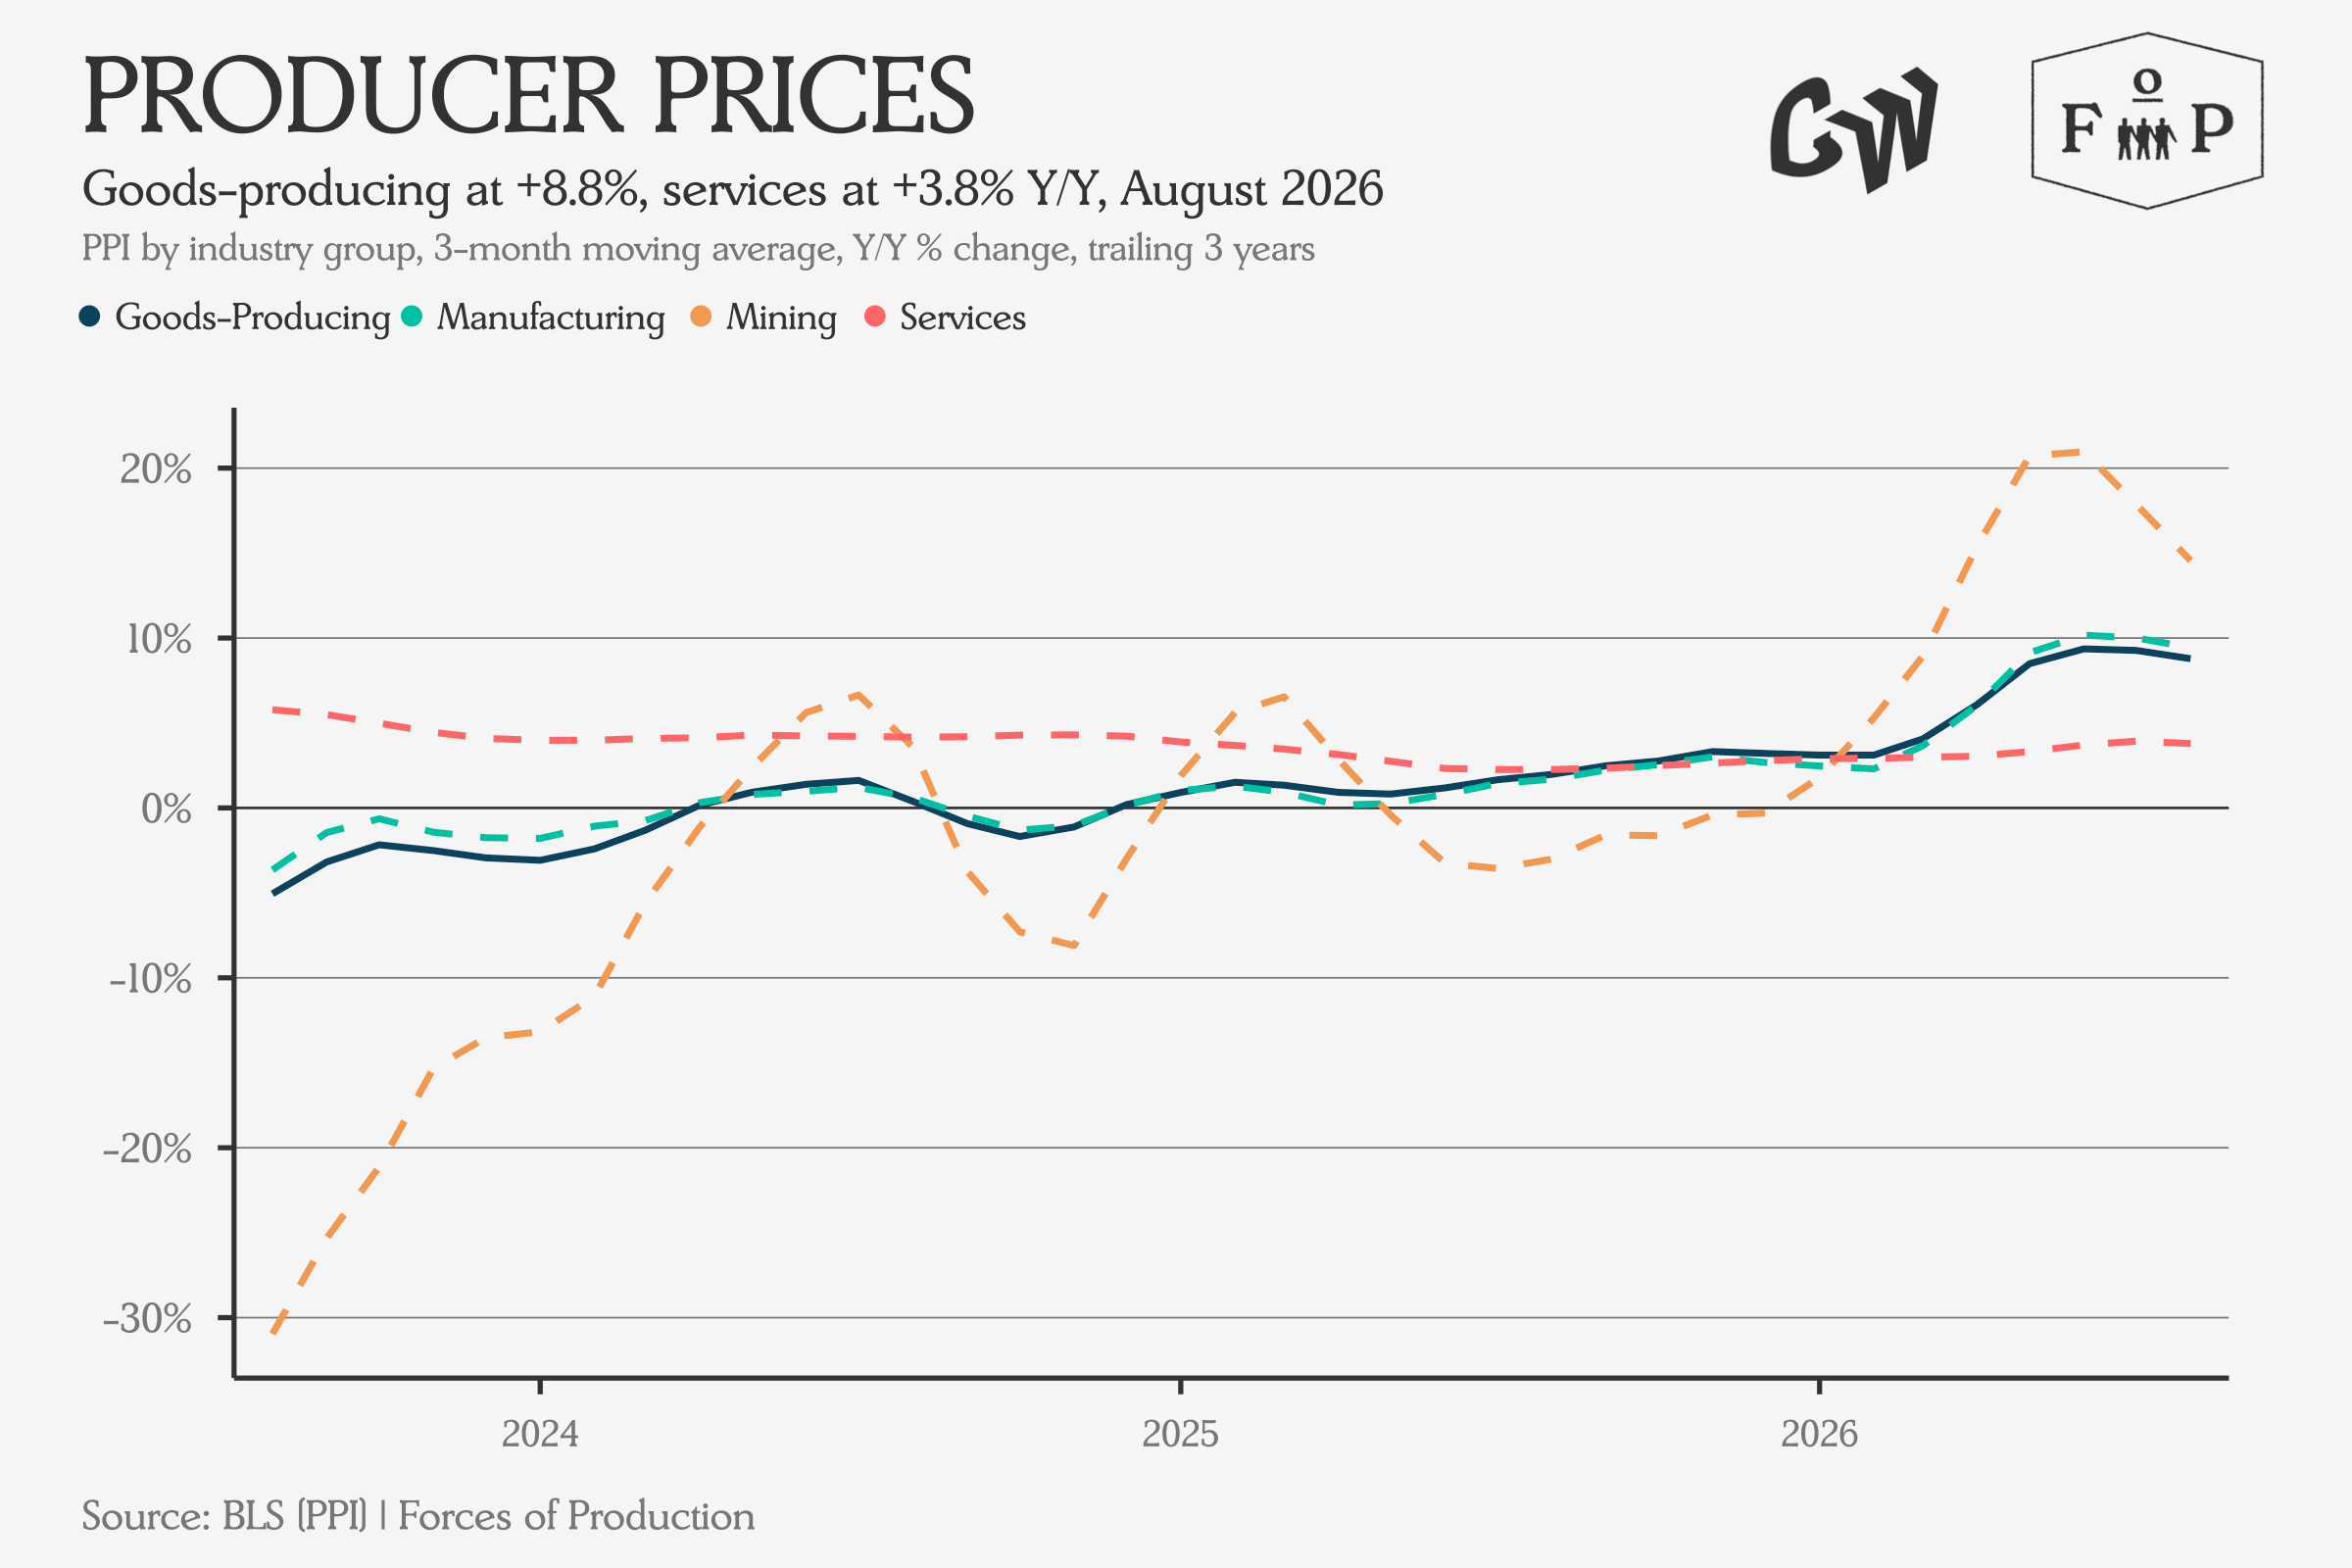
Mining cost inflation is beginning to decelerate while Goods and Services continue to grow as before.
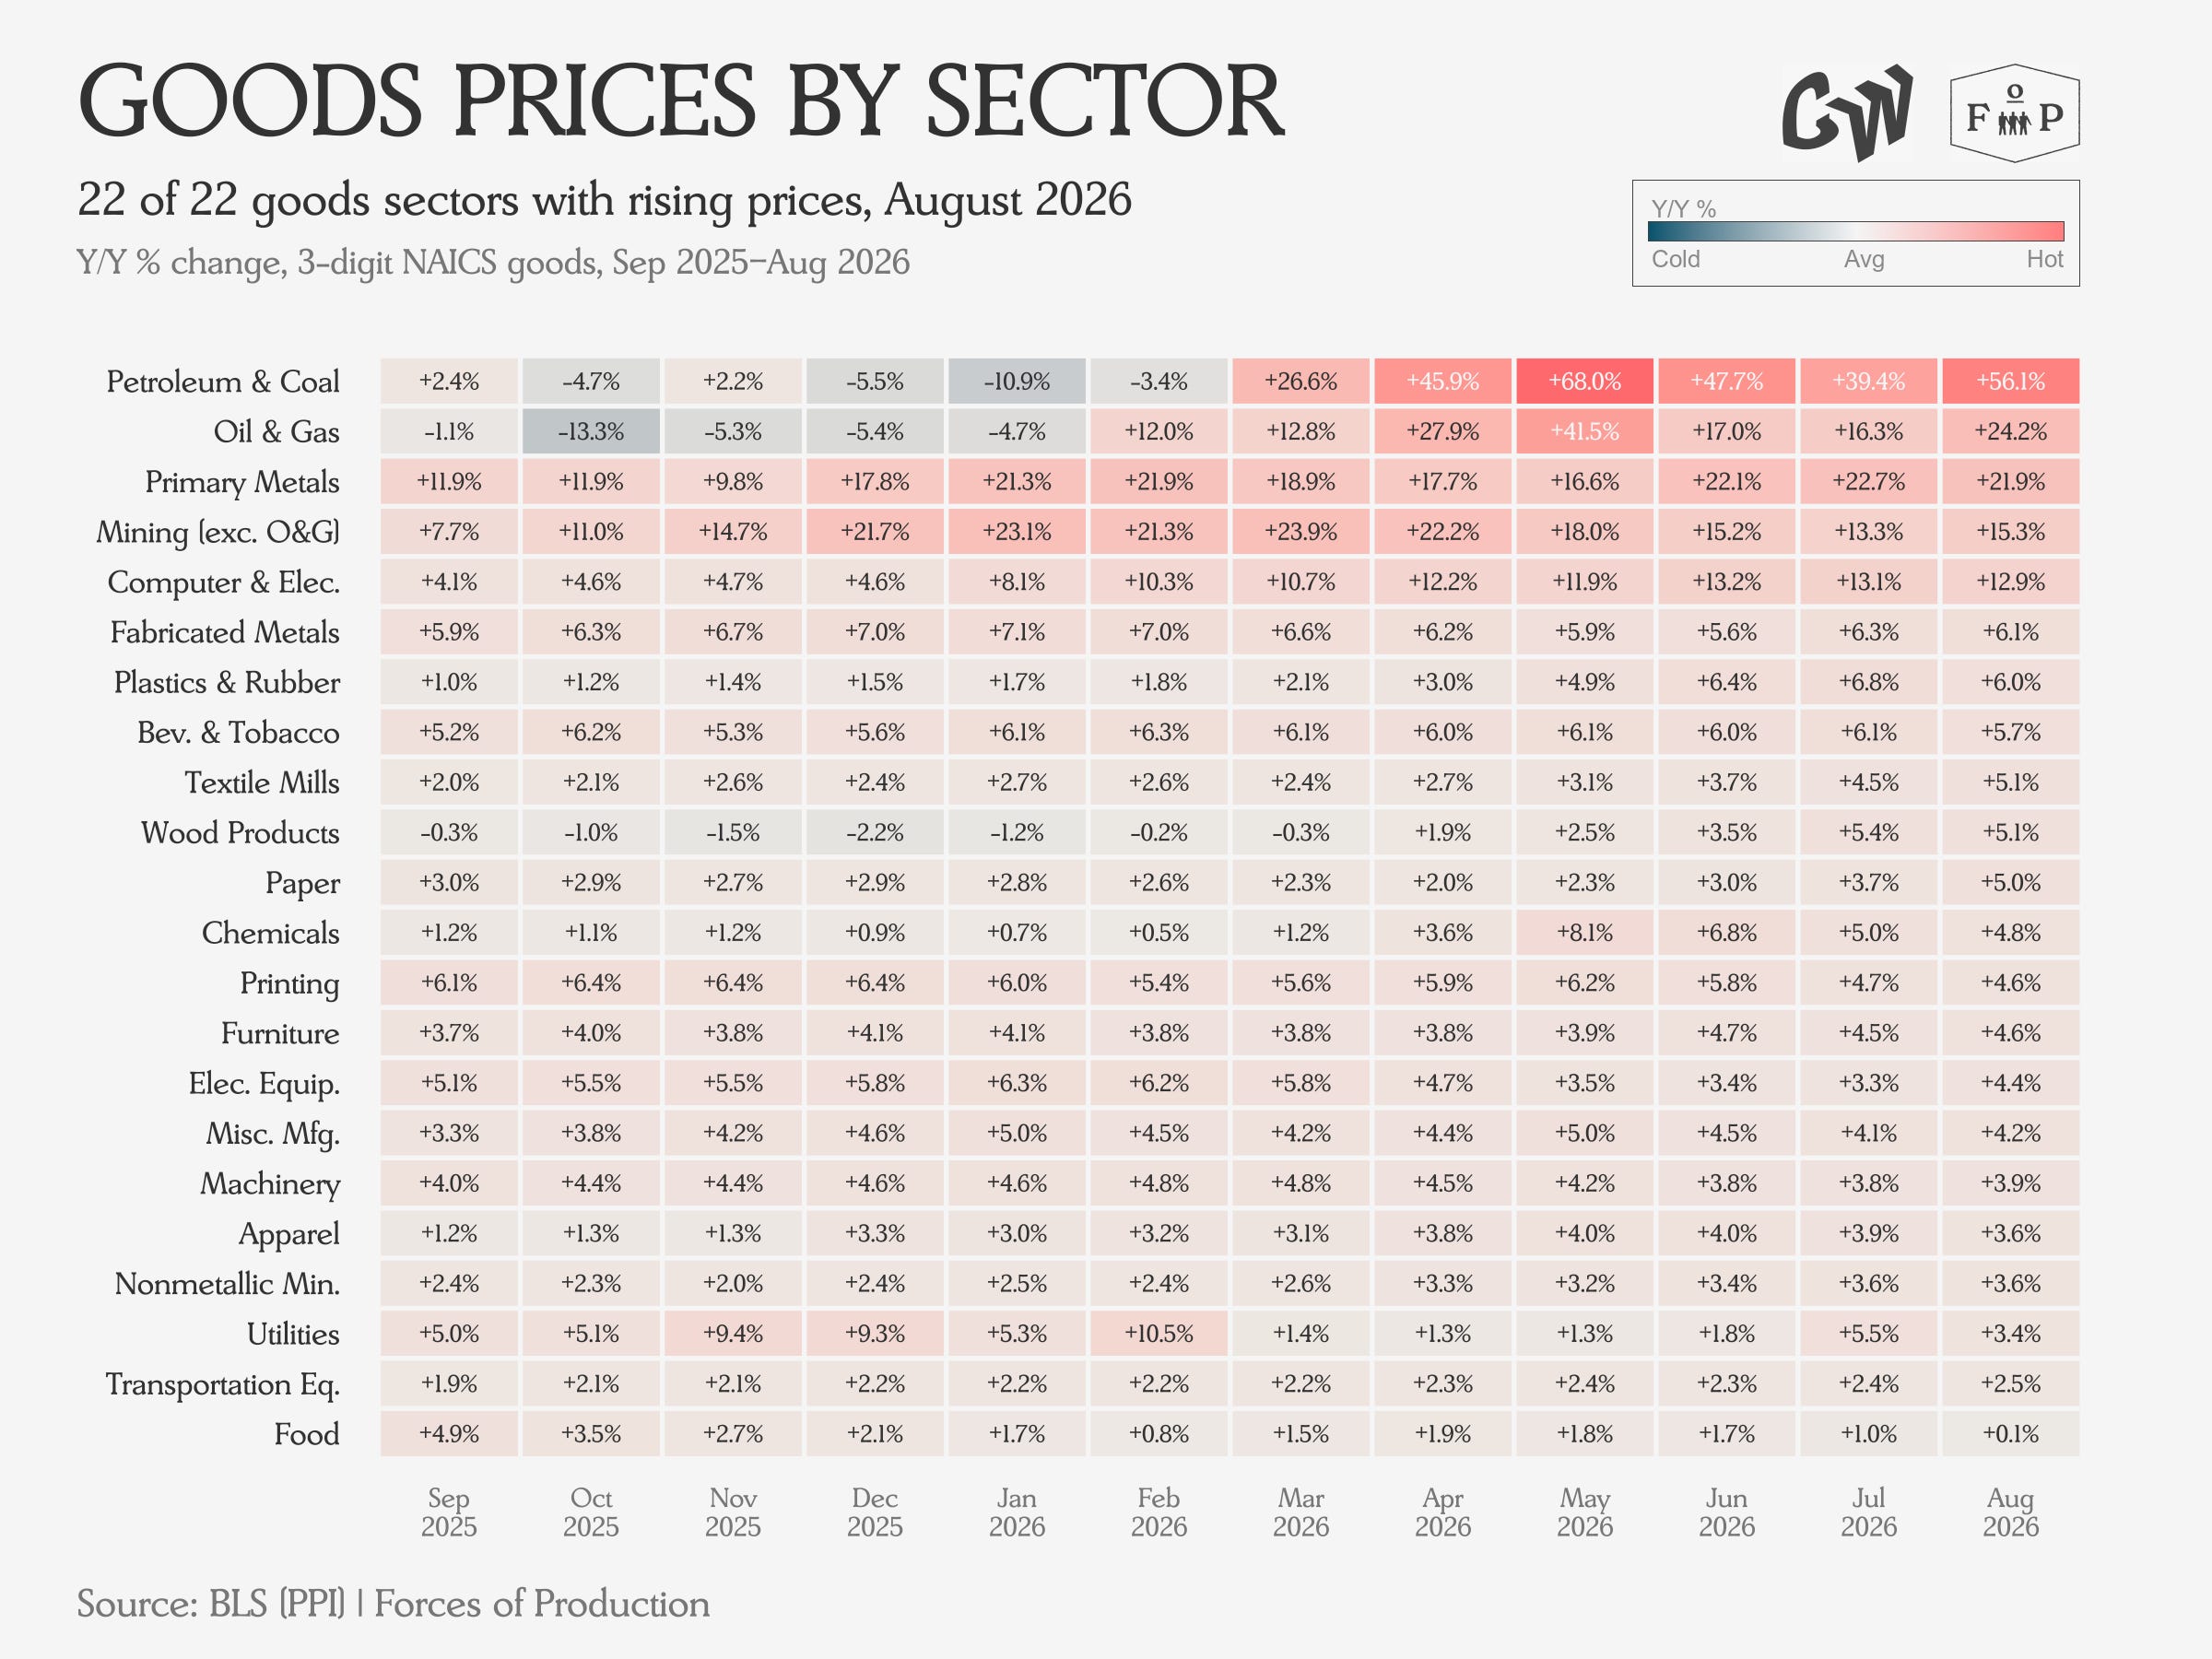
Producer Price Inflation on the Goods side remains concentrated among the fossil fuel complex, and in energy-intensive industries like Primary Metals and Fabricated Metals, which are also impacted by rising mining costs. Computer and Electronic Products has also seen more than six consecutive months with double-digit year-over-year percentage price increases.
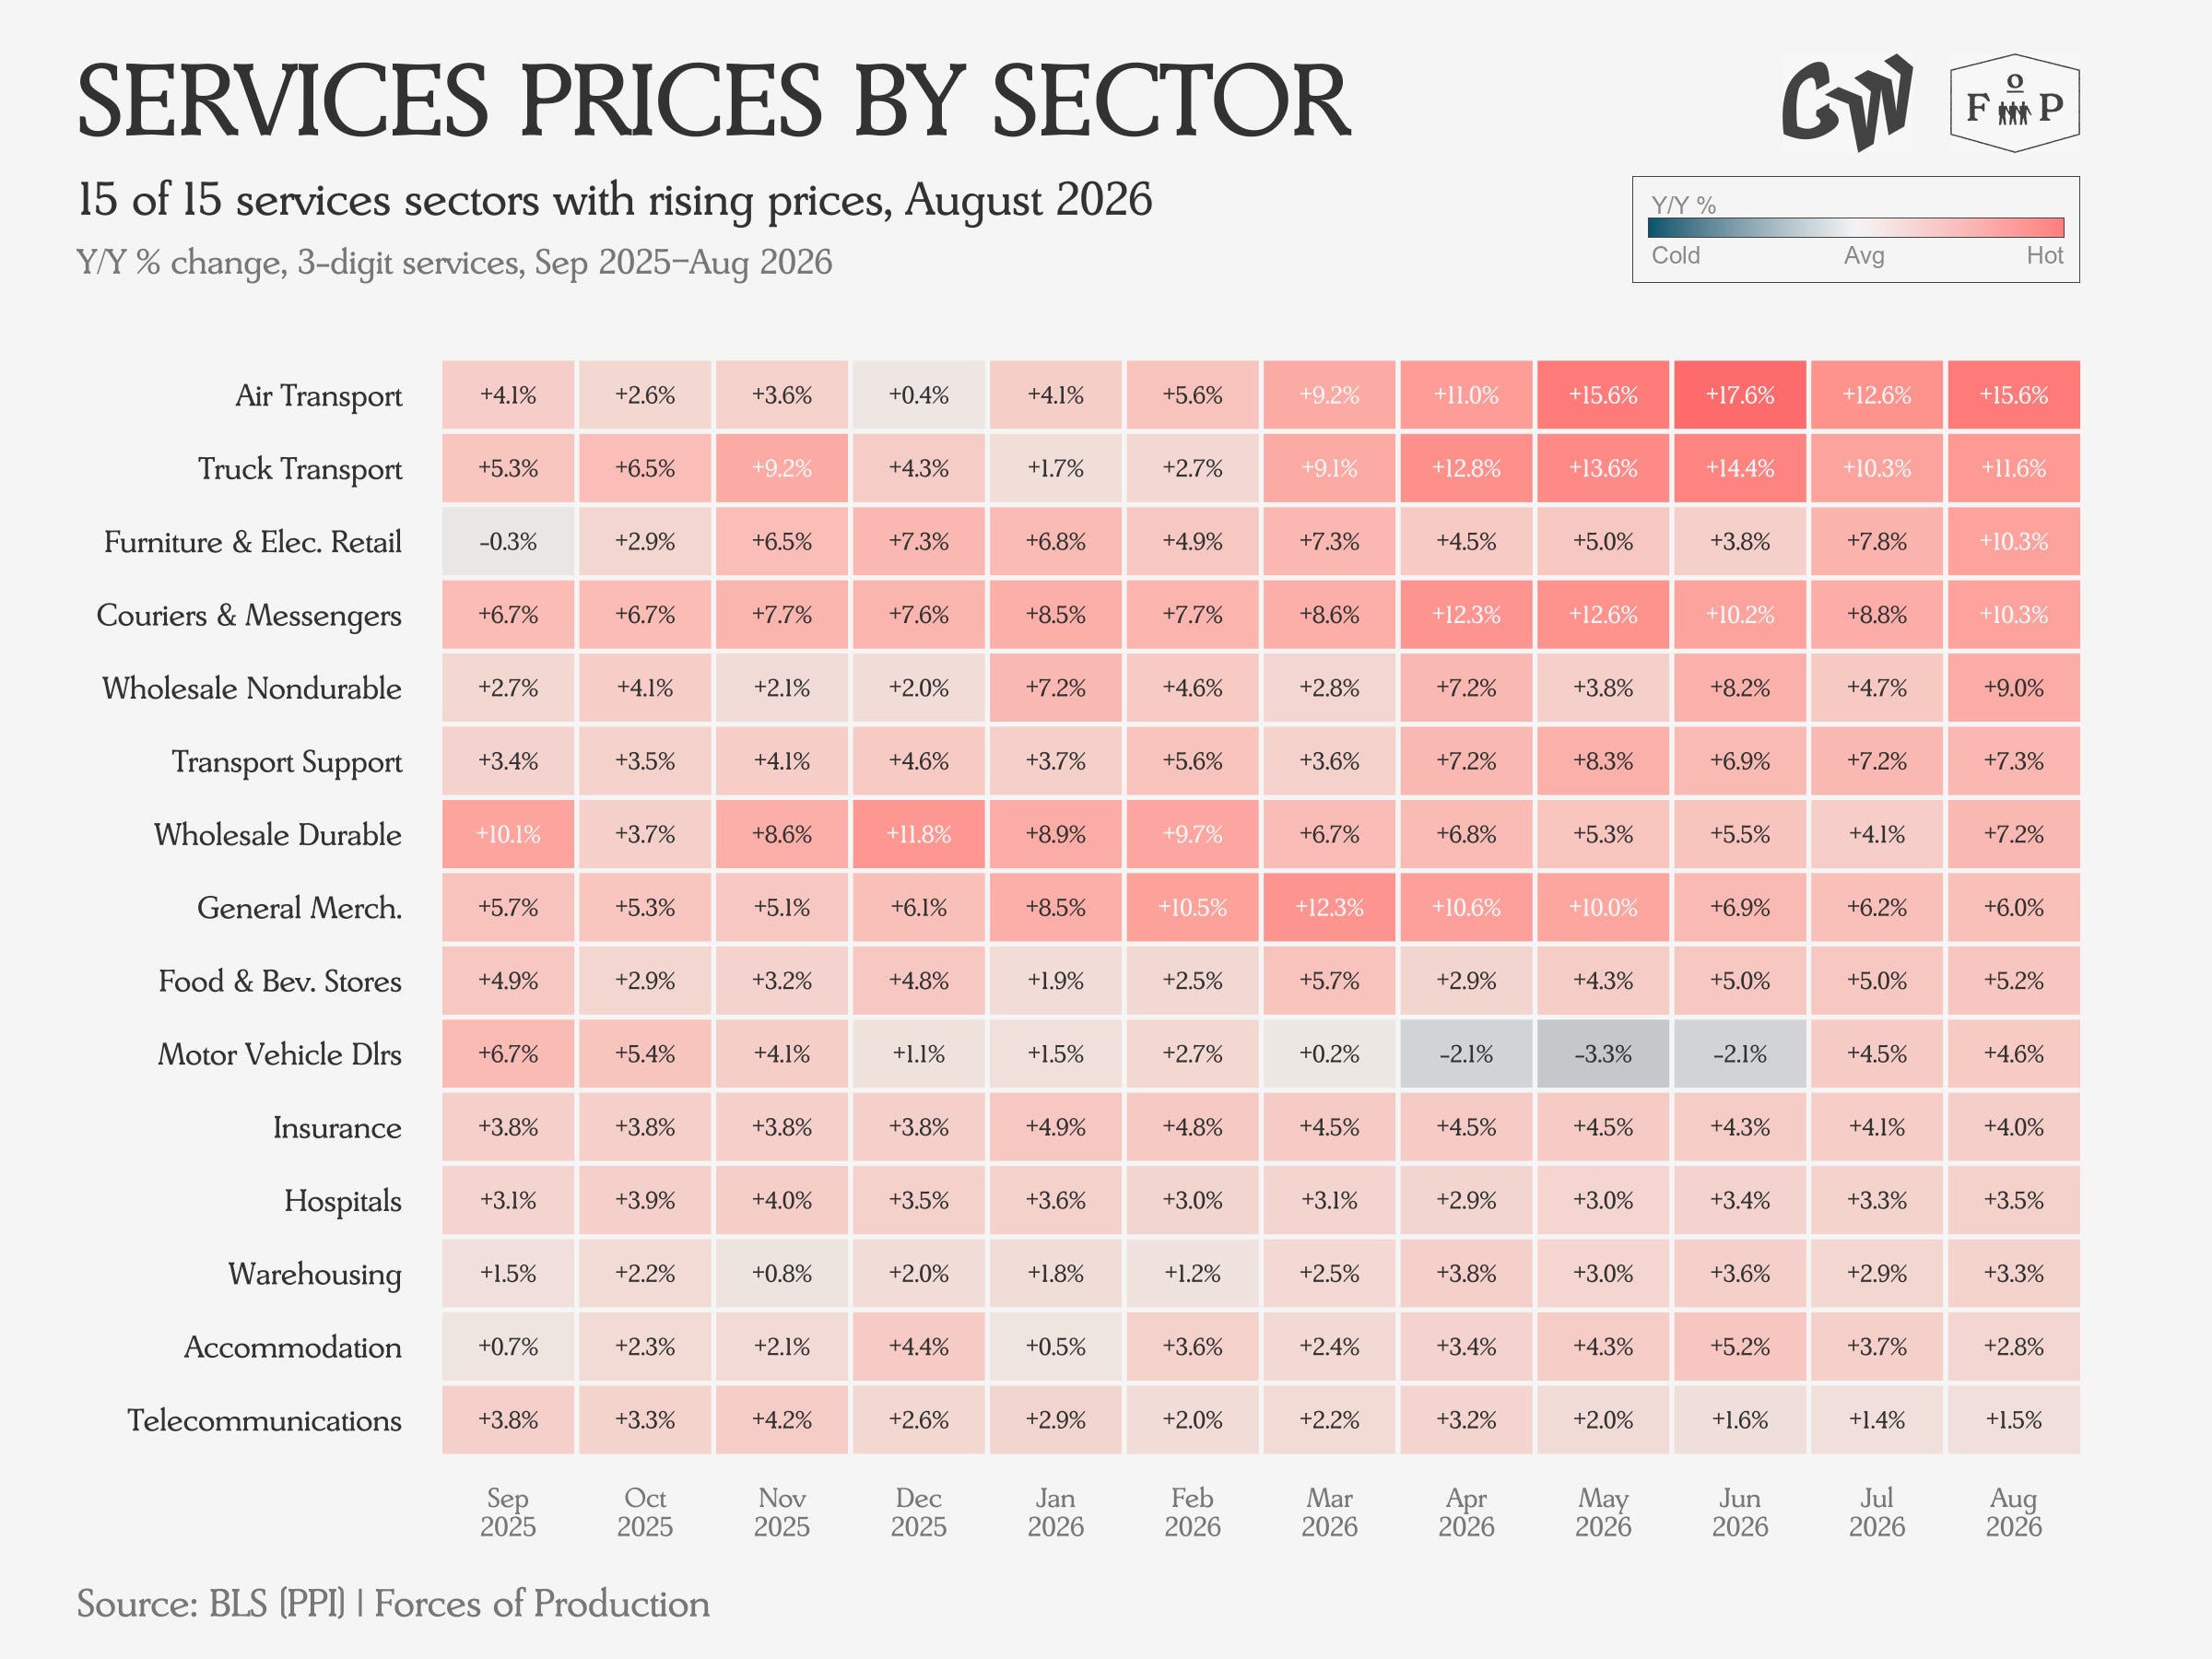
Increases in Services costs are likewise driven by energy price increases, and are showing up in Air Transport, Truck Transport and Couriers and Messengers — all sectors dependent on the cost of fuel.
Industrial Production & Capacity
Topline industrial production remained unchanged in August, following a 0.2 percent gain in July. Utilities jumped 1.8 percent while manufacturing fell 0.3 percent, posting its first decline of 2026 despite forecasts showing continued growth. Capacity utilization held at 76.3 percent, 3.1 points below its long-run average. Despite this, the Business Equipment aggregate is up seven percent, suggesting some capital investment impulses are moving up the production chain.
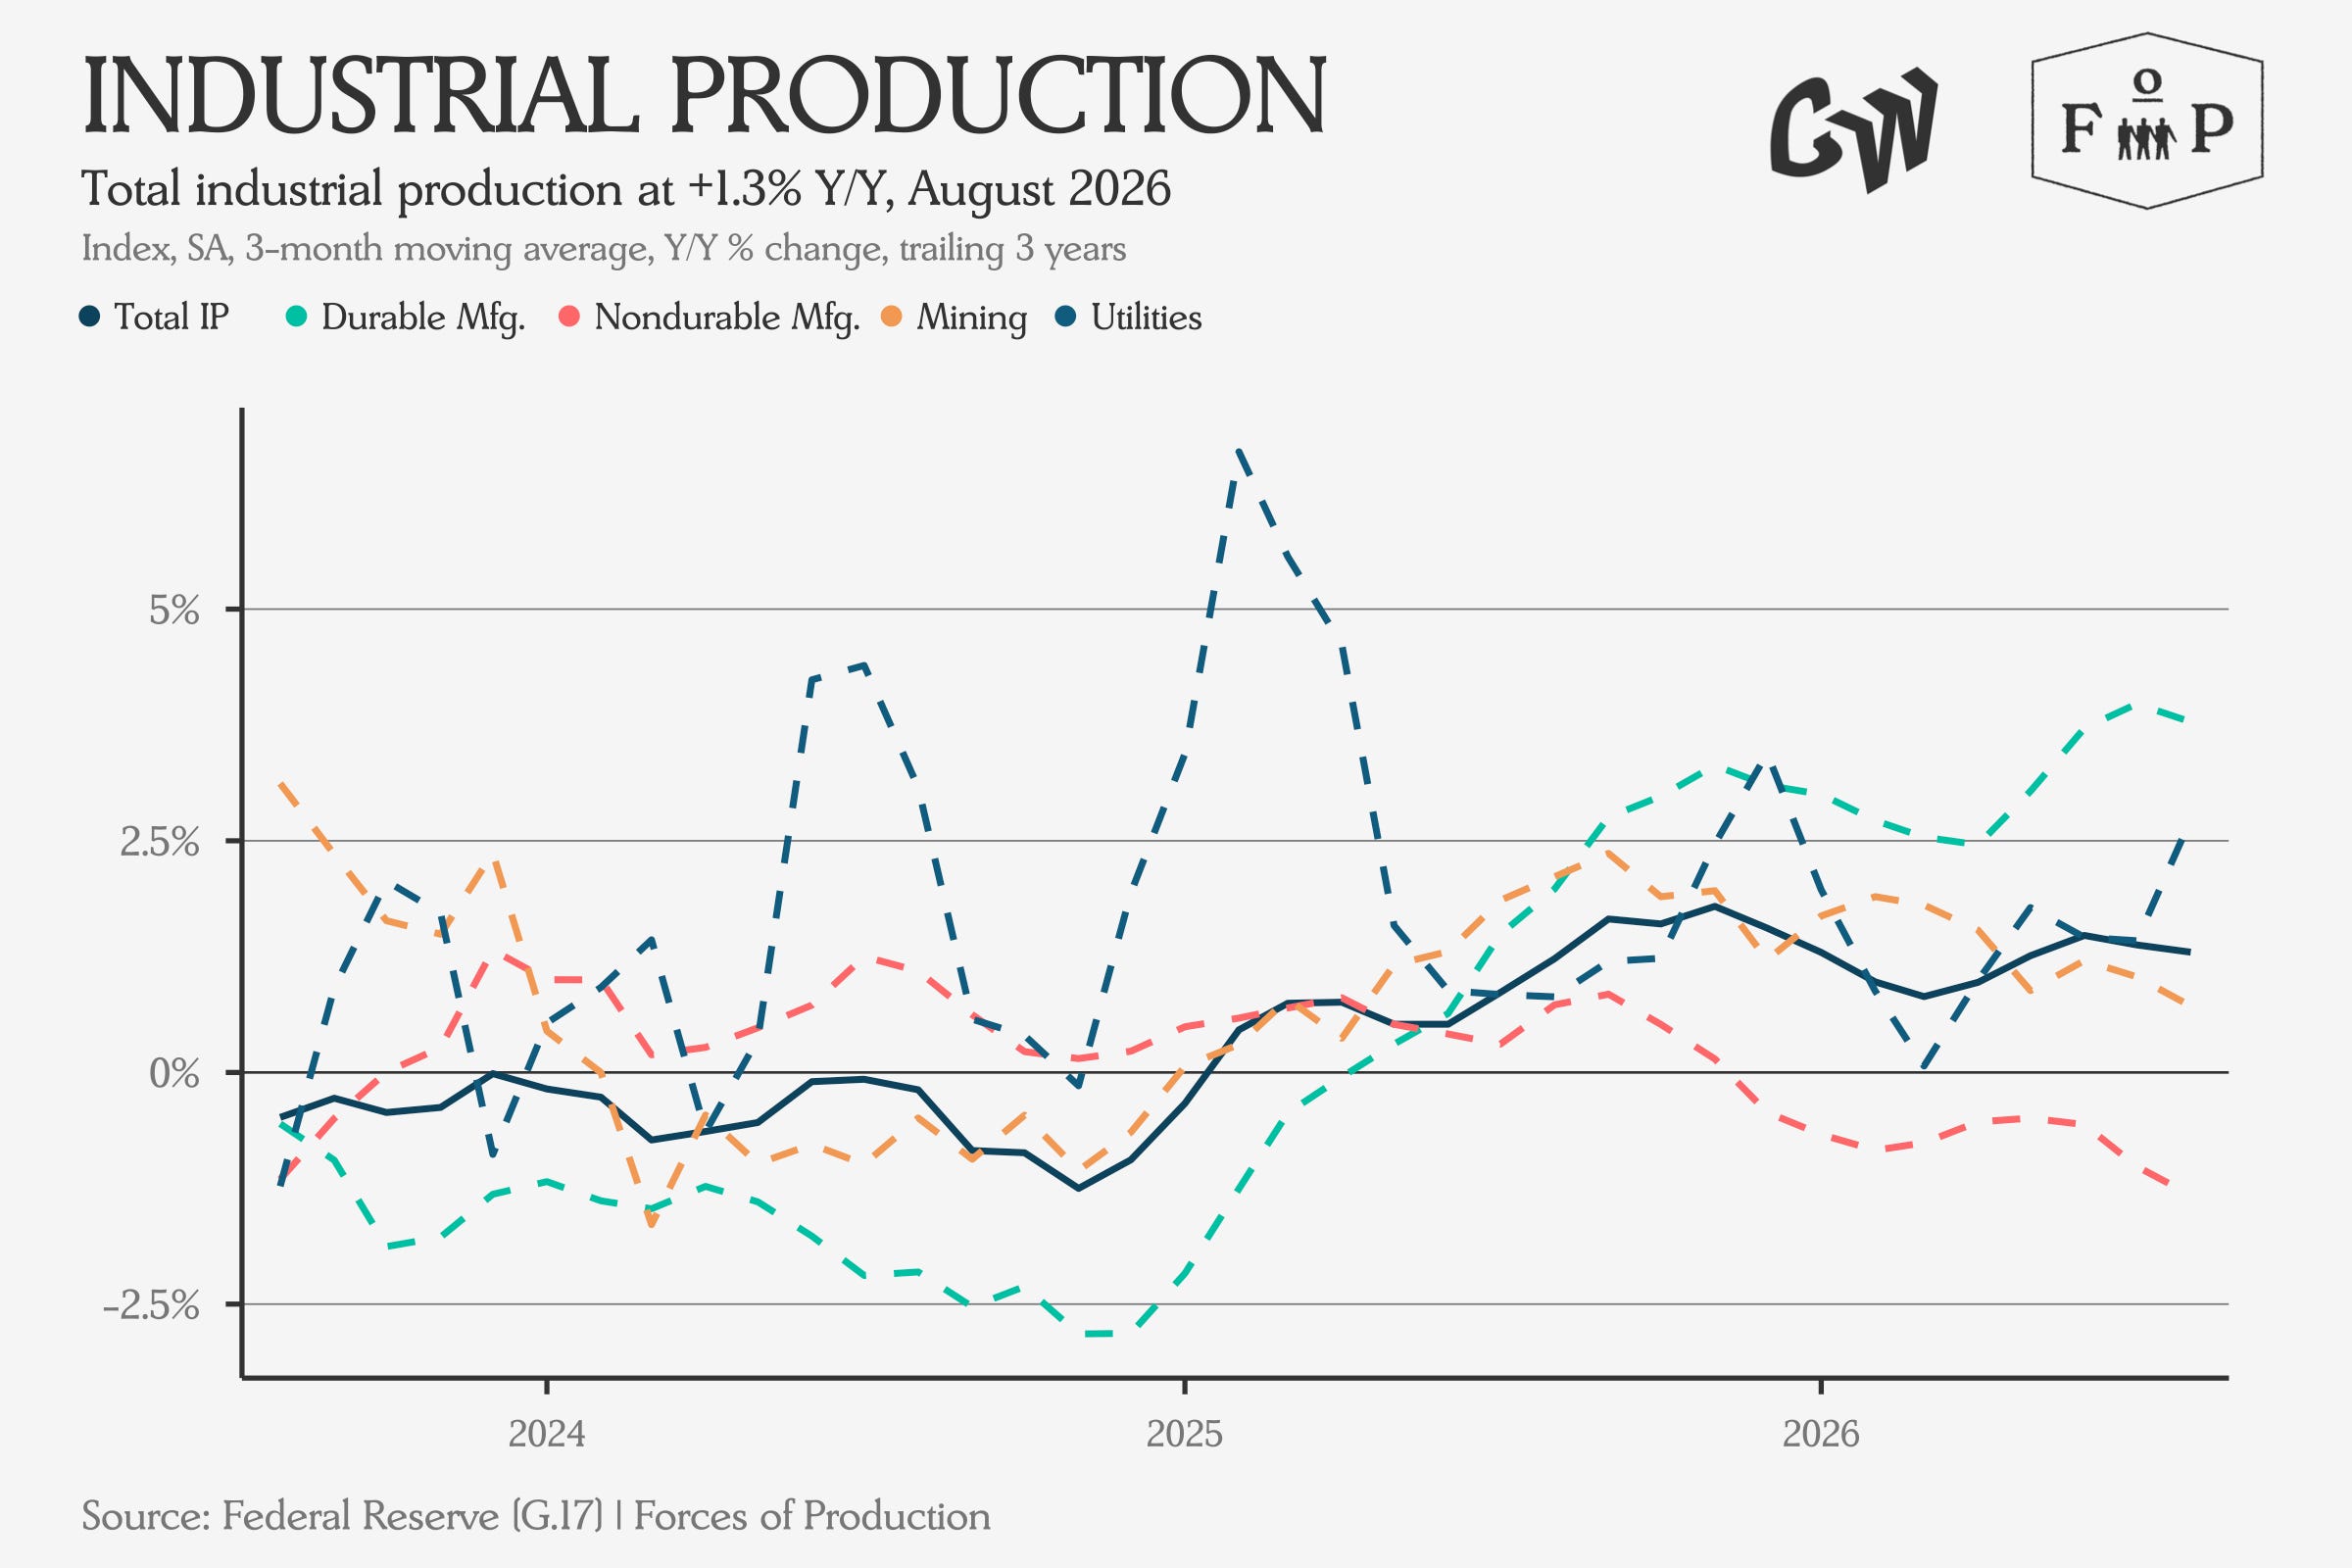
Durable Manufacturing posted the strongest growth, with Nondurable Manufacturing continuing its slide.
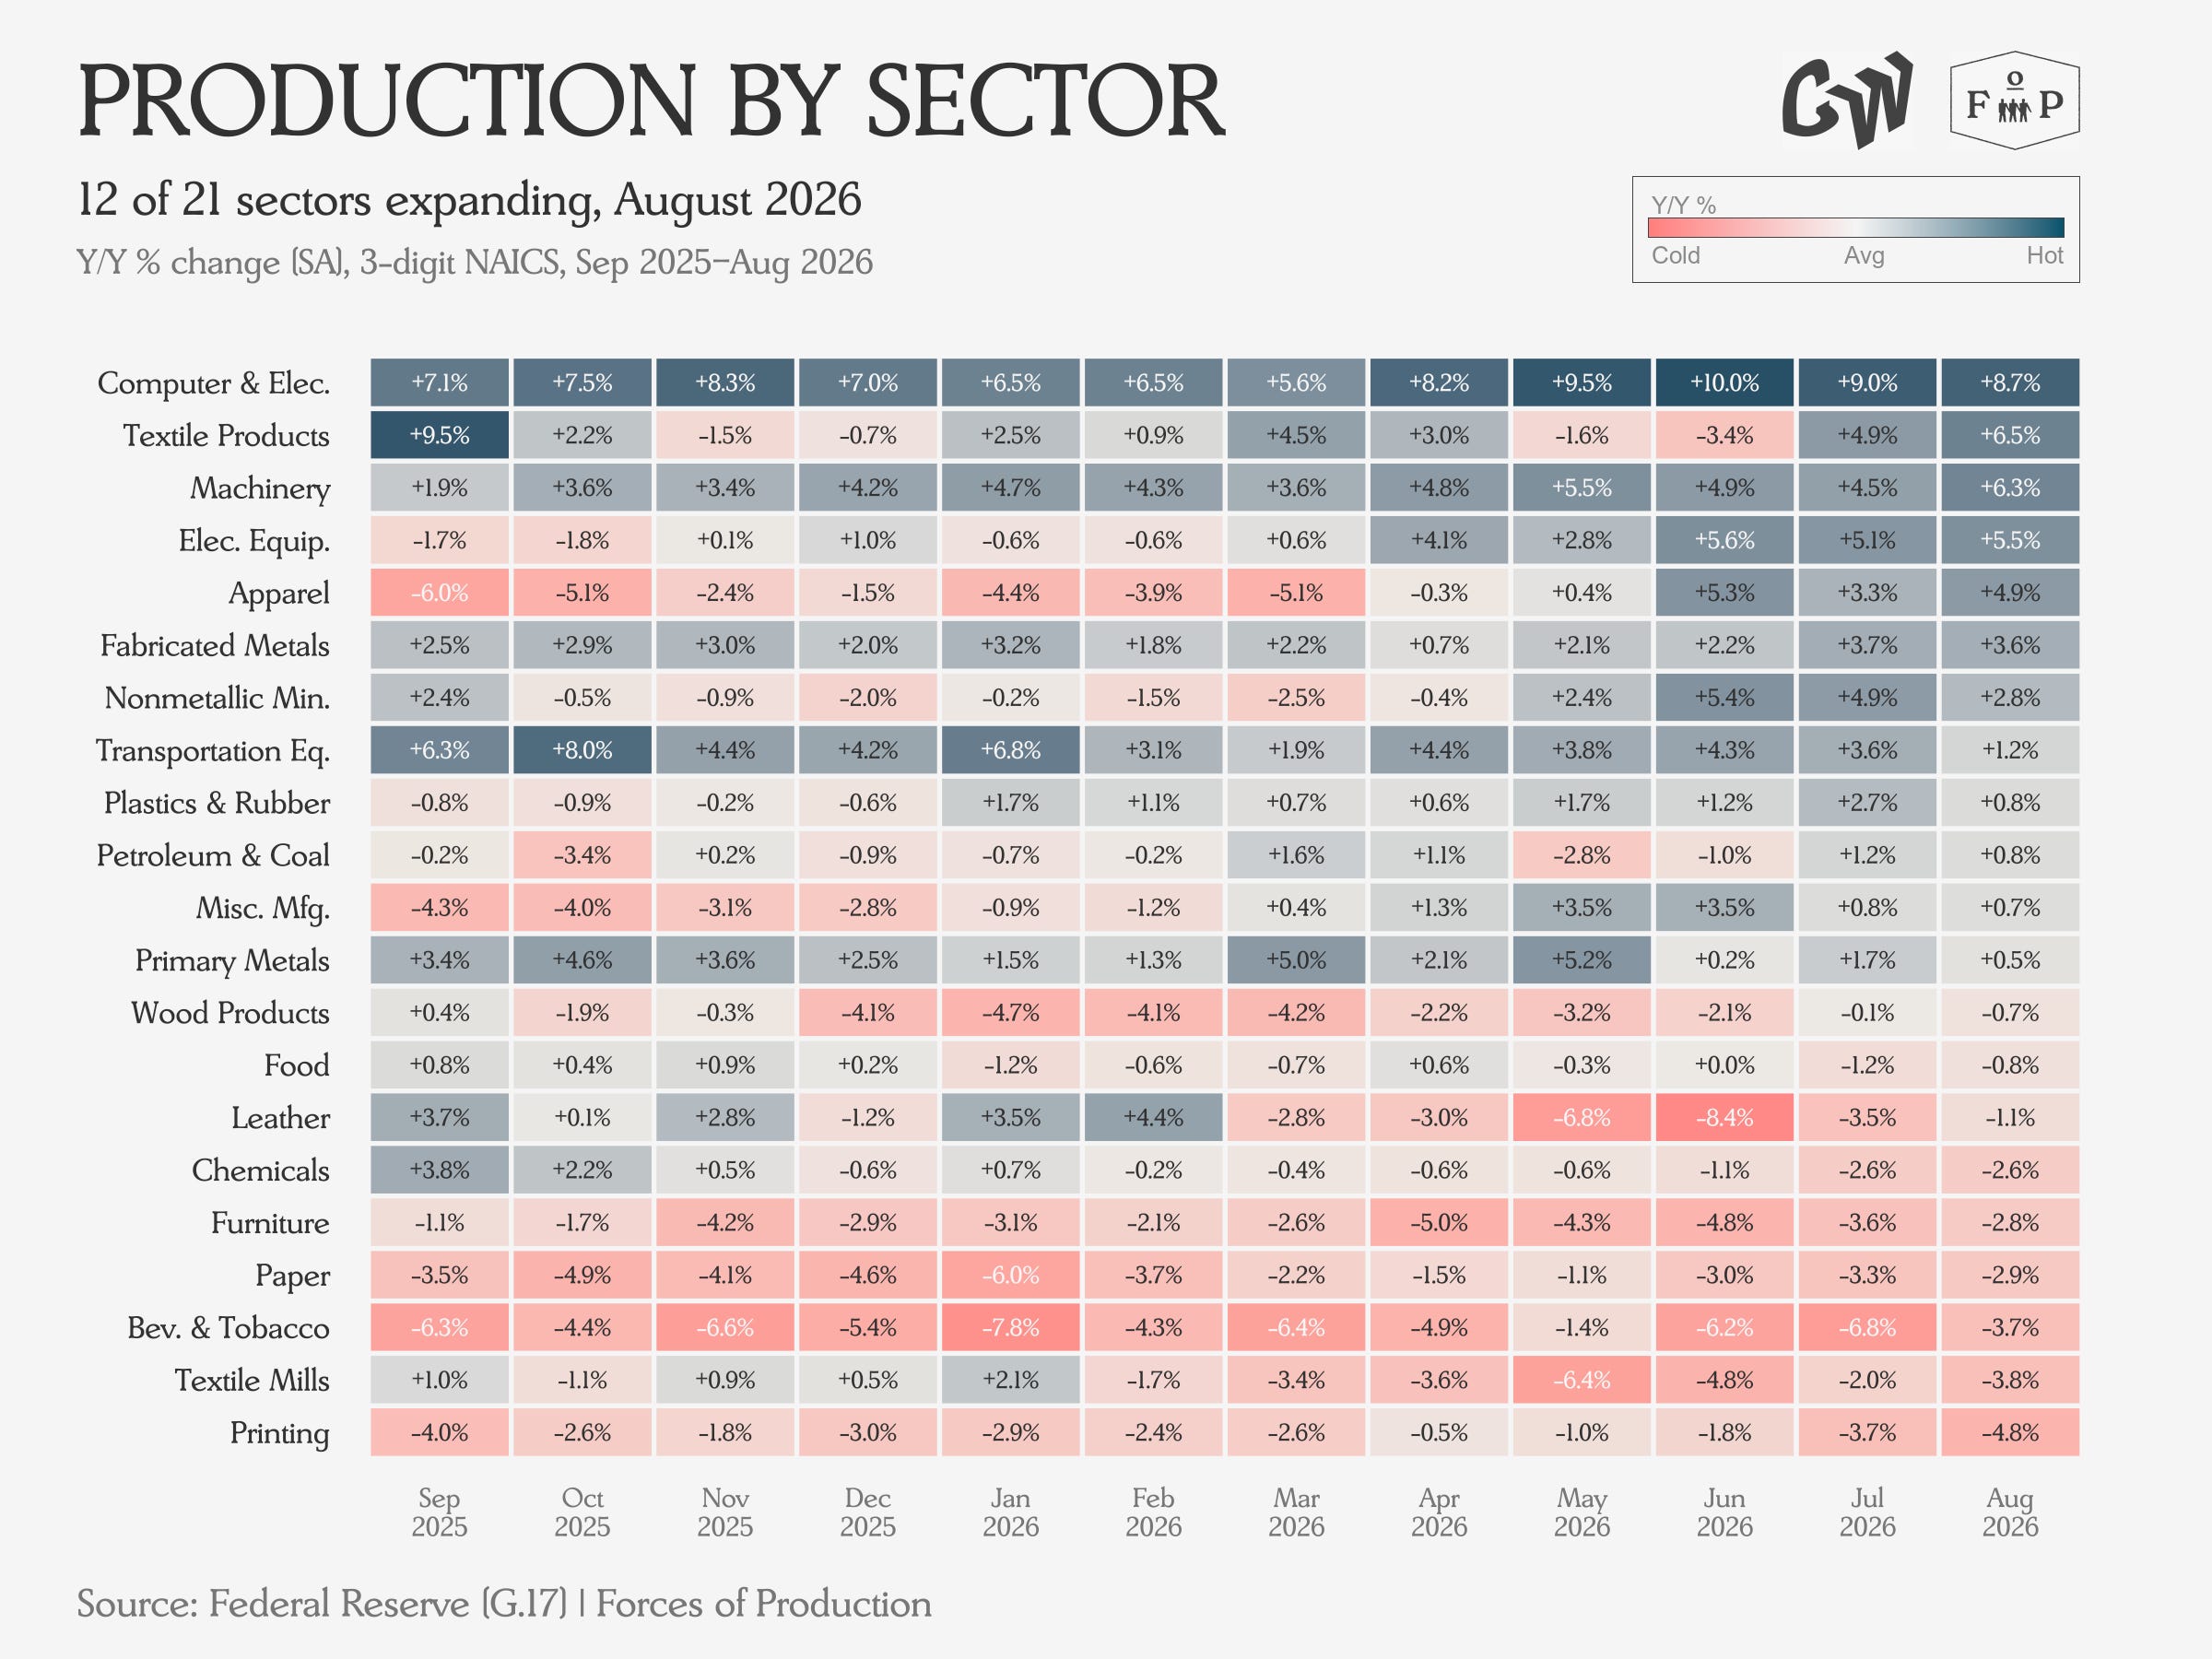
Computer and Electronic Equipment production continues to surge, while Machinery and Electrical Equipment post steady growth. Chemicals production is down noticeably compared to the previous year in the July and August readings.
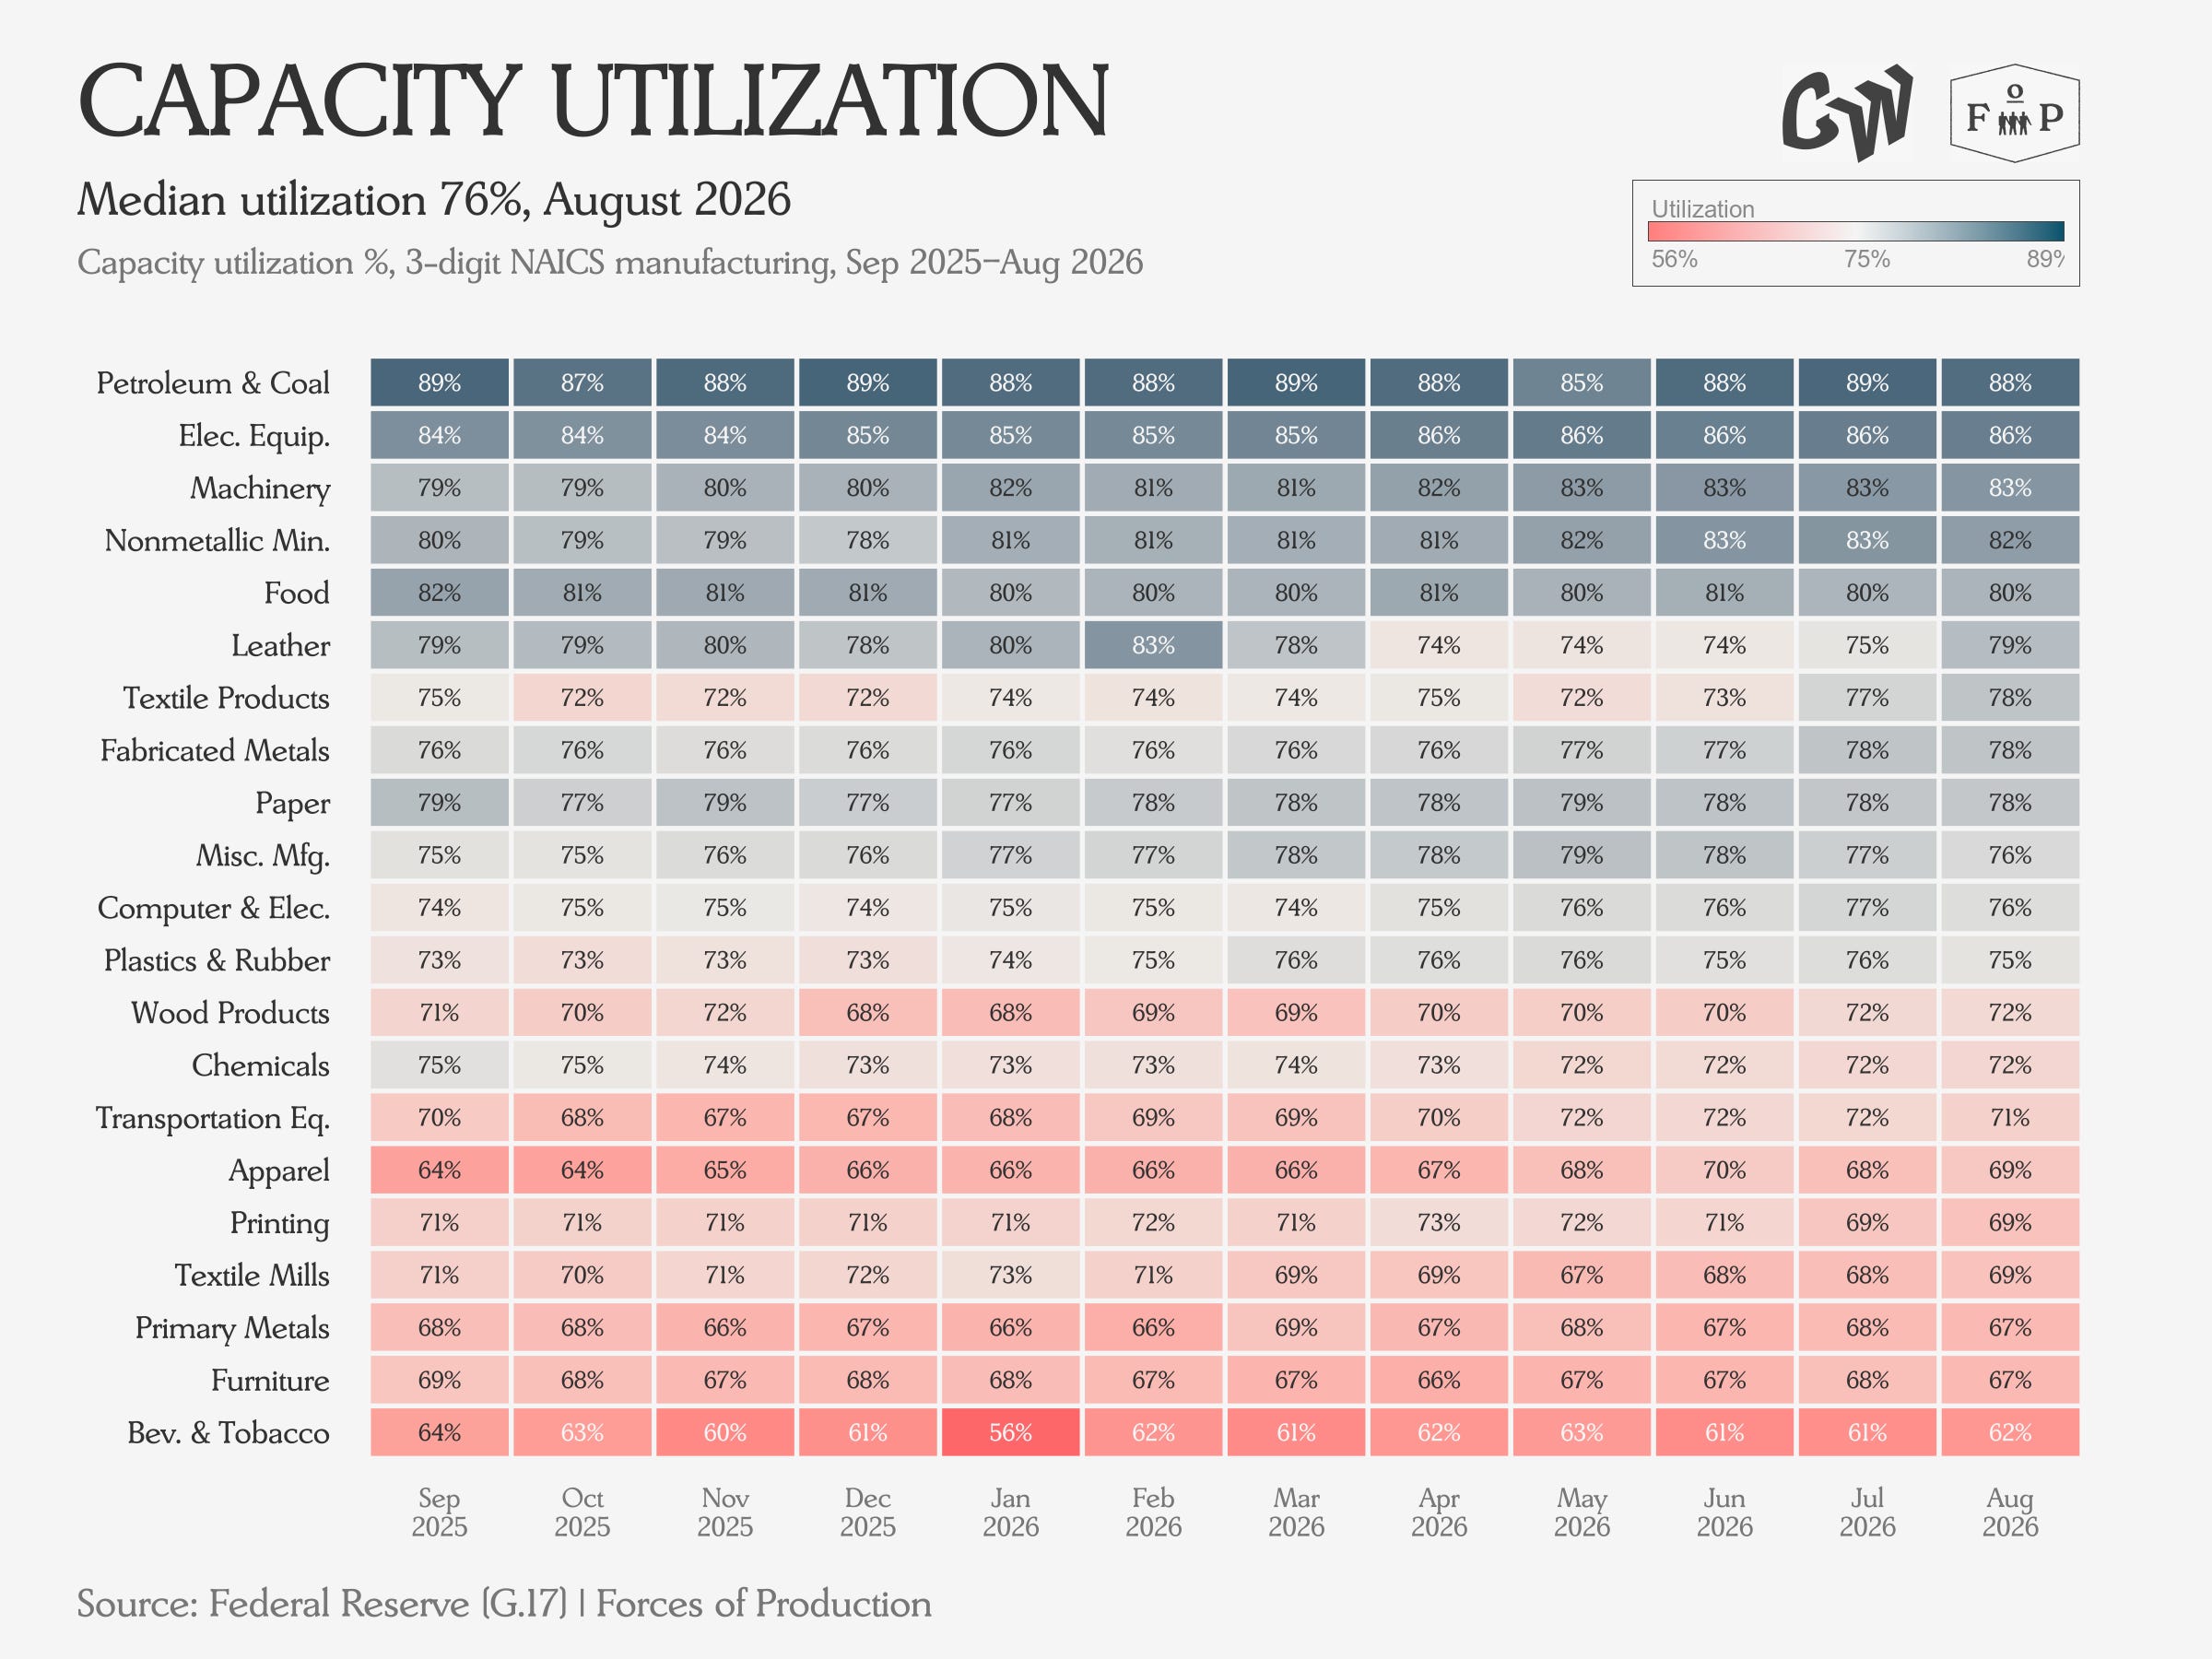
Capacity utilization remained unchanged for most sectors, with a few notching single percentage point declines.
International Trade
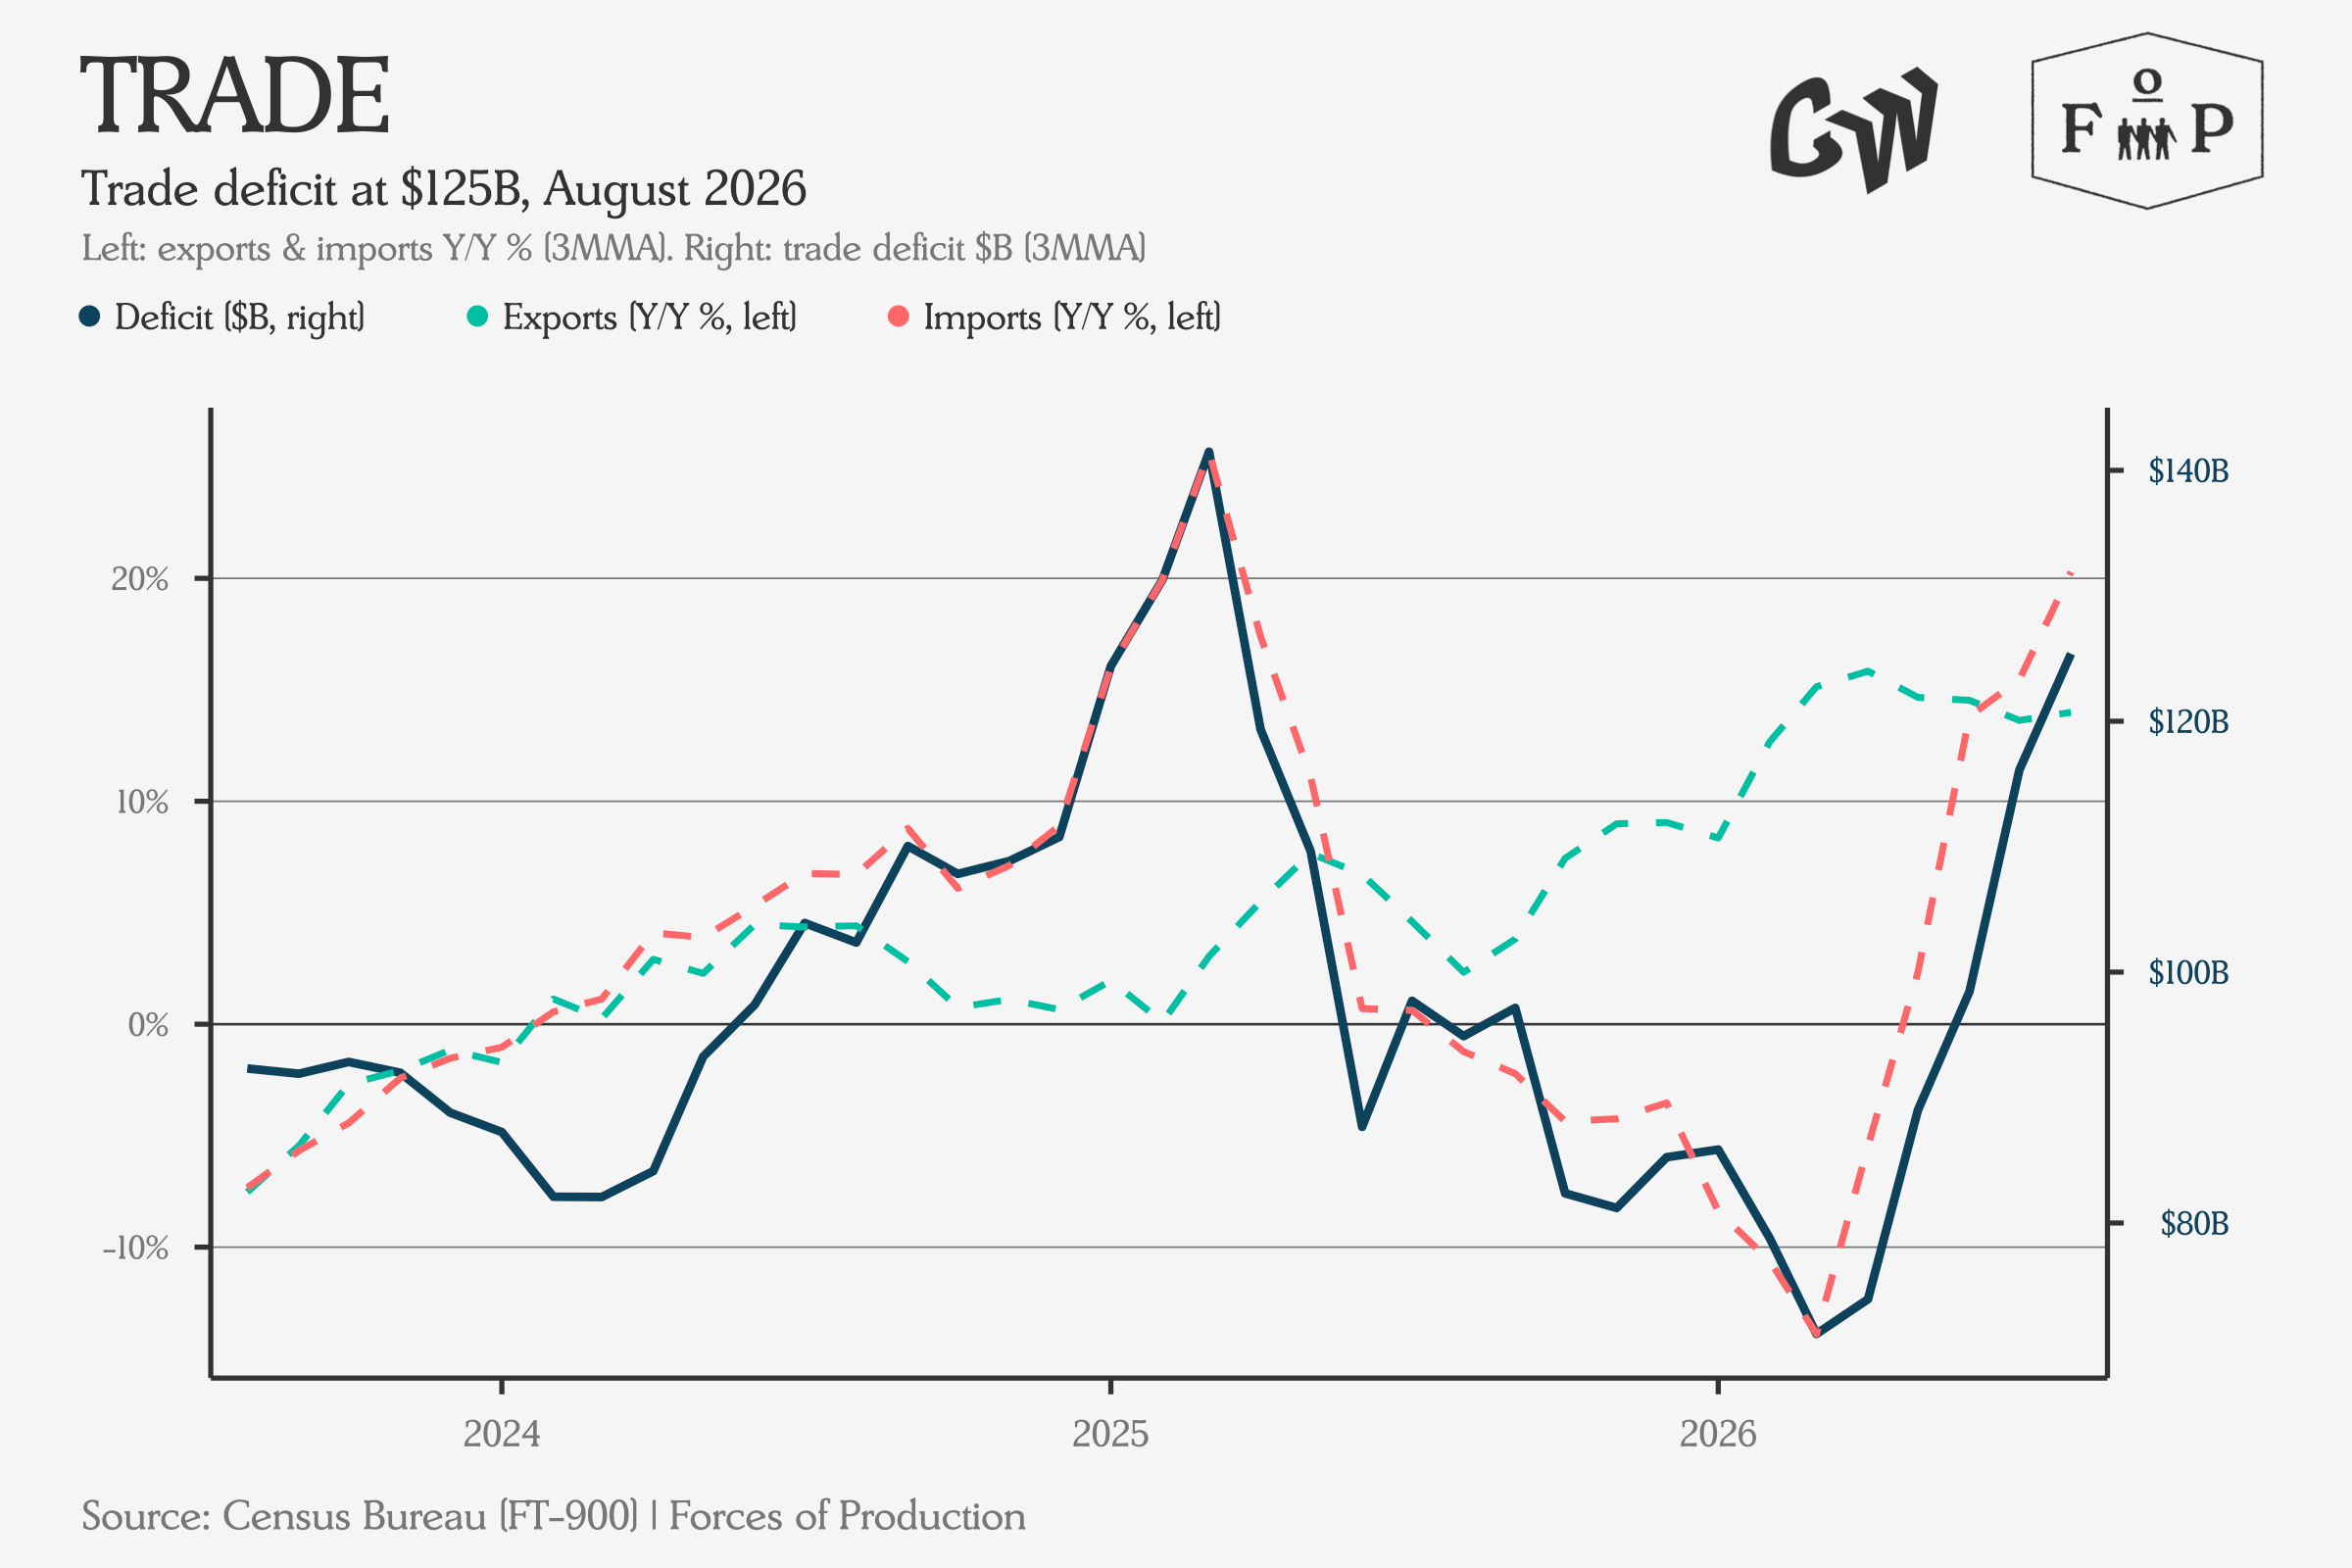
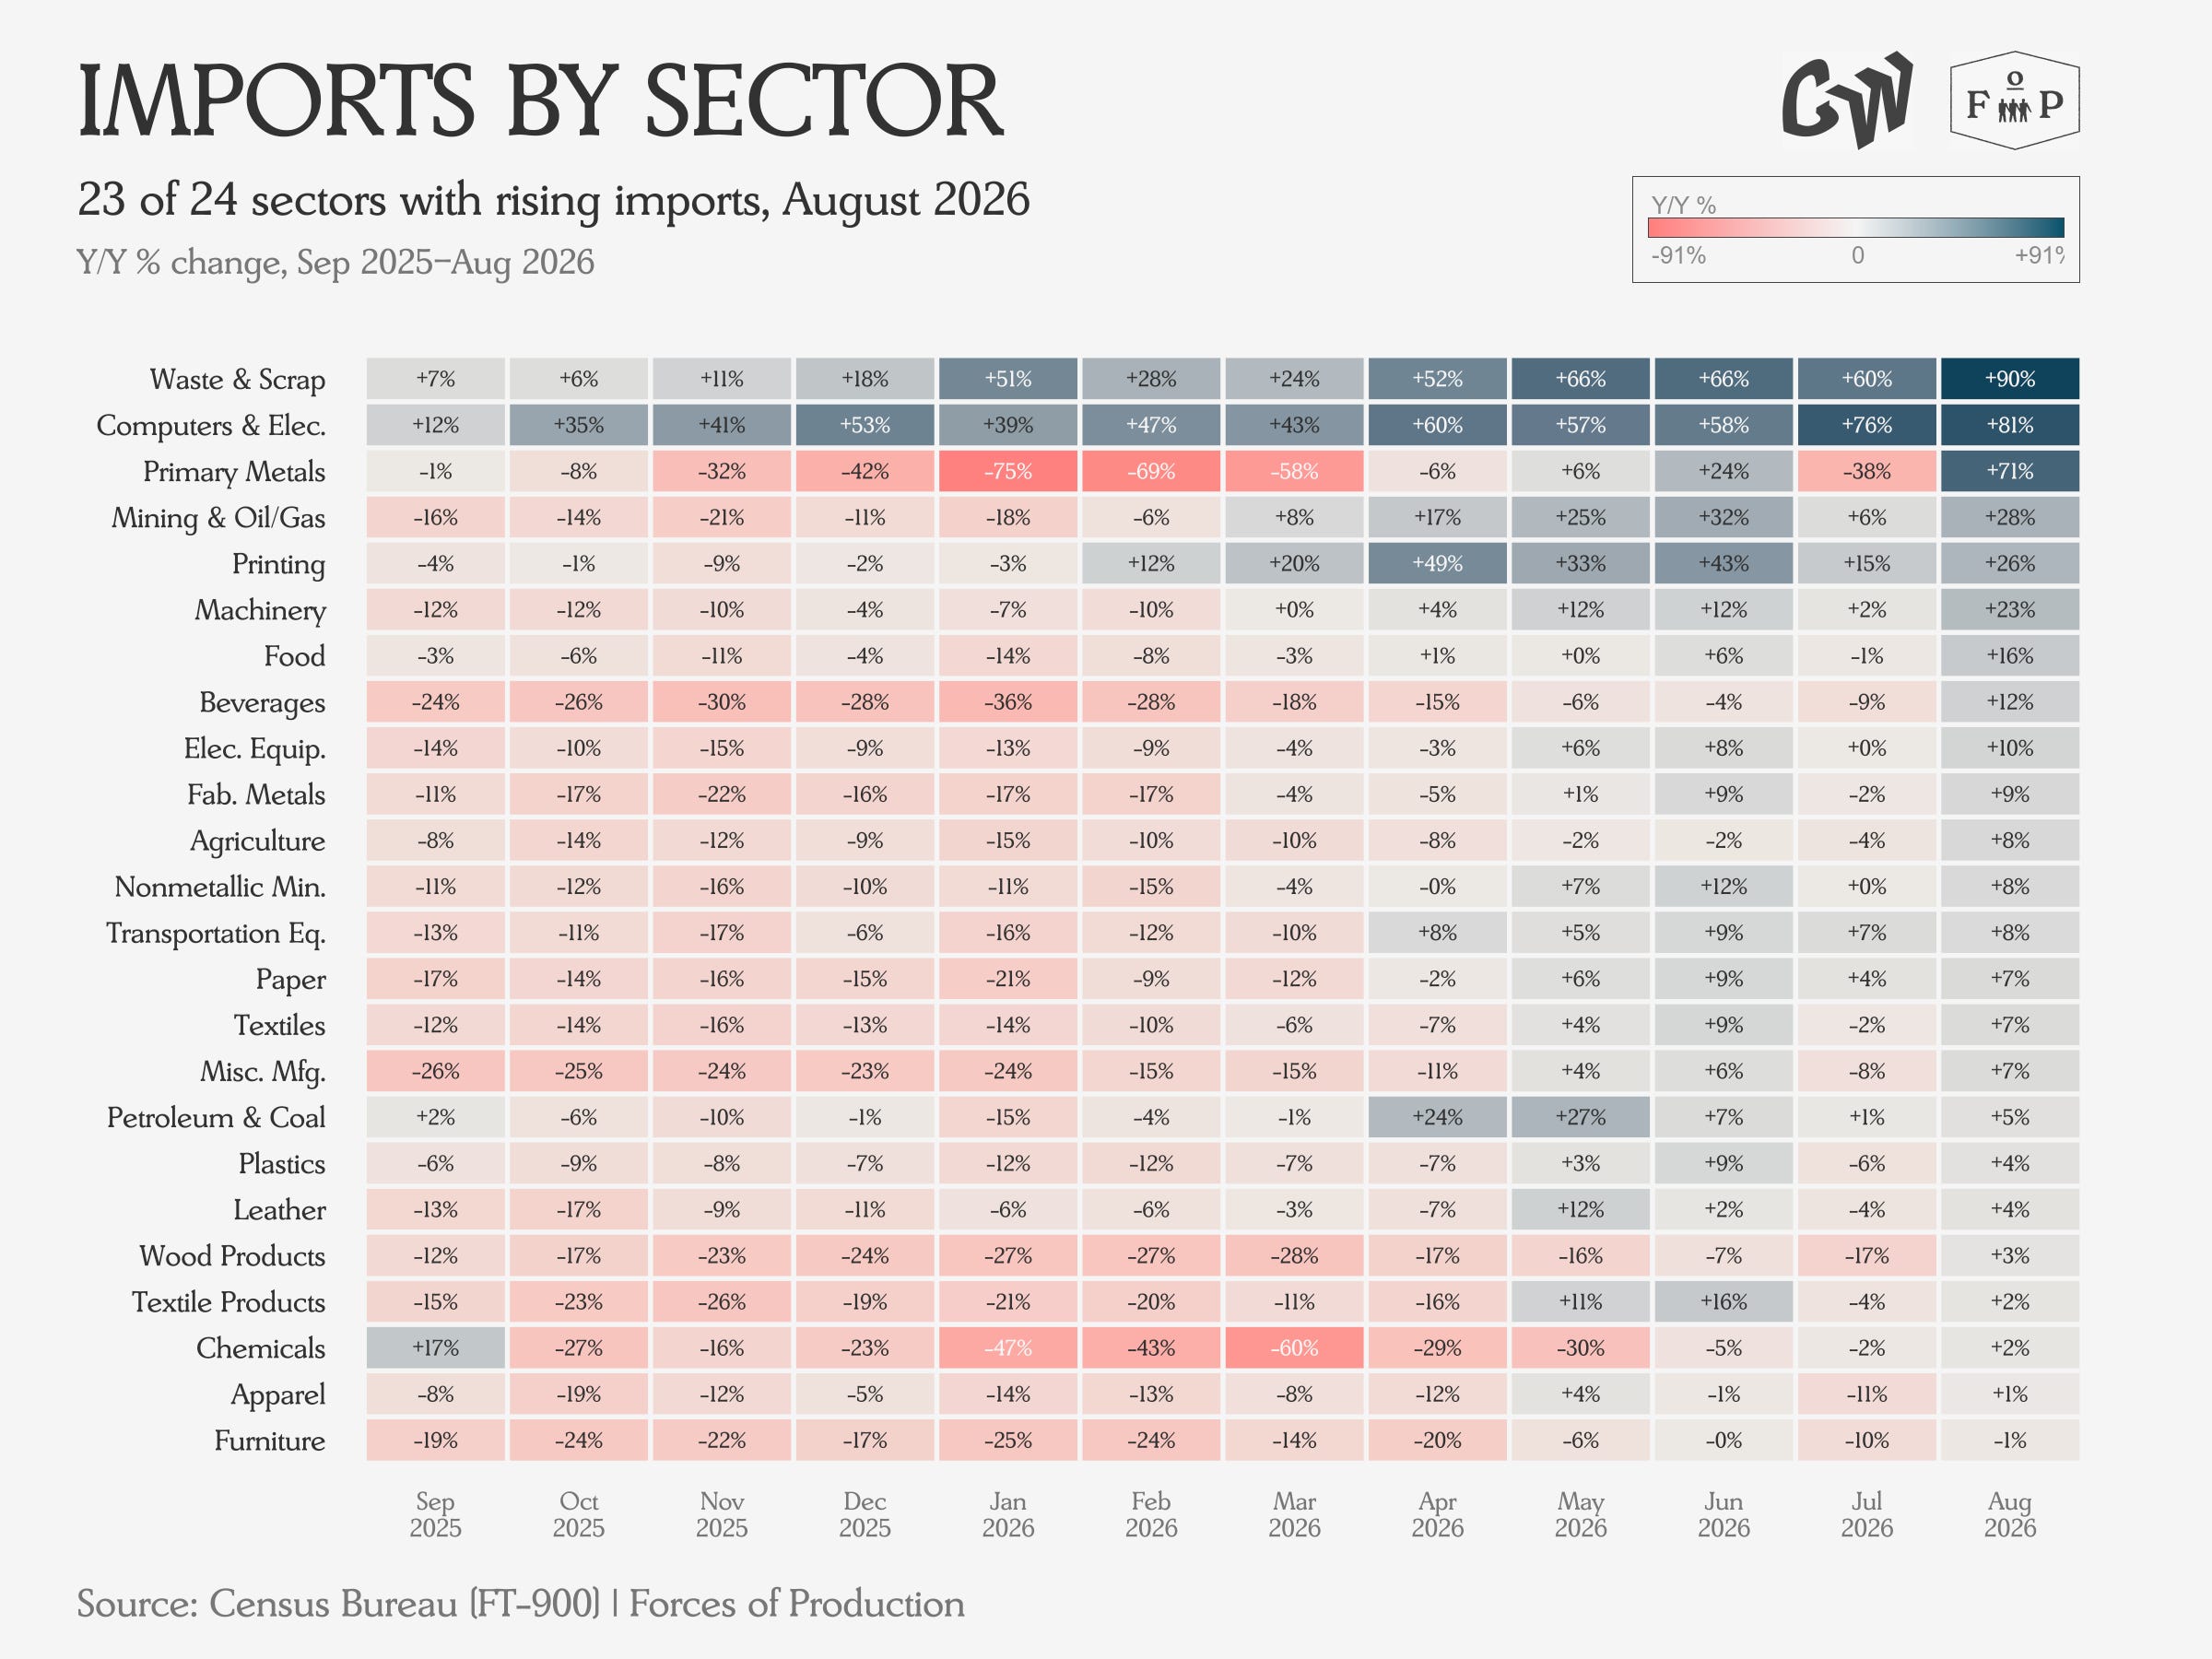
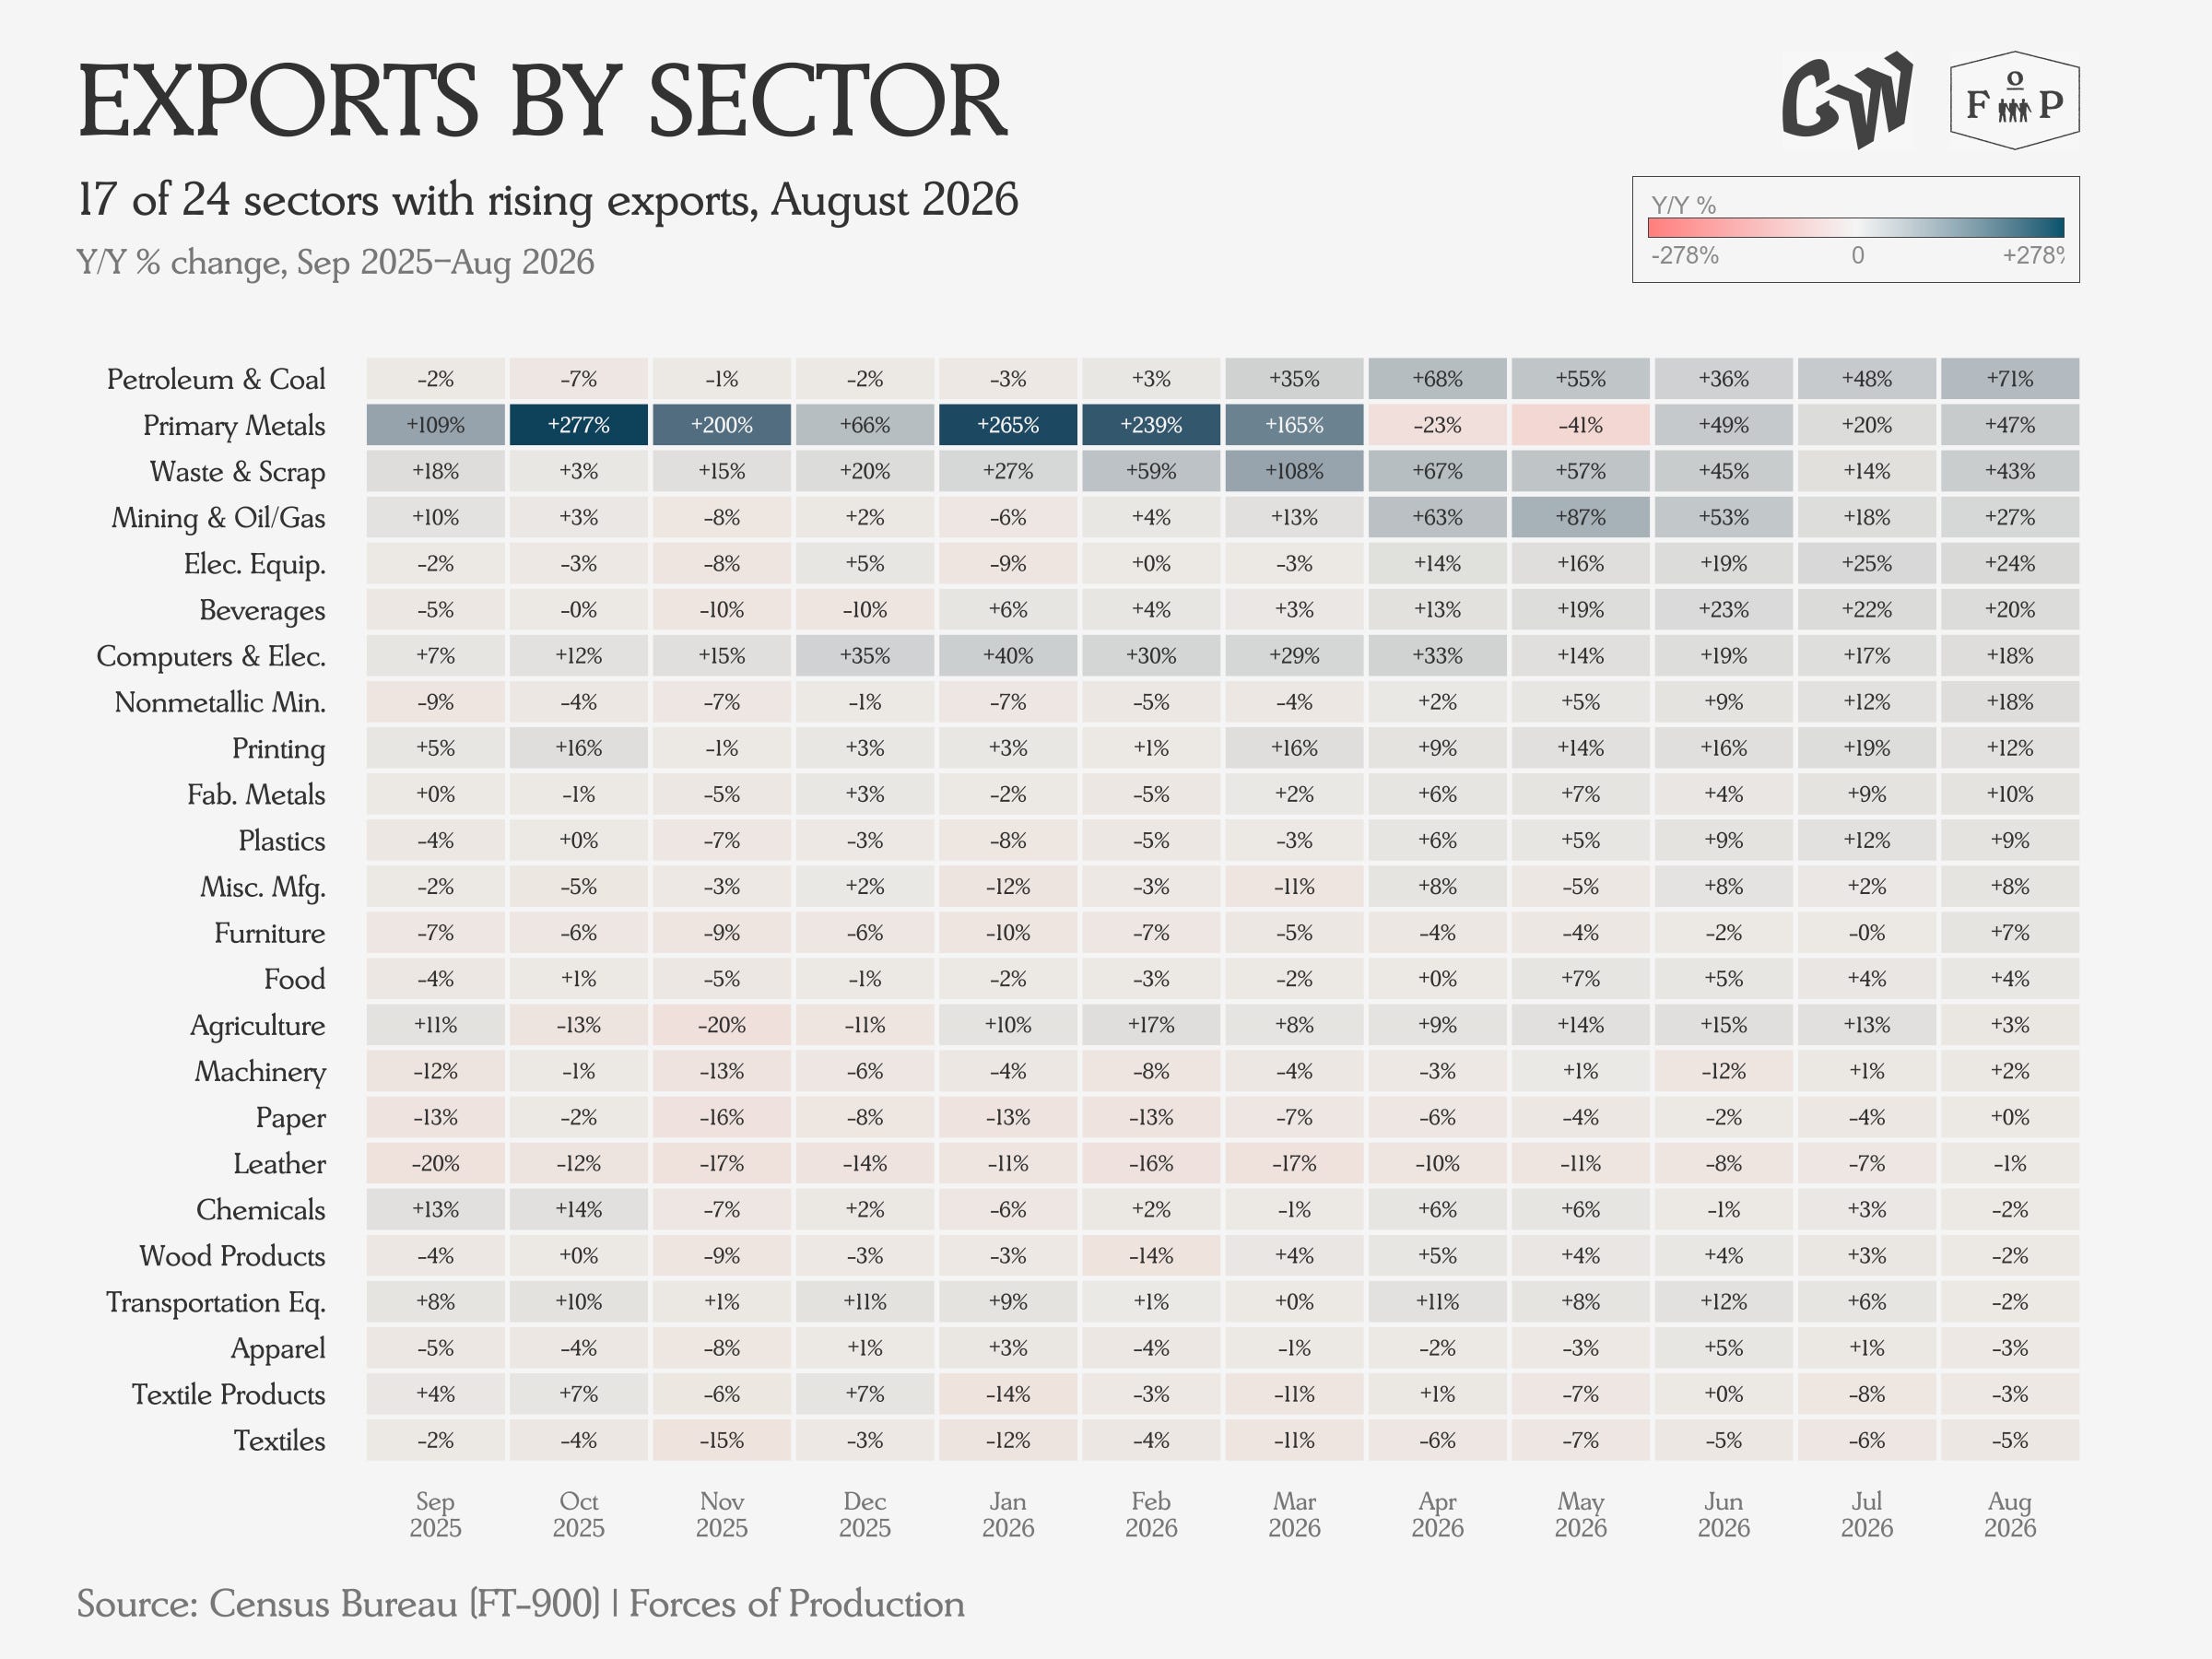
The trade deficit widened to $105.6 billion in August from $92.8 billion in July, with imports rising by $17.2 billion while exports increased by $4.5 billion, leading many to expect trade will be a drag on Q3 GDP.