


Hello and welcome to this month’s edition of Forces of Production, a short one about summer vacation for August after last month’s lengthy manifesto. If you haven’t read it yet, check it out.
Unlike Blake’s “dark satanic mills” which will seemingly always haunt our green & pleasant planet, belching black smoke and grinding away, workers have found at least one way to stop the actual forces of production sometimes: taking time off. As the original and most basic force of production, one of the original and most basic demands of the labor movement has been for the weekend, for a shorter working day, and maybe even for a real vacation.
Around the world, the labor movement has seen different levels of success in making these demands, but the American situation remains striking: no paid vacation!
Even among those who have won the right to paid vacation in the struggle between capital and labor, almost half of US workers use less than their full allotment of paid vacation.
Despite this, the National Institutes for Health tout “The Superiority of Frequent Vacations for Well-Being and Performance”. So if workers have won paid vacation, and it improves their ability to work, any lack of vacation must be a question of power rather than production.
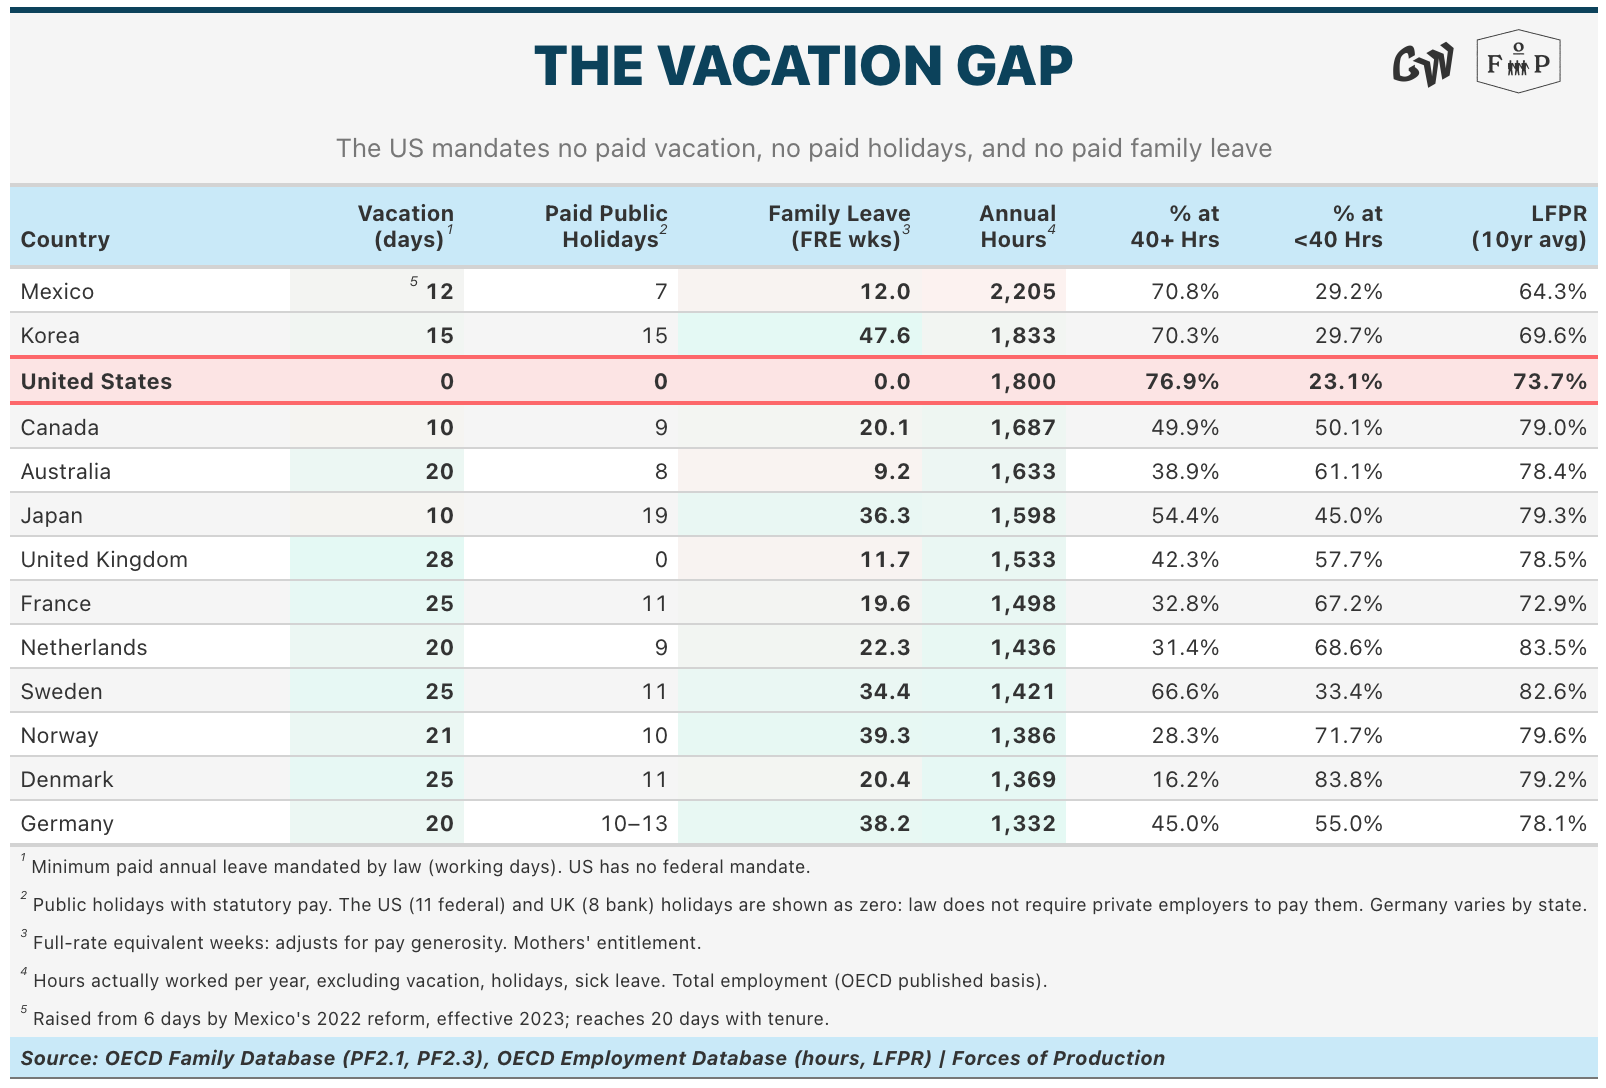
US law has essentially declined to mandate paid vacation days. The US stands out among its developed-world peers in almost every way here: one of the highest annual hours worked (1,800 per year, behind only Mexico and Korea), the absolute lowest for mandated vacation days (zero, against 20 in Germany, 25 in France, 28 in the UK), mandated paid public holidays (zero required of private employers, despite 11 federal holidays), and mandated paid parental and family leave (0 full-rate equivalent weeks, against a peer median north of 20).
This means access to vacation in America is dictated entirely by private employers. The differences in these, predictably, track differences in other measures of bargaining power like wages and benefits.
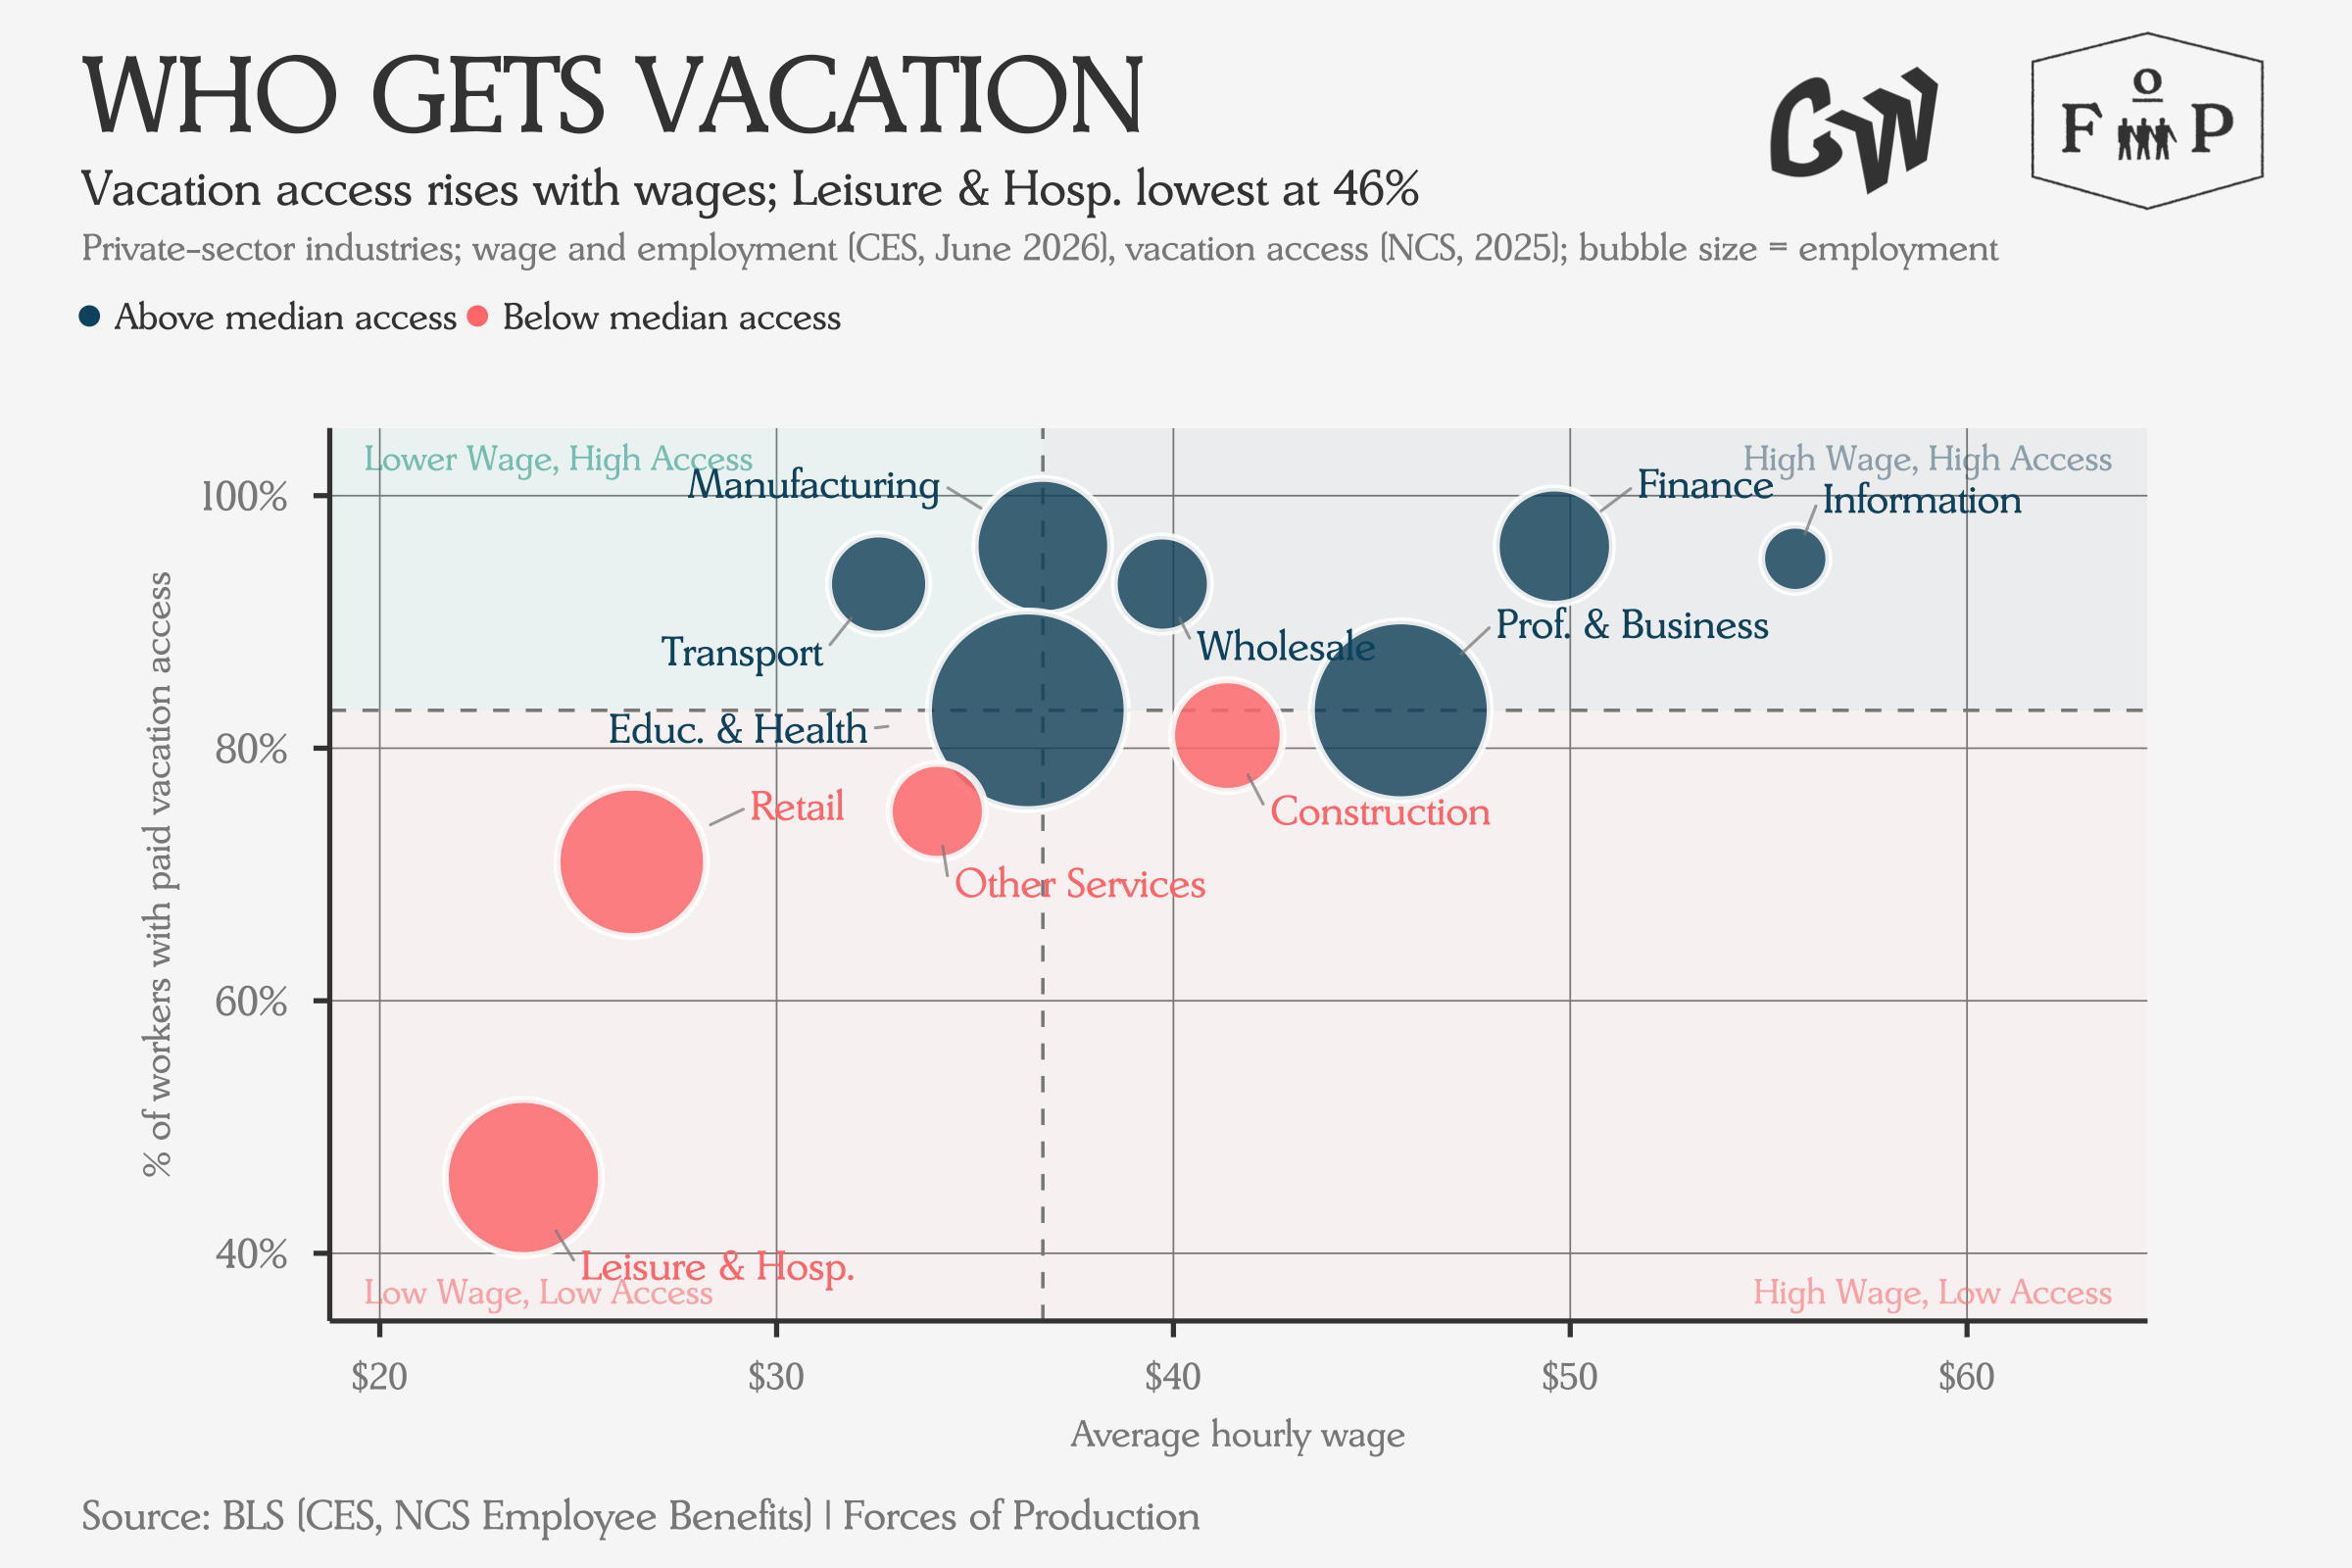
Workers in high-wage industries have ready access to paid vacation days while more precarious workers in Leisure and Hospitality do not. Ironically, the kind of worker you are most likely to see on vacation is probably the least likely to be able to go on vacation themselves.
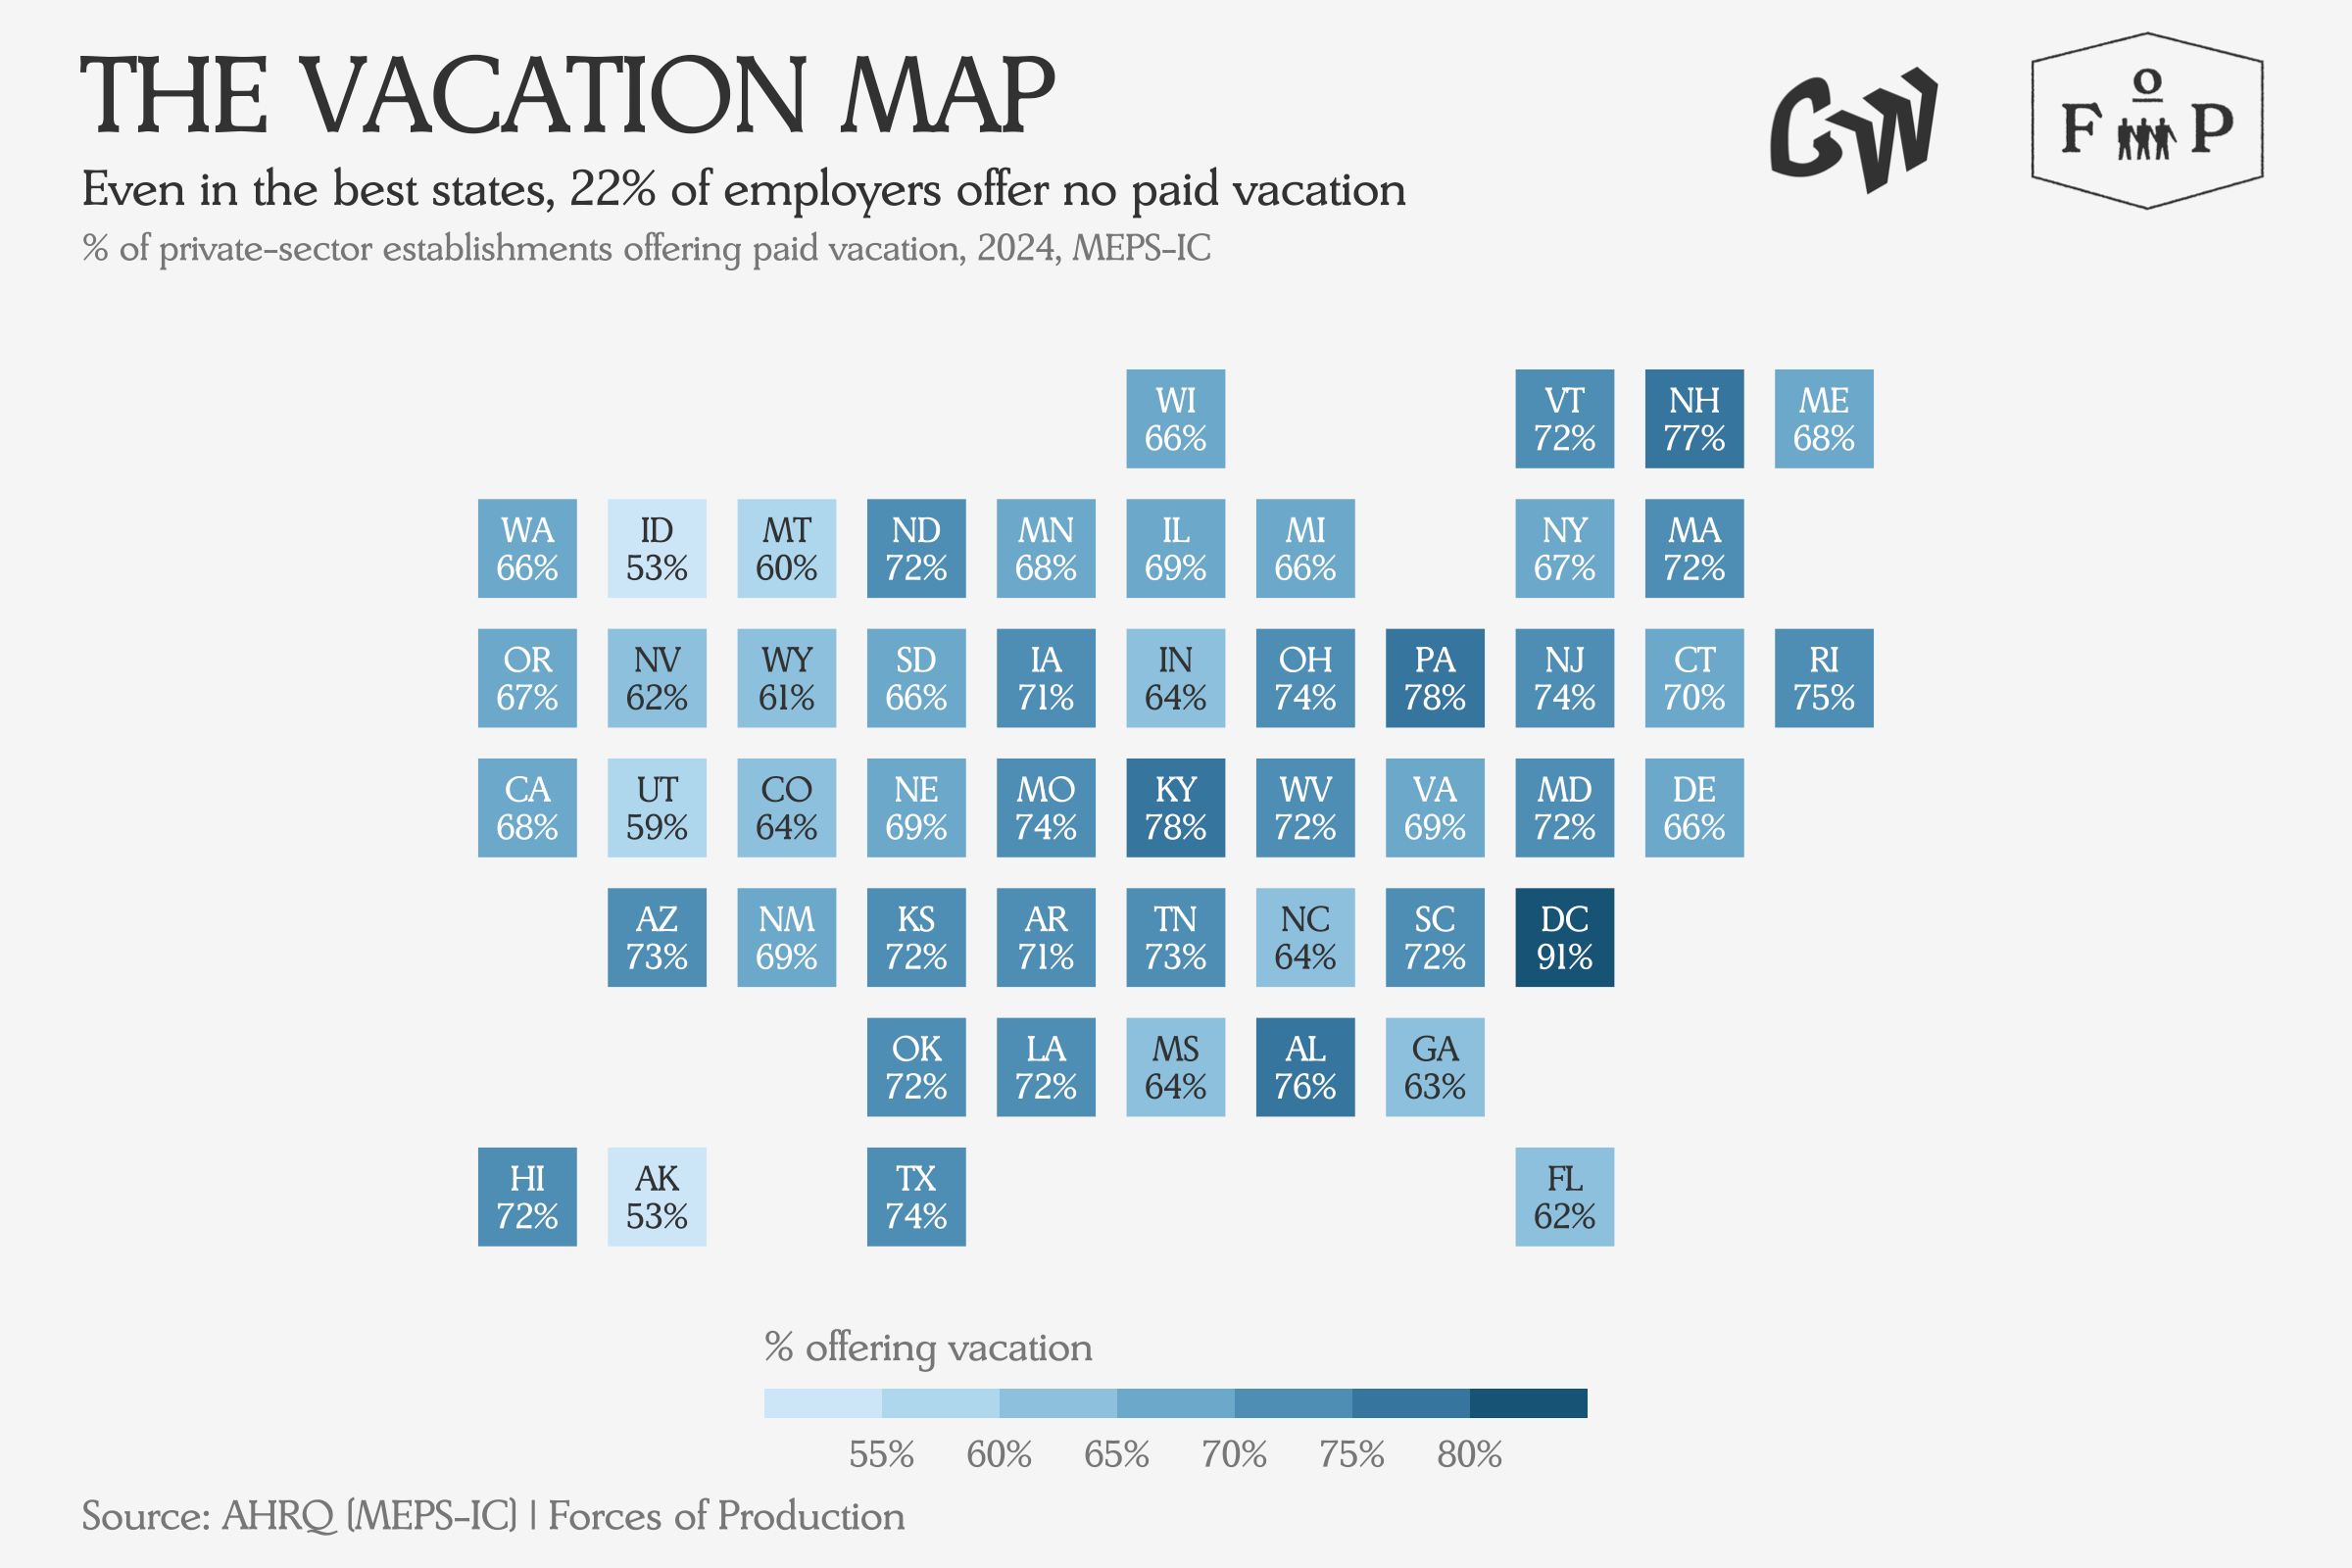
However, these differences in industry don’t add up to clear differences across geography: in both red states and blue, around two-thirds of establishments in each given state offer paid vacation. DC is an interesting standout here at 91 percent, owing largely to the compositional effects of being the only fully urbanized district reported.
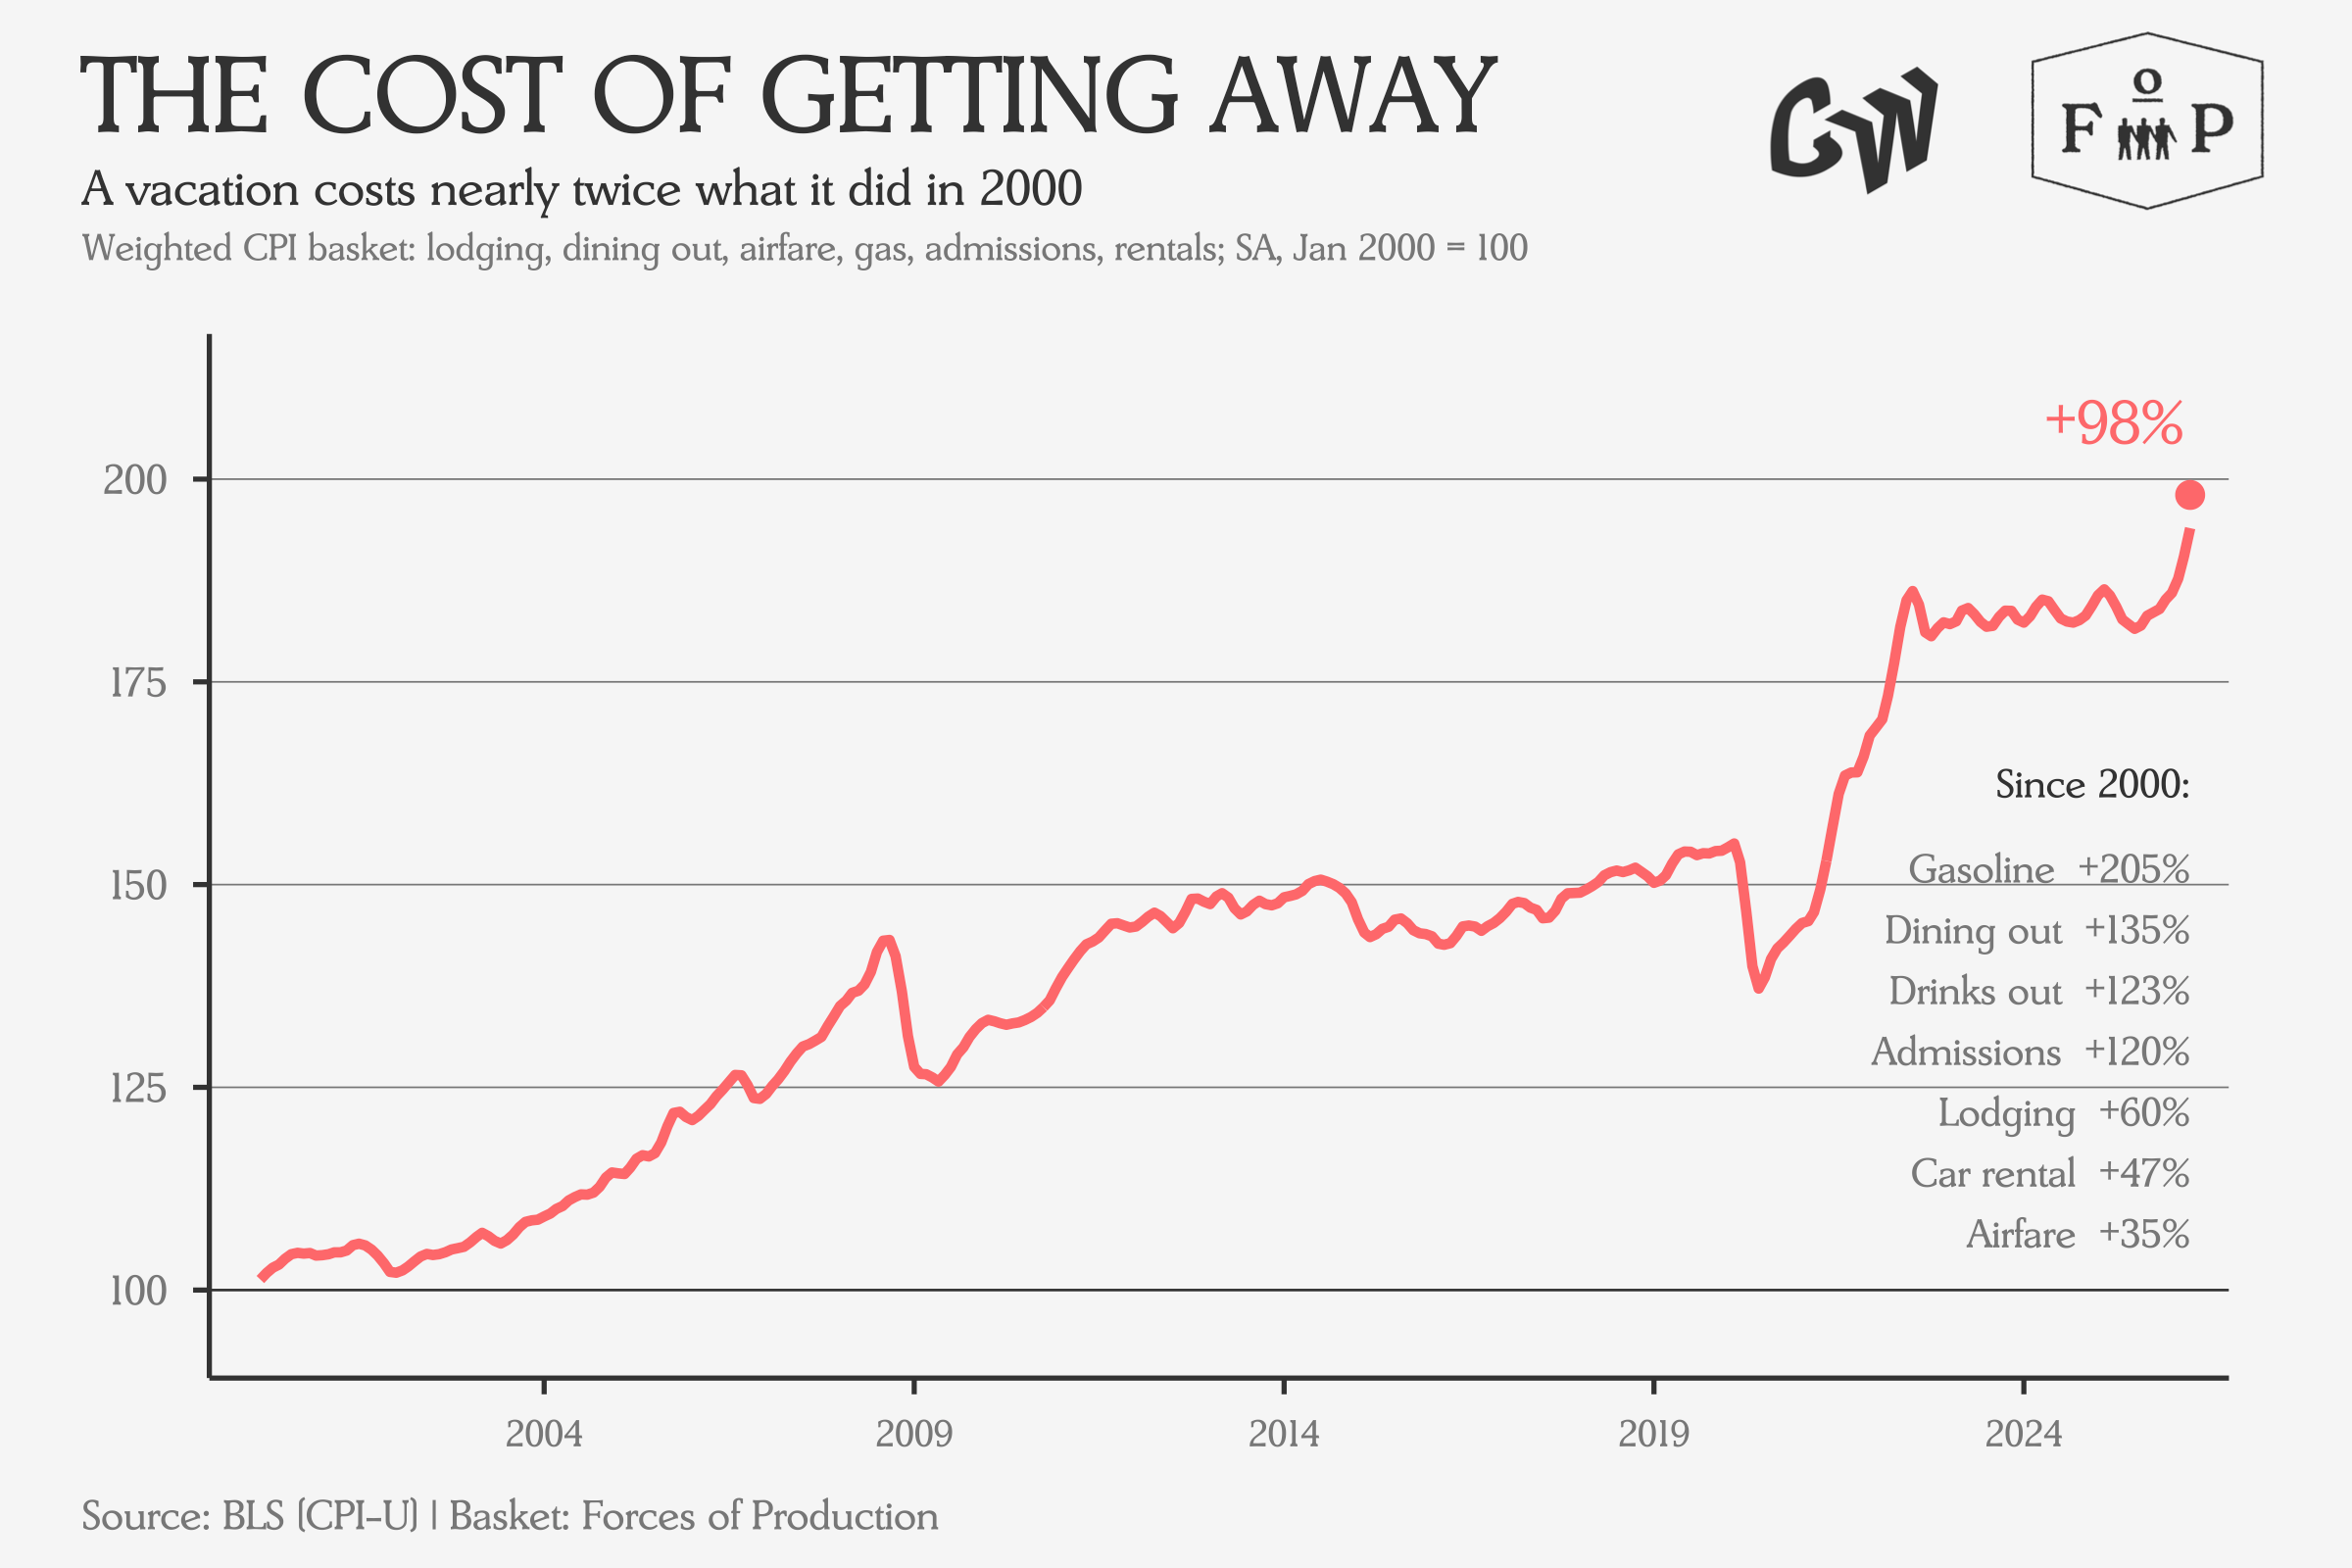
Meanwhile, the vacations that people do take have gotten much more expensive over the last 25 years, with a representative basket of CPI data nearly doubling since 2000.
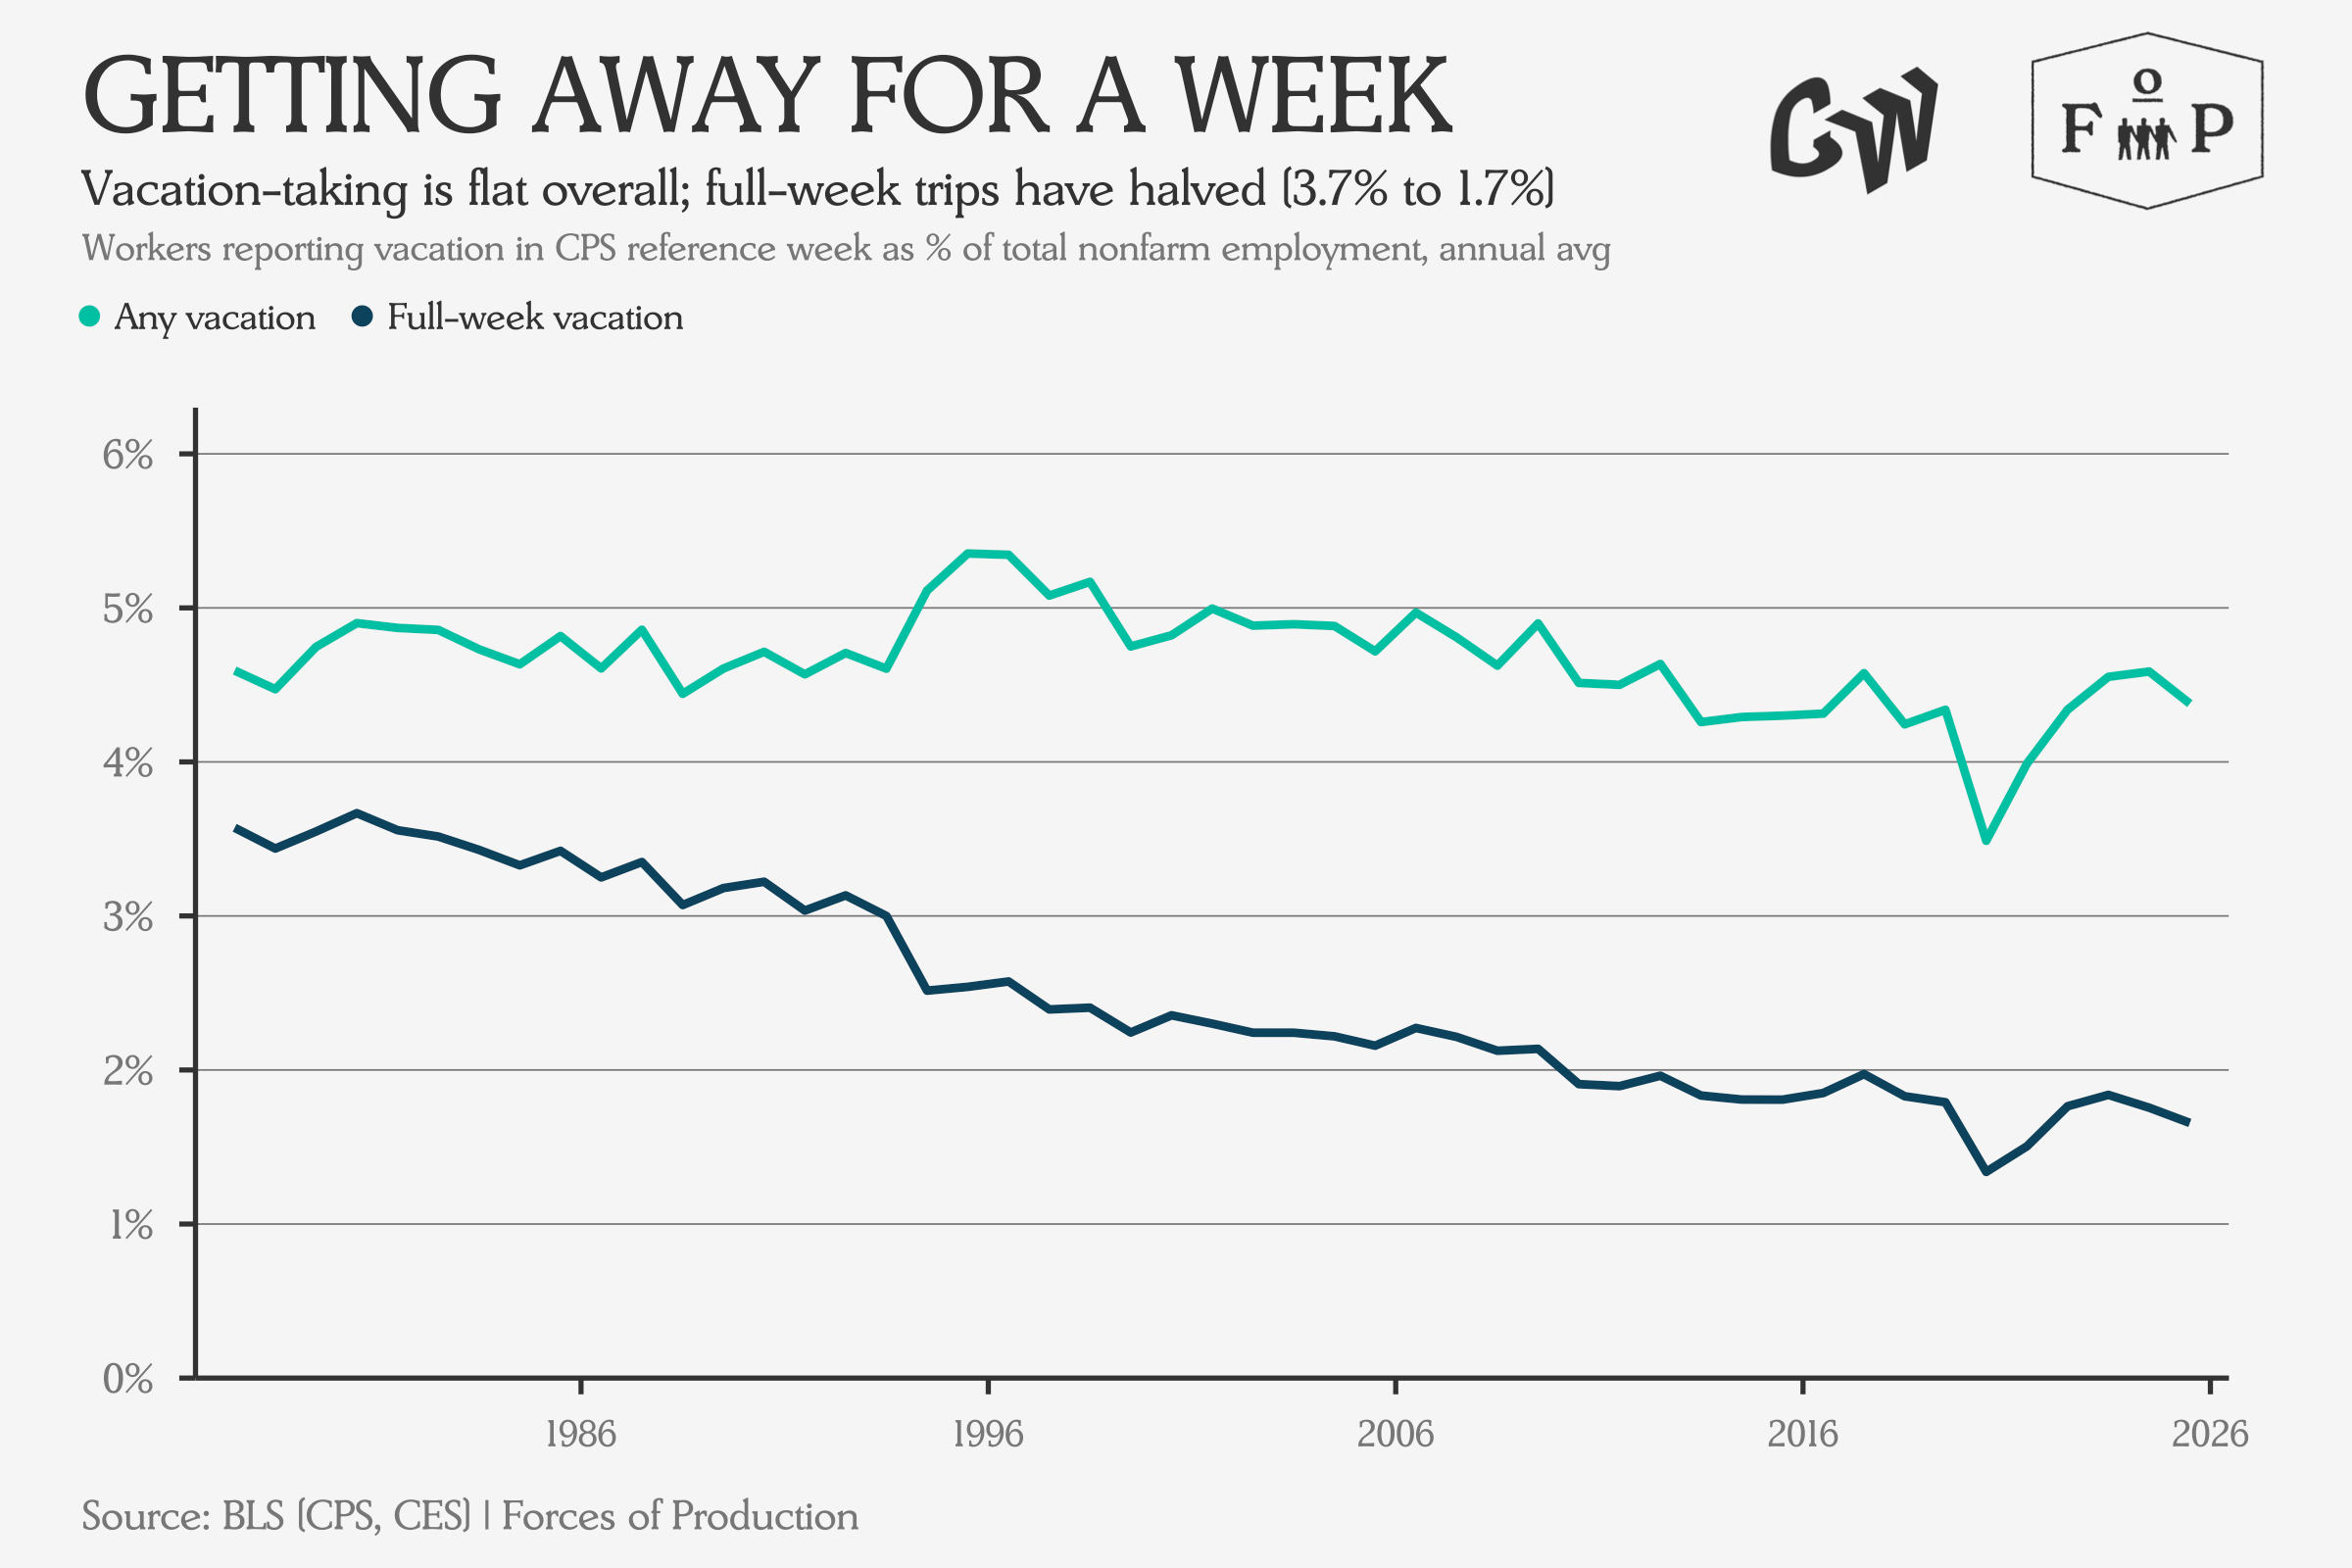
These rising prices might also be contributing to another dynamic — the decline of the weeklong vacation. While the number of workers reporting any vacation in the BLS data for a given month has held roughly steady at around 4-5 percent of total nonfarm employment over the last fifty years, the share reporting a weeklong vacation has been cut in half.
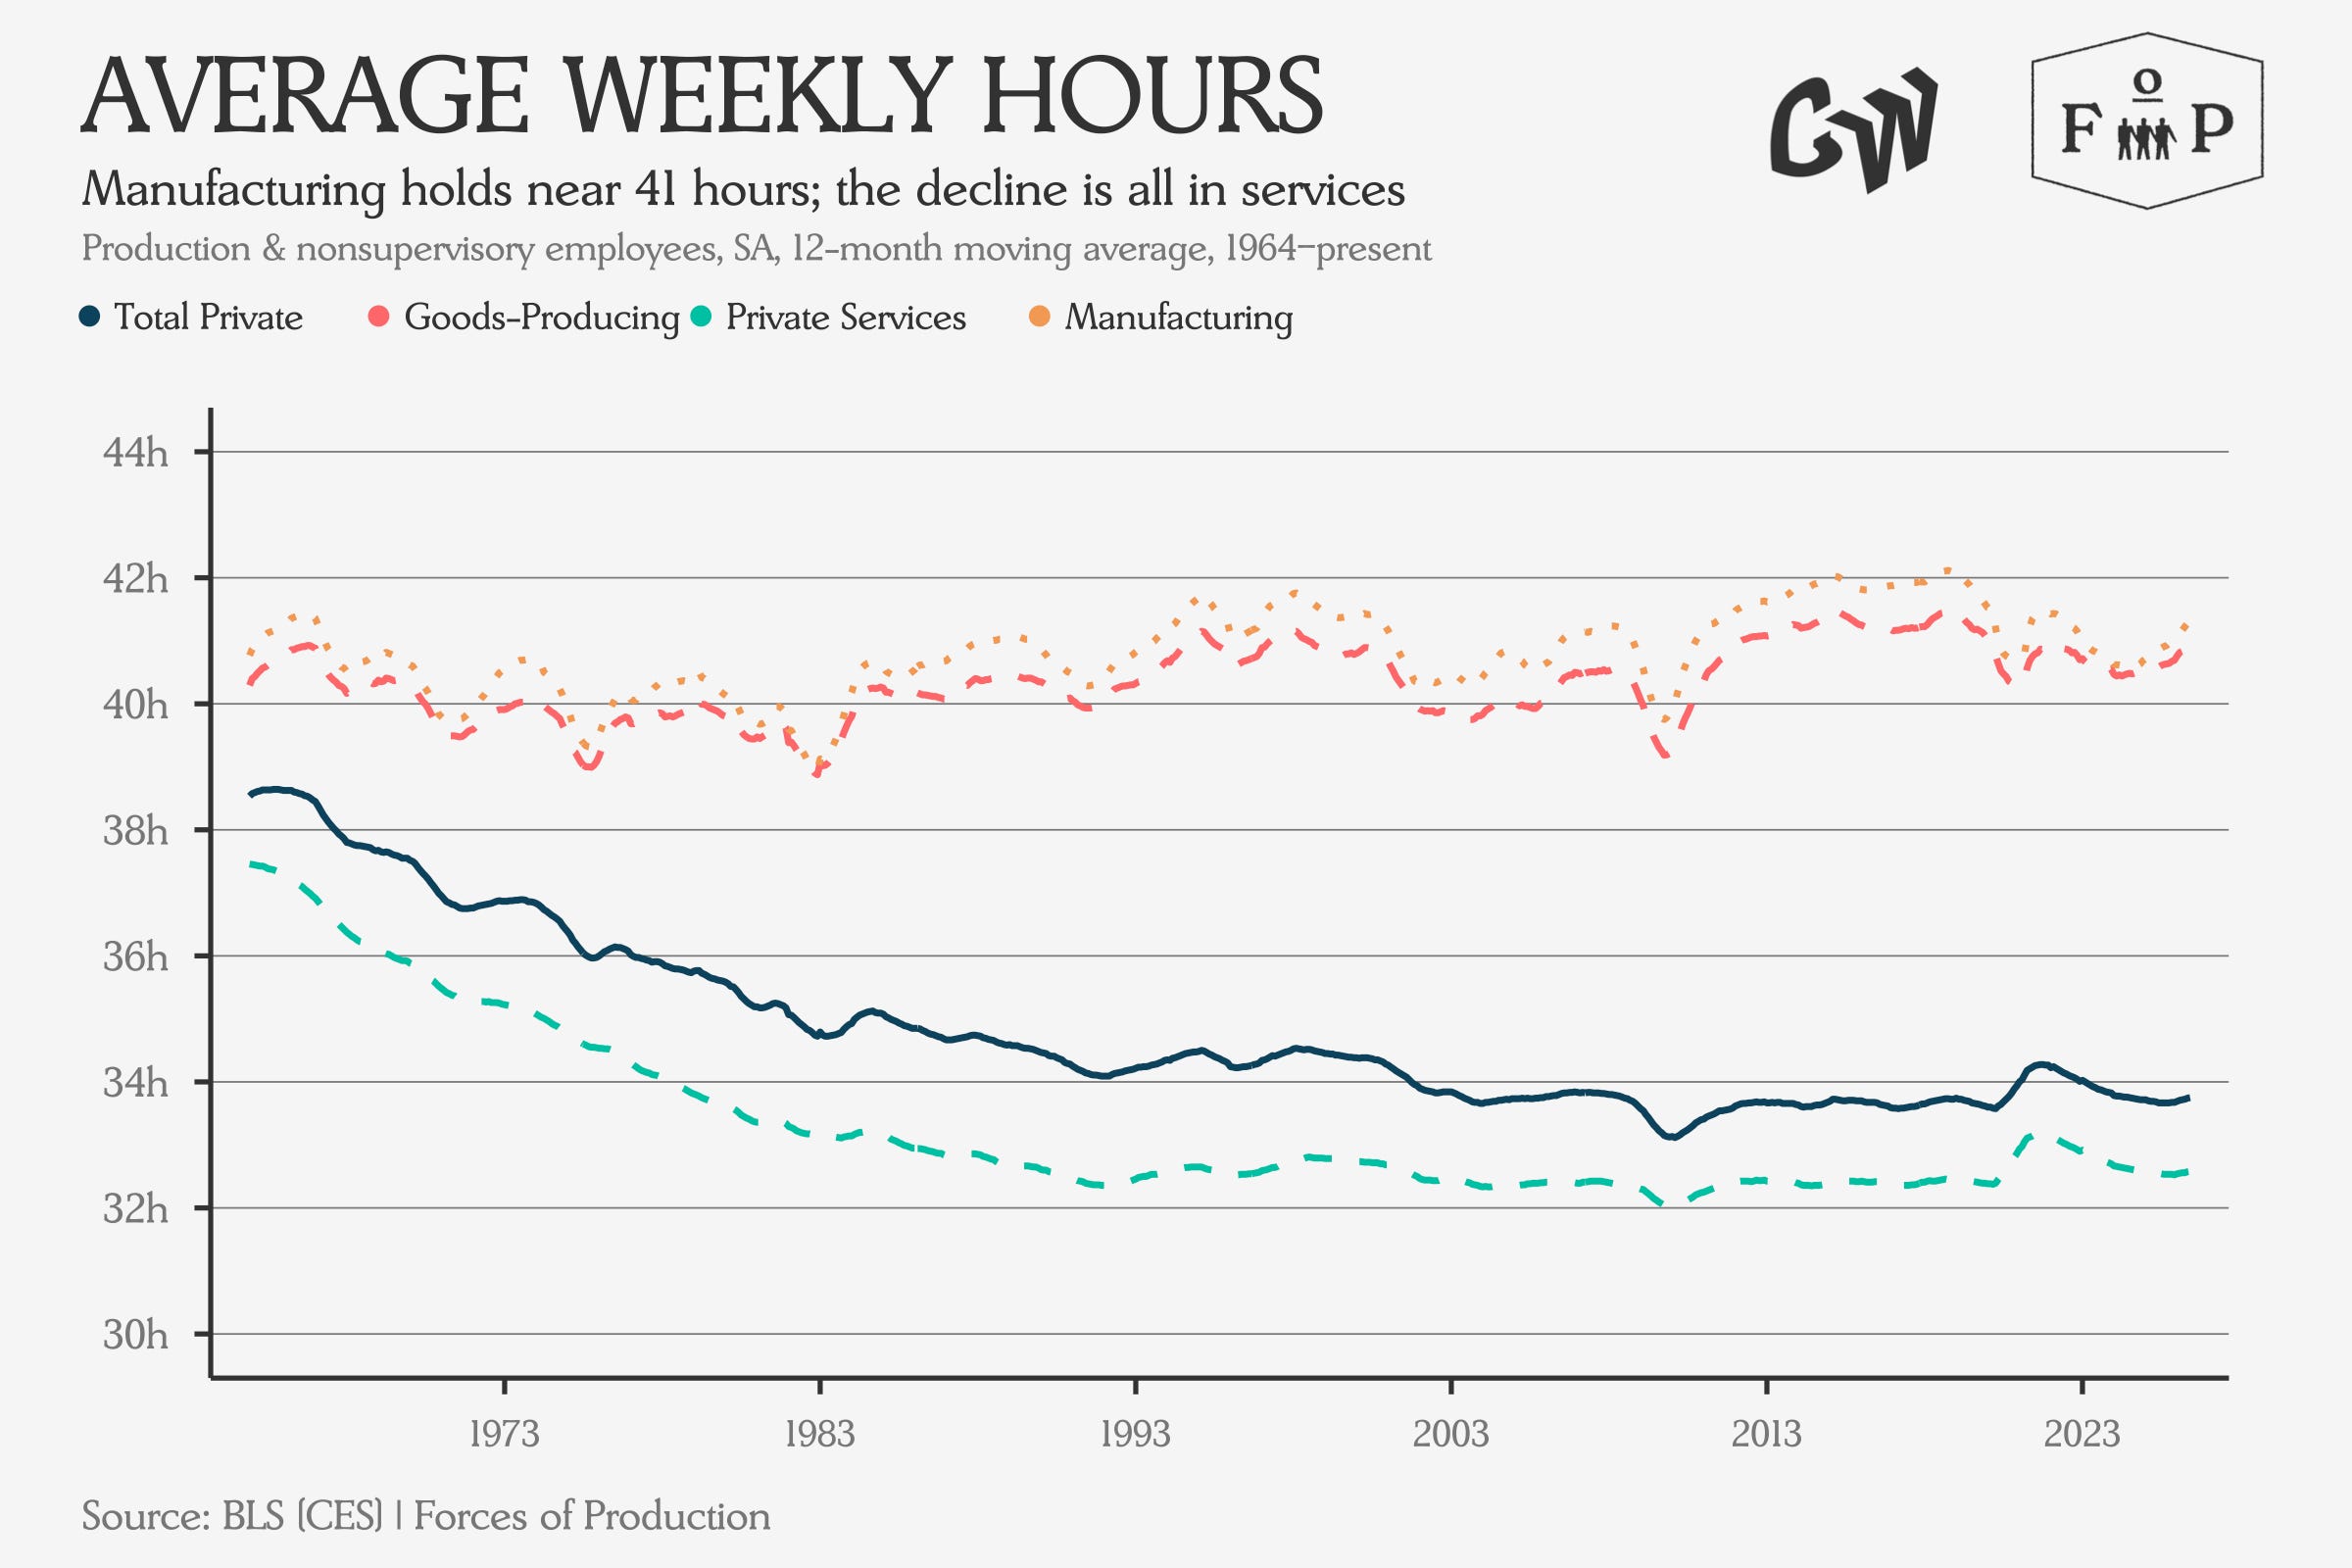
At the same time, average weekly hours worked has fallen since the turn of the millennium, but this is largely down to the compositional effects of the ongoing shift into services on the supply side.
But to return to our starting point, even though many American workers have access to paid vacations, too many American workers do not. Good proposals exist to bring US vacation policy in line with international norms along several dimensions — mandatory minimum paid vacation days (CEPR, EPI), paid public holidays for private-sector workers, and paid family and medical leave (National Partnership, CLASP).
The workers who serve the food to others on vacation deserve time off themselves. Policymakers should guarantee workers the time they need to care for themselves and their communities.
This Month’s Data
Here we are looking at the June data, released over the course of July, with the exception of trade, which is released on a two-month lag, so we are looking at the May trade data.
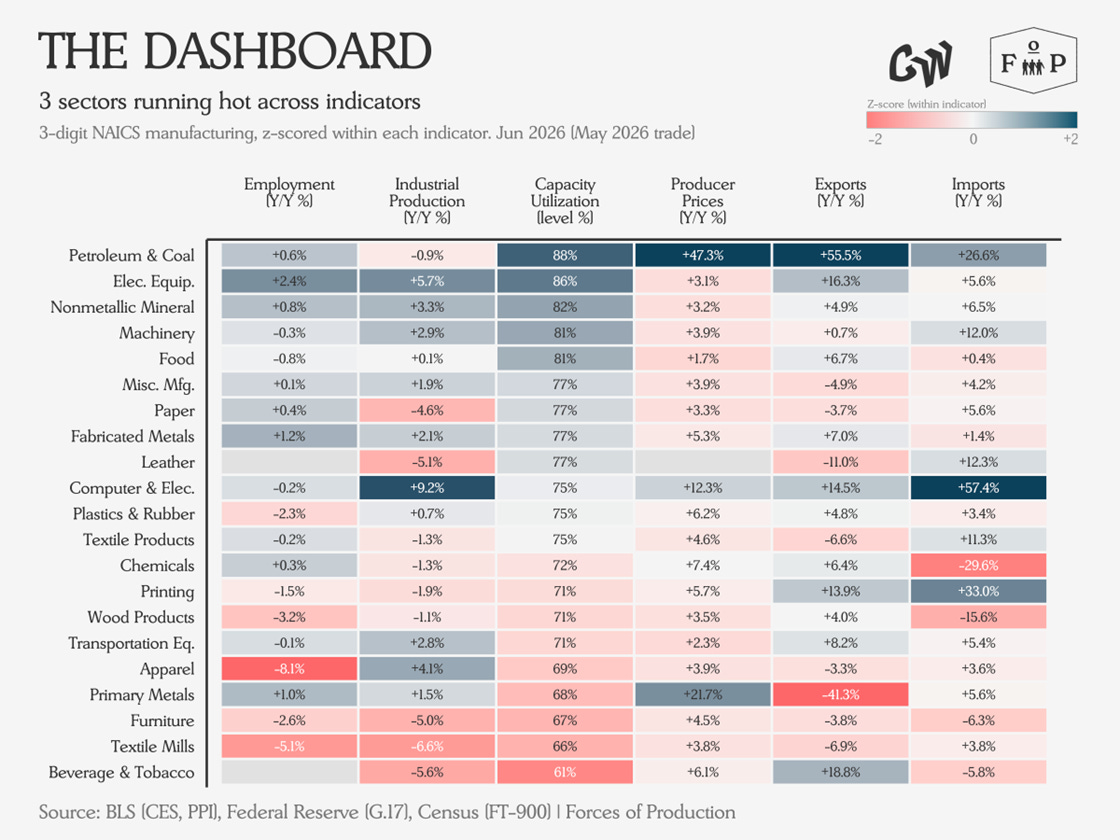
Looking across the manufacturing dashboard, we see output and employment growth in many of the higher-utilization sectors, especially those involved in the production of capital and grid equipment like Electrical Equipment, Machinery and Fabricated Metals.
The impact of the Iran war is also beginning to show up in a more generalized form beyond high utilization in Petroleum and Coal Products. Plastics and Chemicals both saw a significant upswing in input costs, which the Chemicals industry matched with a decline in output and imports alike. This may prove a sign of depleting inventories in future.
Employment
The June employment numbers came in below forecast, but above the level required to keep unemployment stable at 4.2 percent.
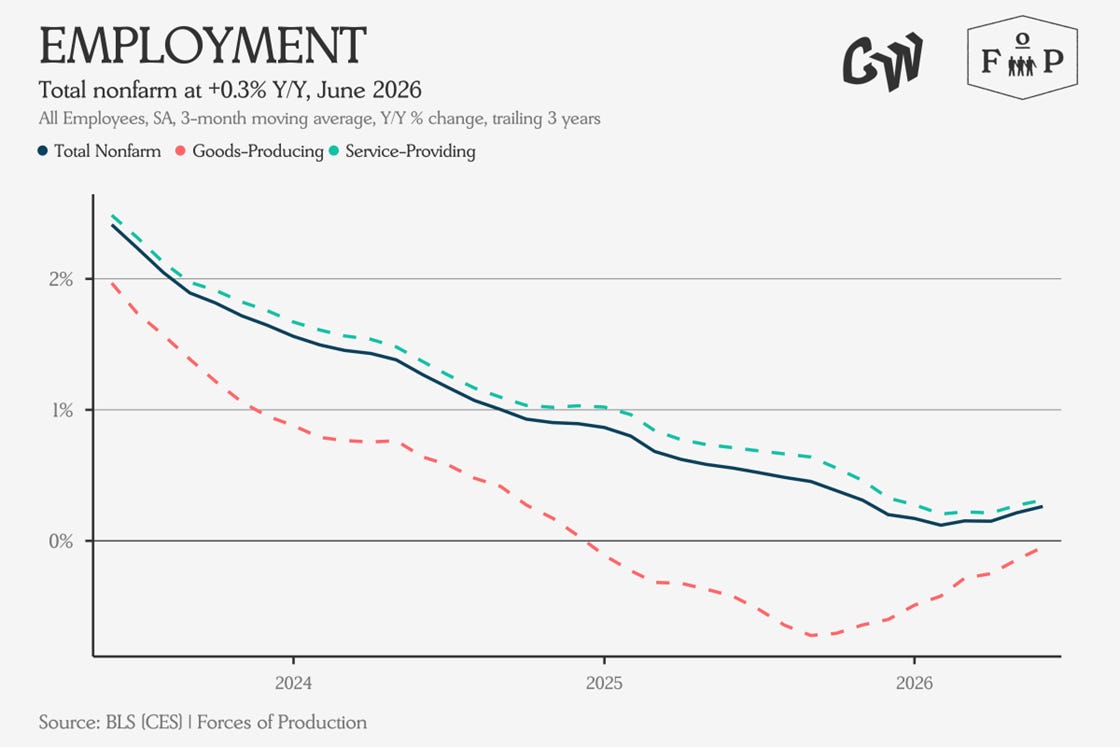
Looking at the aggregate numbers, the upturn has come both from a slight acceleration in employment growth in Service-Providing industries, and a slowdown in the decline in employment in Goods-Producing sectors. Services are growing more quickly, and manufacturing is shrinking more slowly.
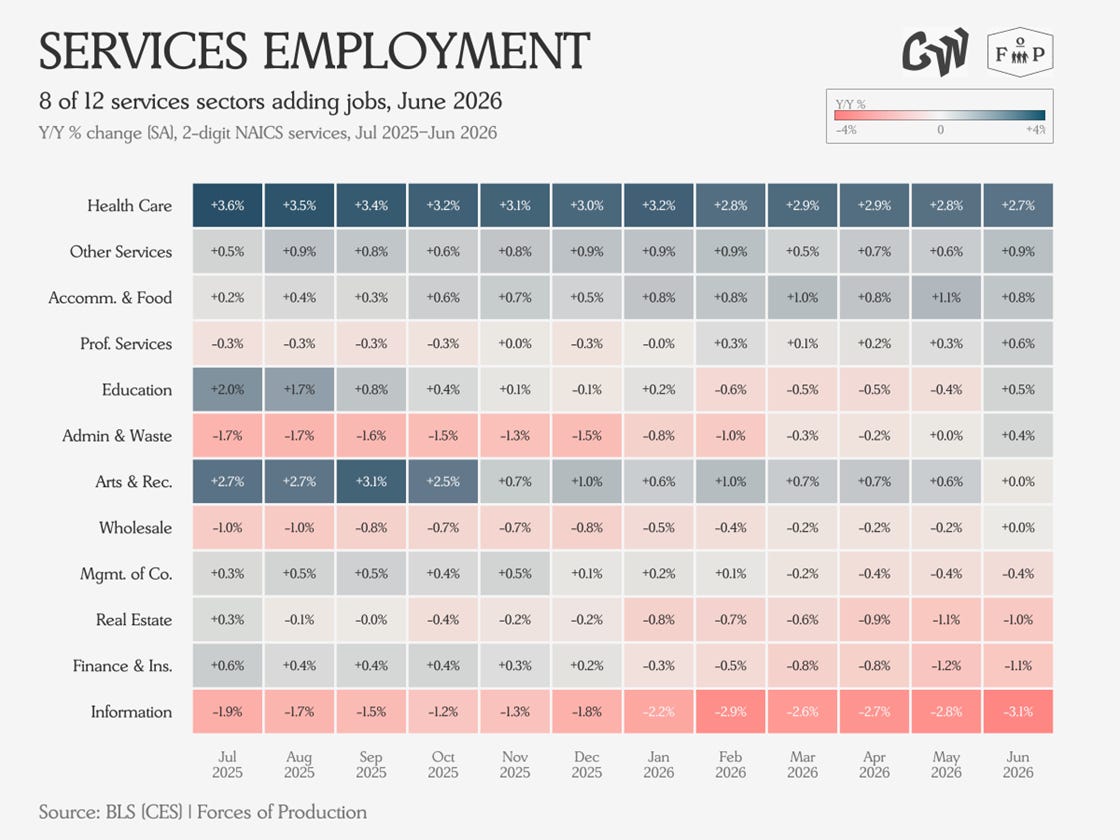
Looking across employment in the Service-Providing sectors, more sectors posted year-over-year growth in June than in May, with the biggest flip in Education from -0.4 percent in May to +0.6 percent in June. Health Care employment growth remains strong.
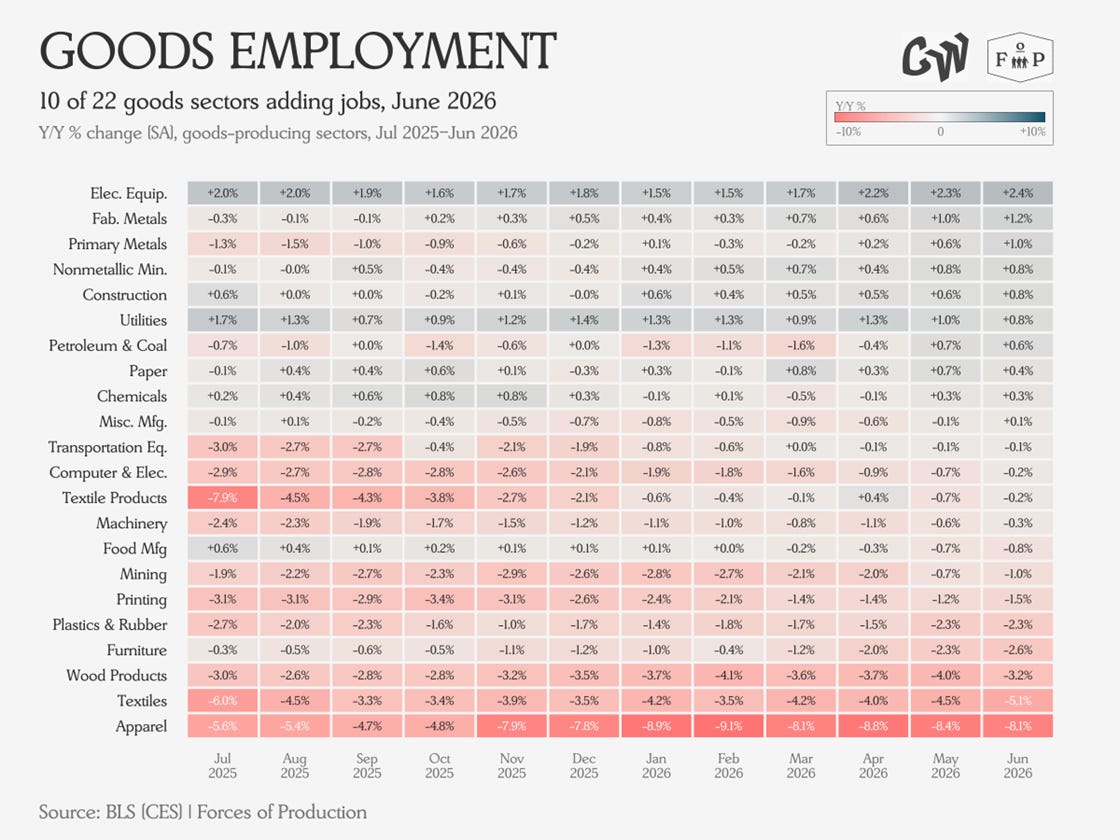
Across Goods-Producing sectors, the situation remains largely unchanged, with low-utilization sectors shedding workers and high-utilization sectors adding workers.
Industrial Production and Capacity
Headline Industrial Production figures grew little month-over-month in the June report, but remain up year-over-year owing to significant weakness in 2025.
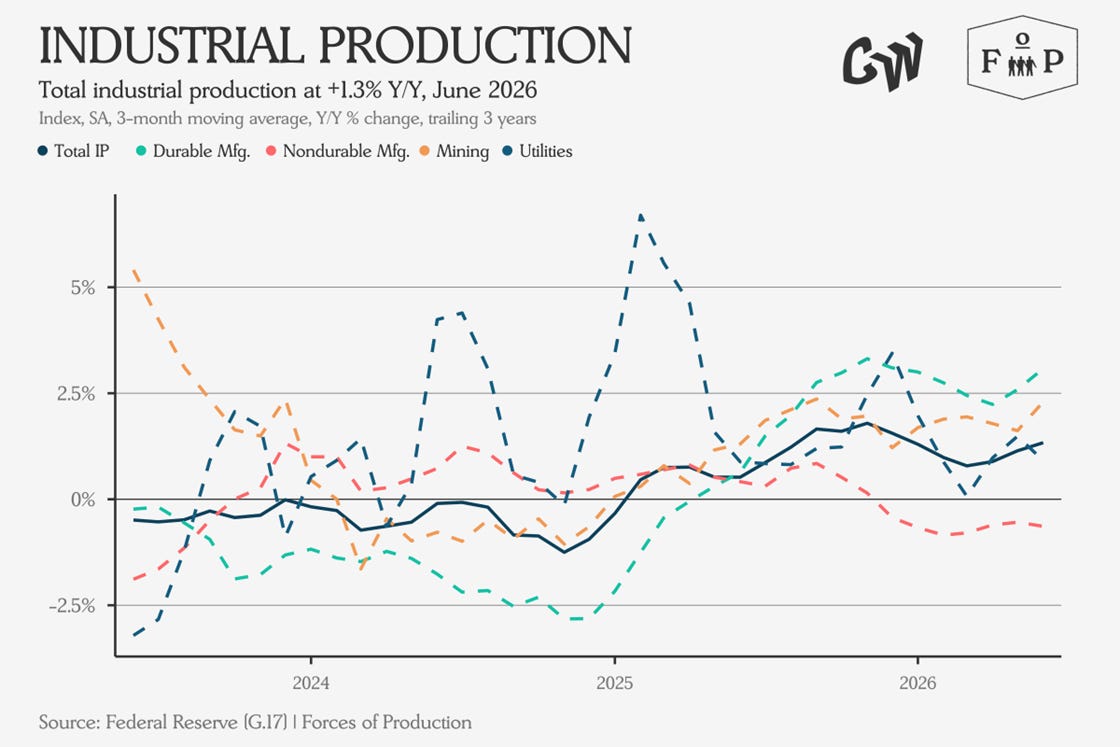
Nondurable Manufacturing output continues to shrink year-over-year, while Durable Manufacturing, Mining and Utilities output has grown steadily over the first half of 2026.
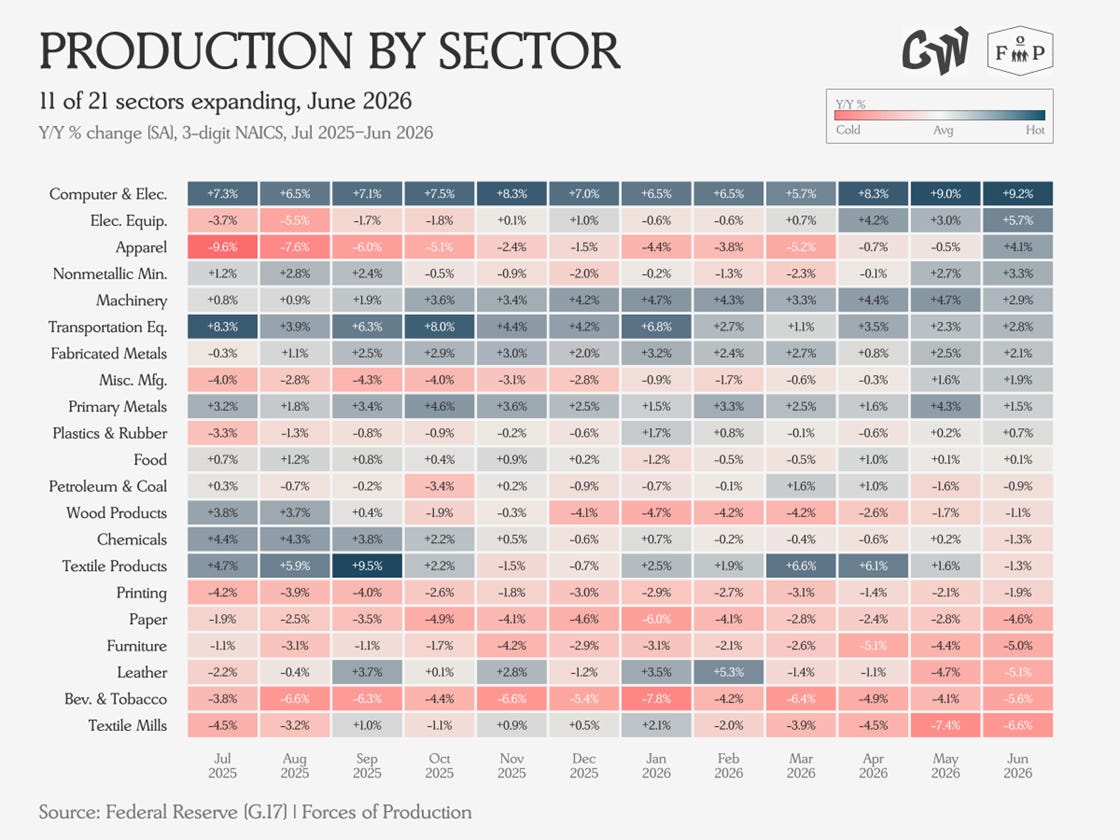
Breaking that production down by sector shows the biggest gains in Computers and Electronics, Electrical Equipment, and oddly given both the capacity utilization and employment numbers, Apparel.
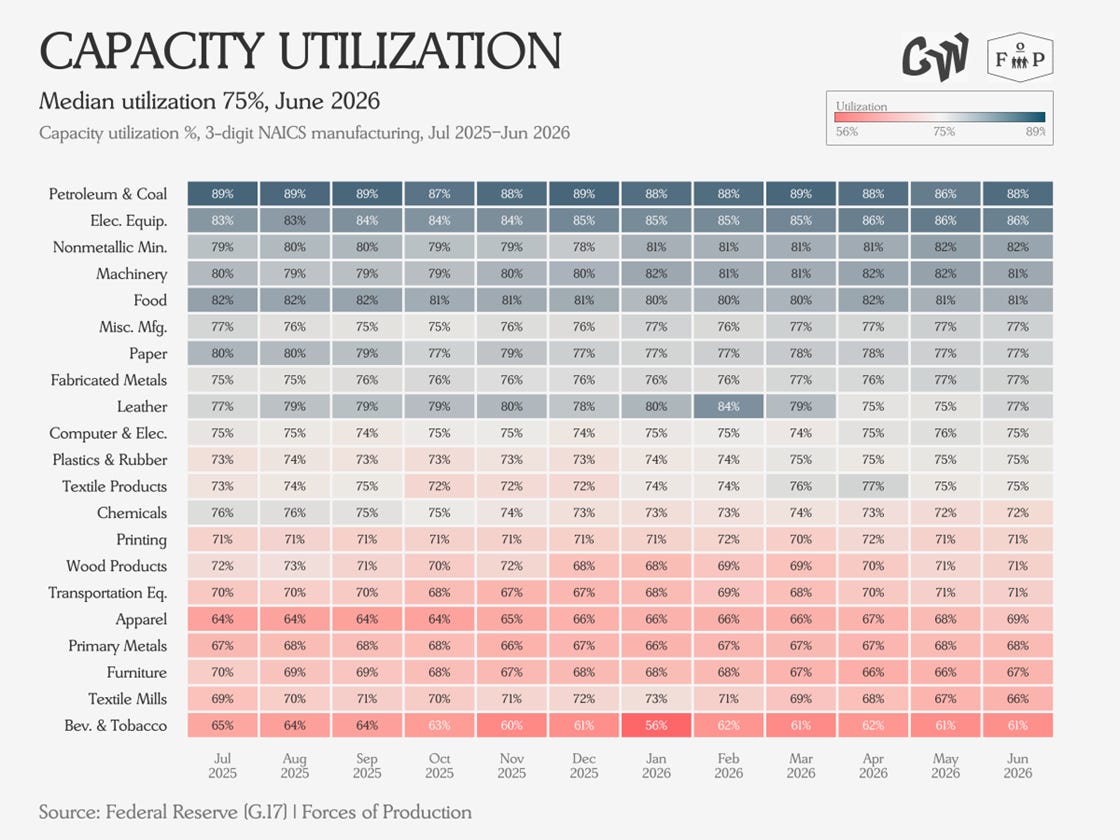
We continue to see little movement between the higher and lower utilization sectors in the Capacity Utilization data.
Prices
June saw an unexpected fall in the Producer Price Index, with core PPI coming in below expectations alongside relatively successful jawboning attempts by the administration to keep the price of gasoline and transport fuels down. Despite this, we see some broadening of inflationary pressures from the Iran war to a wider set of sectors.
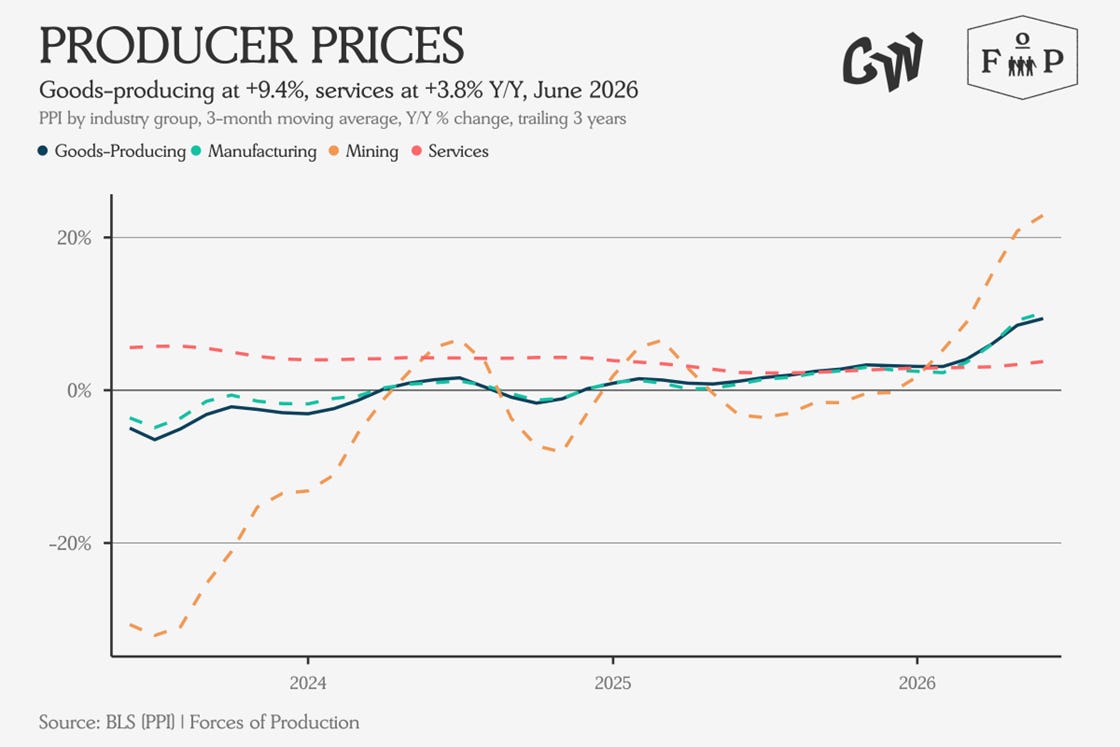
At the aggregate level, Service-Producing industries continue to see relatively stable inflation in input costs around three to four percent, Goods-Producing industries have seen a significant jump since the onset of the Iran war.
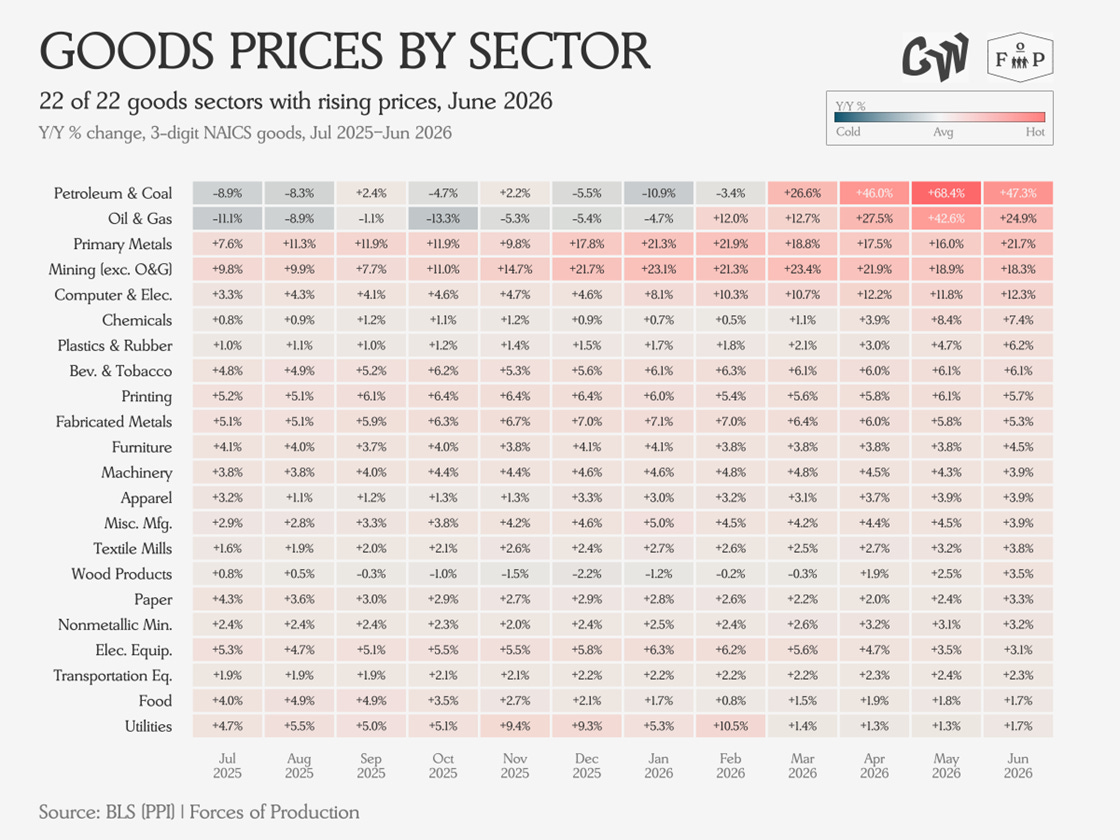
In the June data, we see input prices for Petroleum and Coal Products taking a step back down as oil markets, whose participants have been whistling past the graveyard of supply disruptions, saw falling prices over June. Despite this, the extraction complex, Metals, Mining, and Oil & Gas have all seen increases in input costs on the order of 20 percent over the past year.
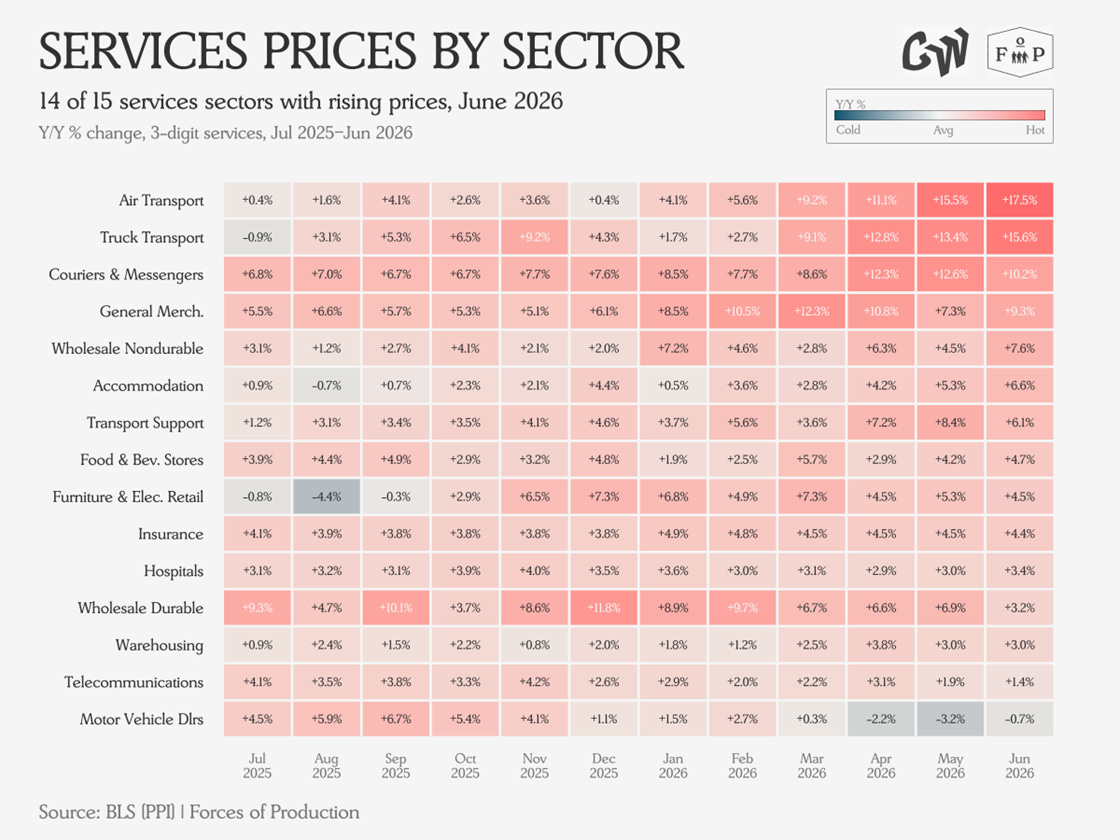
In the June data, Air Transport and Truck Transport both saw input costs accelerate despite falling spot markets for oil, suggesting more complex dynamics. The only sector to show falling prices was Motor Vehicle Dealers.
Trade
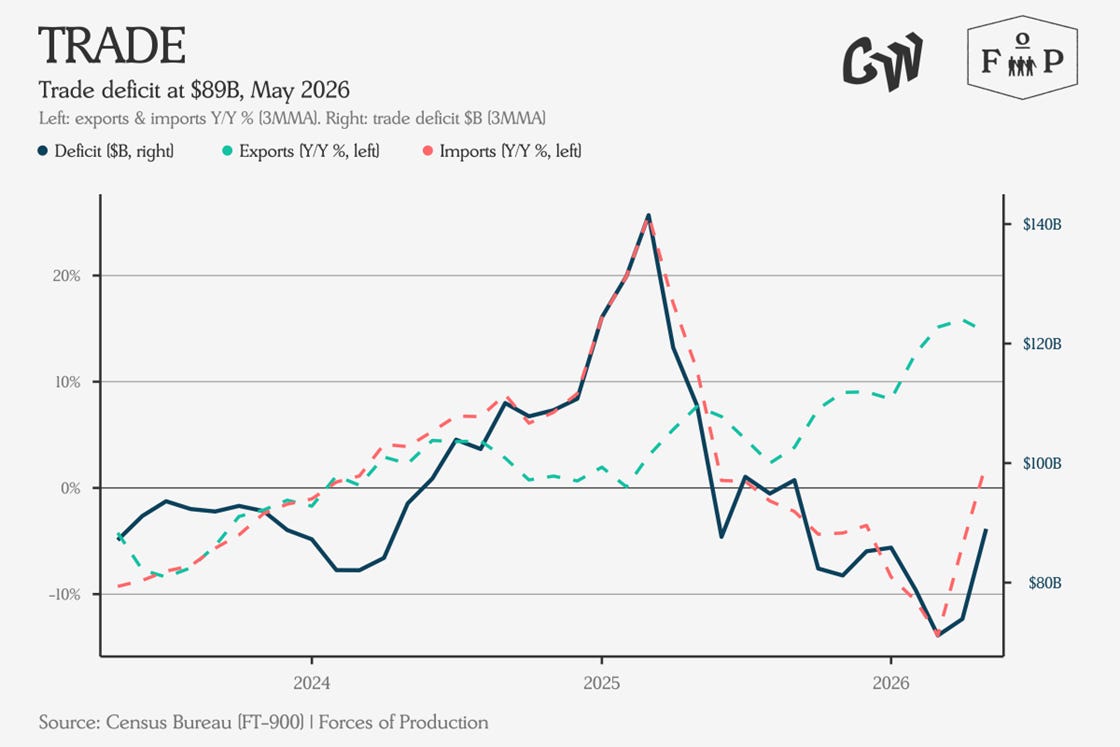
In the May trade data, exports fell and imports rose, increasing the nominal trade deficit to 77.6 billion dollars. While the measured trade deficit had been falling through much of the year, this reading is within a few percent of its value a year ago.
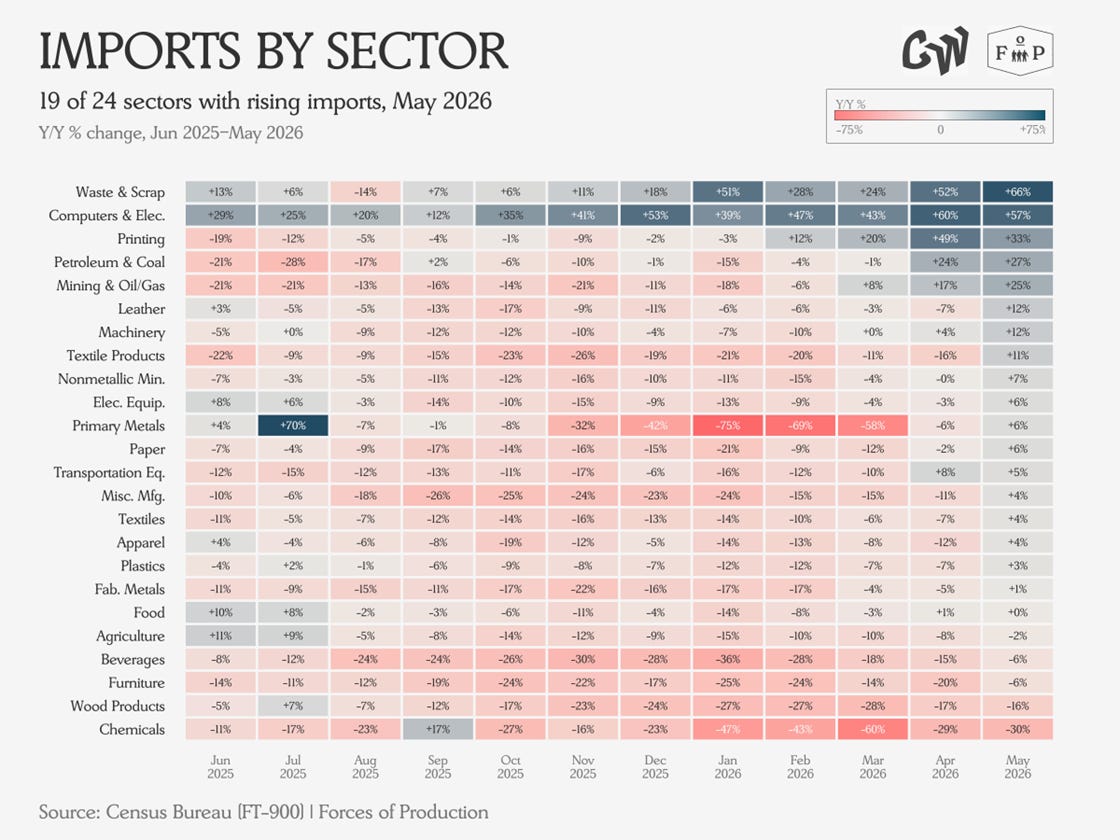
Interestingly, imports of waste and scrap have been steadily rising all year, driven in part by an increased demand for recycled plastic and e-waste for critical minerals.
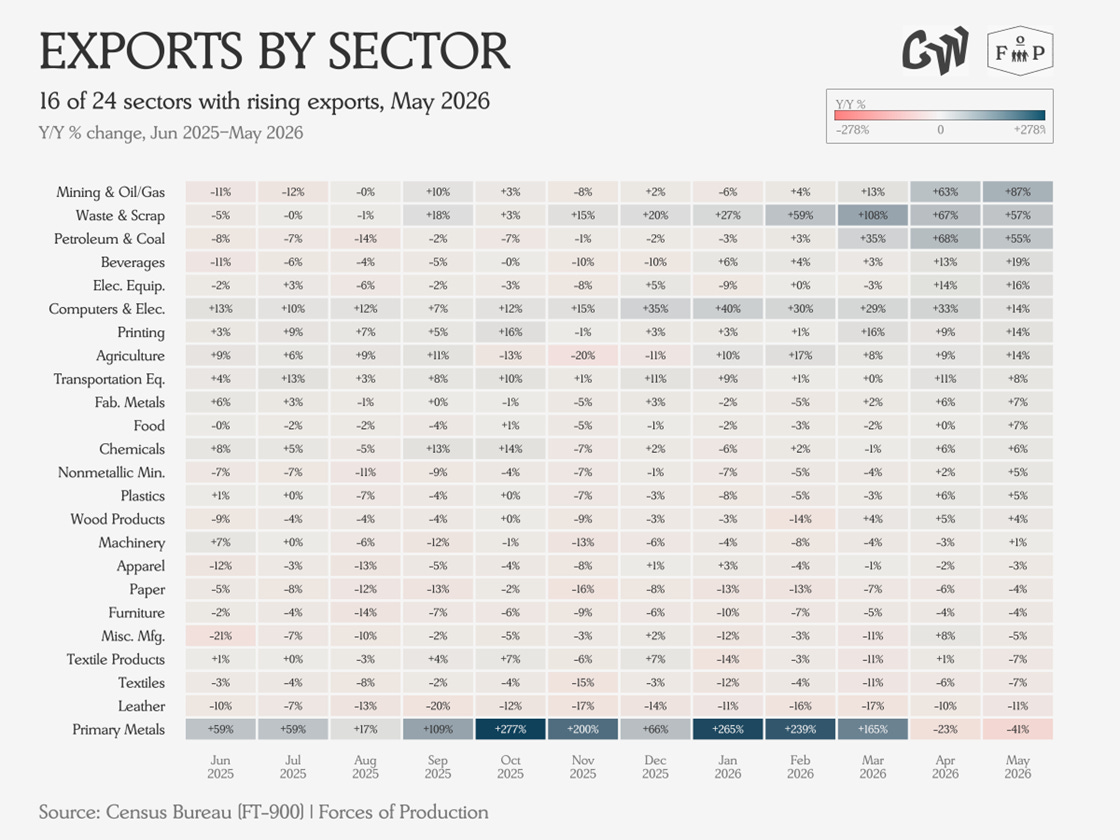
The value of exports for Mining and Oil and Gas was up by the most in the May data, with the biggest decline in Primary Metals. Given that the Primary Metals industry is a major fossil fuel user, the sharp decline in exports following the onset of the war with Iran tracks with the domestic demand for increased inventories.
Outside of the gradual broadening of the energy shock from the closure of the Strait of Hormuz, strikingly little is changing in the economy from month to month. In next month’s issue, we will be taking a look at the sectoral composition of carbon emissions.