The energy system is a hot-button political issue right now, with rates rising faster than inflation, new demand from data centers overwhelming aging local grids, and no coordinated plan for a buildout of clean energy. The case for a federal Power Authority to coordinate utility sector decarbonization and energy affordability is clear. Power should be at the center of the next generation of climate policy alongside a Public Investment Authority to provide the requisite fiscal firepower and economic coordination to solve the problem.
By working together, these two institutions have the tools to tackle both sides of the decarbonization challenge: direct and indirect emissions. A Power Authority can decarbonize the single largest source of current direct emissions — utilities and electricity — by decarbonizing generation and the grid. But even fully decarbonizing electricity only takes us a quarter of the way to decarbonizing the supply side. Much of the rest is tangled up in indirect emissions winding through linked supply chains. Eliminating these emissions requires a Public Investment Authority capable of coordinating markets while making transformative supply-side investments.
The structural decisions about where to invest and in what order are genuinely difficult, and any institution charged with making them will face challenges navigating and communicating the tradeoffs involved. The economy is a mesh of interconnected production processes, and any intervention in one place propagates through the others in different ways.
So today we are going to work through some data the Environmental Protection Agency has prepared to show what these structural relationships look like inside the existing production network. In the process, we will see why a Productive State approach capable of governing the supply side is indispensable to tackling the challenge of decarbonization.
These policy challenges will confront any serious next-generation climate investment program and policymakers will need the power and flexibility of Productive State institutions to navigate them. For now, we are going to use this data to explore the structure of the supply side, and look at how prices, production, and carbon emissions produce different interlocking lenses for prioritizing public investment across time and sector.
Direct and Indirect Decarbonization
Overall, US emissions have been falling slowly while global emissions have been rising slowly. Meanwhile carbon emissions per dollar of inflation-adjusted GDP have been falling globally and have fallen more sharply in the US. Since 1990, US emissions are down four percent (down 20 percent from their 2005 peak) and world emissions are up 70 percent, while emissions per dollar of inflation-adjusted GDP are down 59 percent in the US and 42 percent globally.
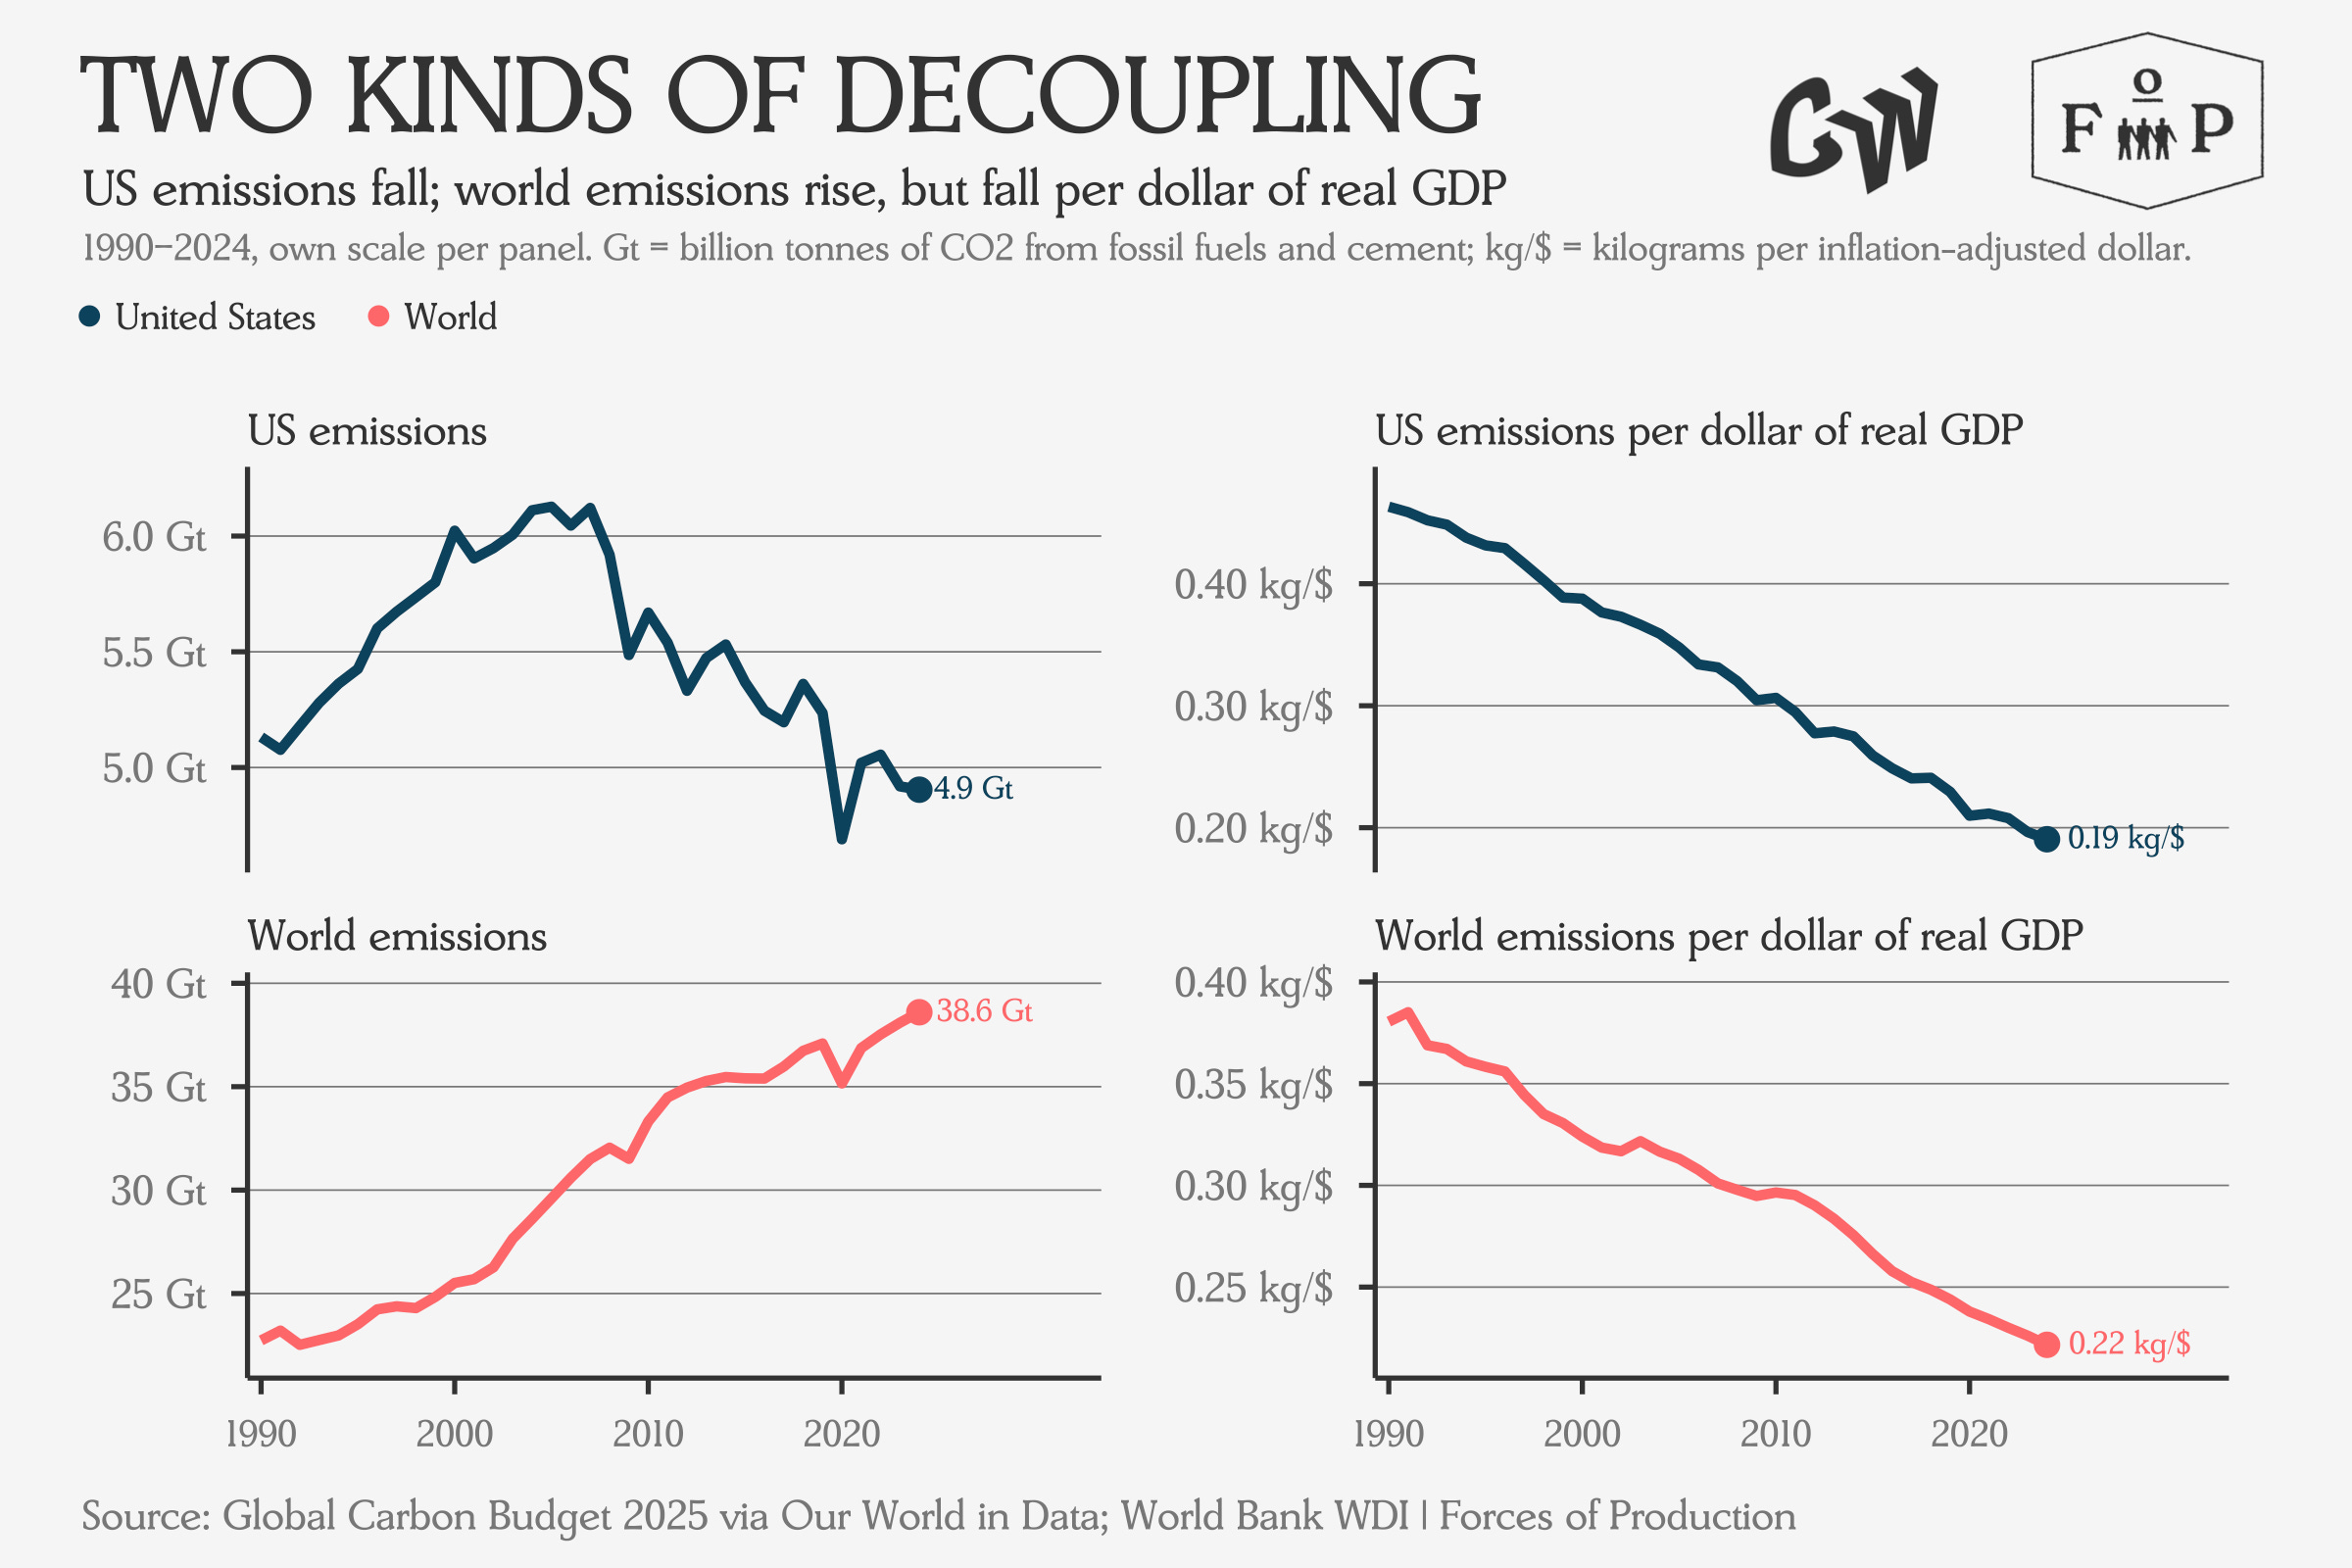
But these high-level aggregates obscure the changing shape of the decarbonization frontier across different sectors and industries, each of which use different production processes with different emissions profiles. By looking at the economy as an ensemble of interrelated sectors rather than a single aggregate, we can easily see that the carbon intensity of production and carbon emissions vary dramatically across different industries. To get a sense of where US emissions are coming from, we can begin by looking at total emissions.
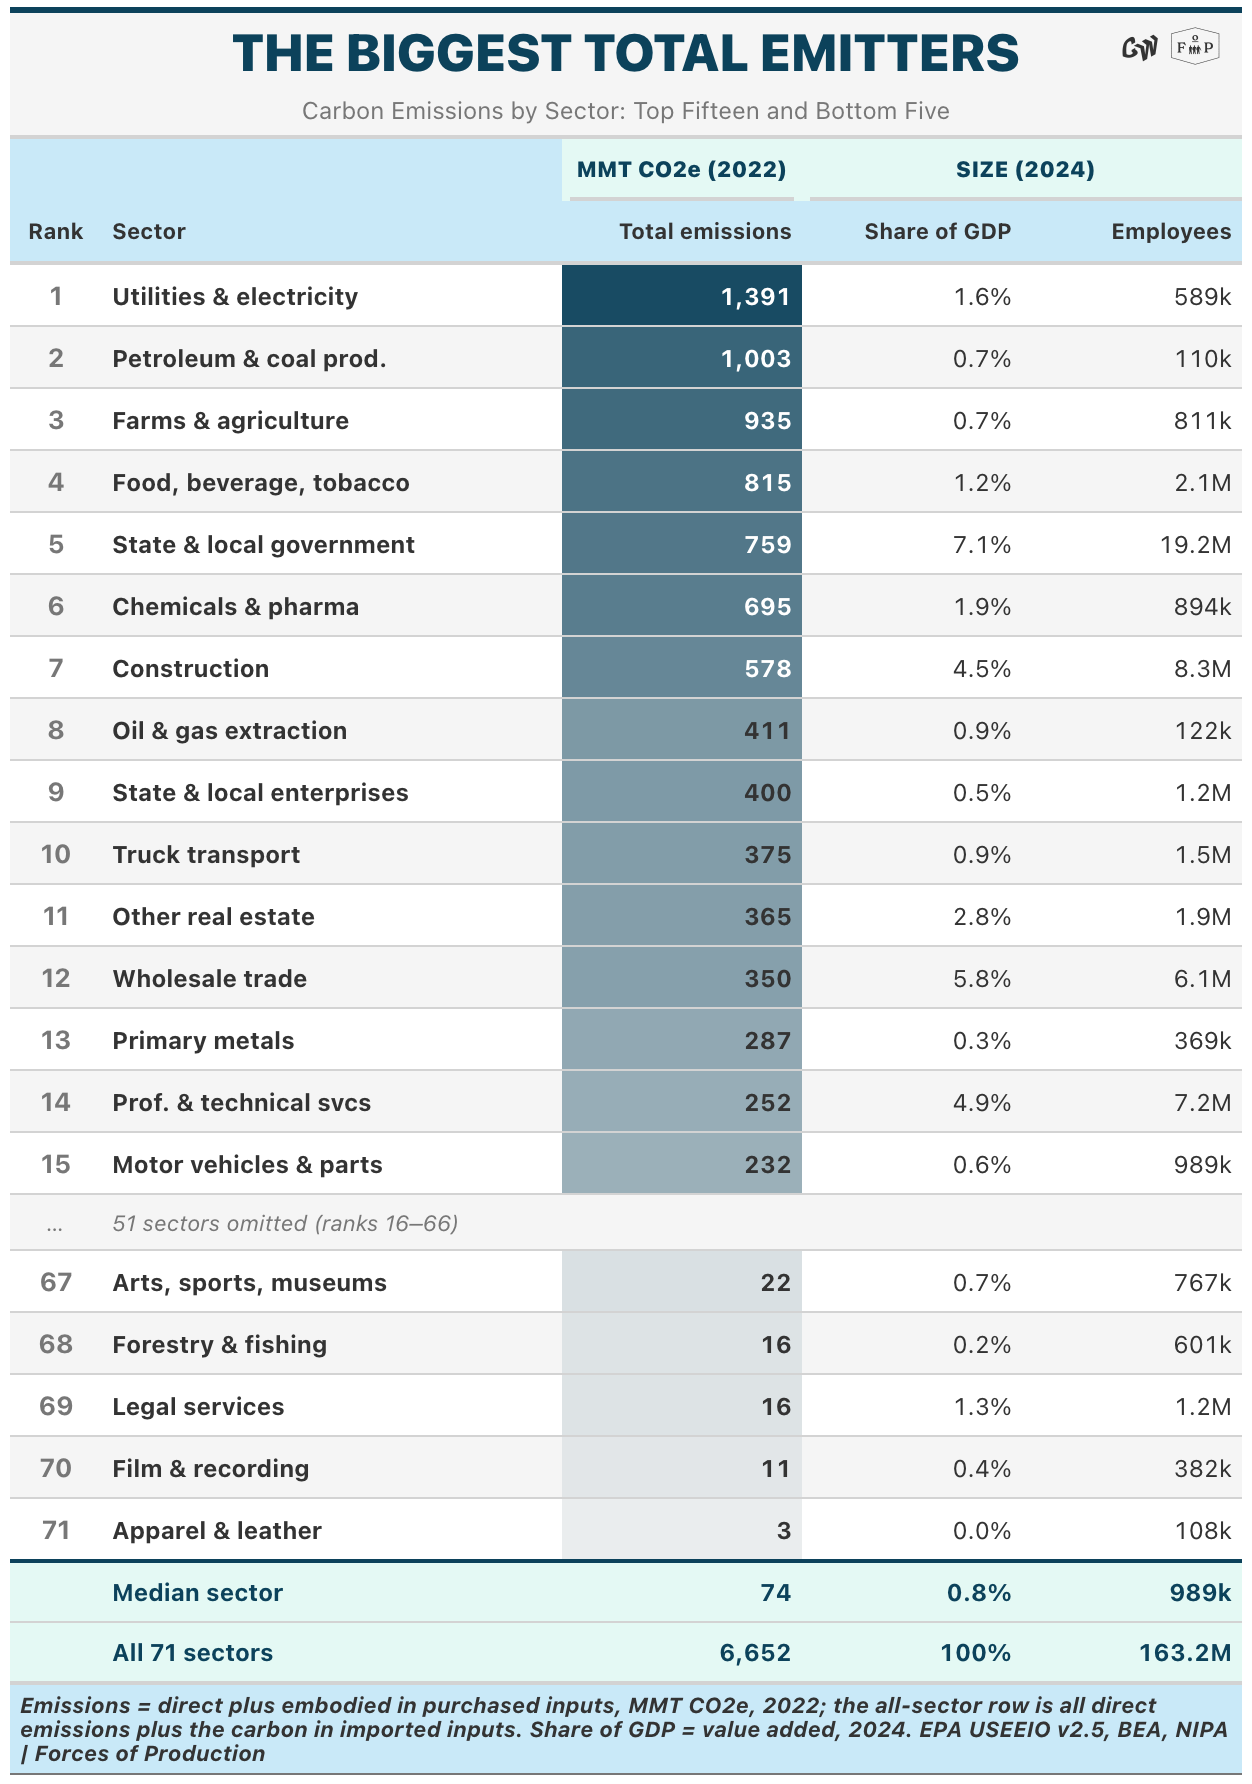
The total emissions leaderboard is dominated by energy and agriculture, as well as sectors that use the outputs of those industries. However, the table above elides a key distinction. Each sector is responsible for both Direct and Indirect emissions. Direct emissions come from the fuels, machinery, and chemical processes used in a particular production process, while indirect emissions are already embodied in the intermediate inputs used in this sector’s production process.
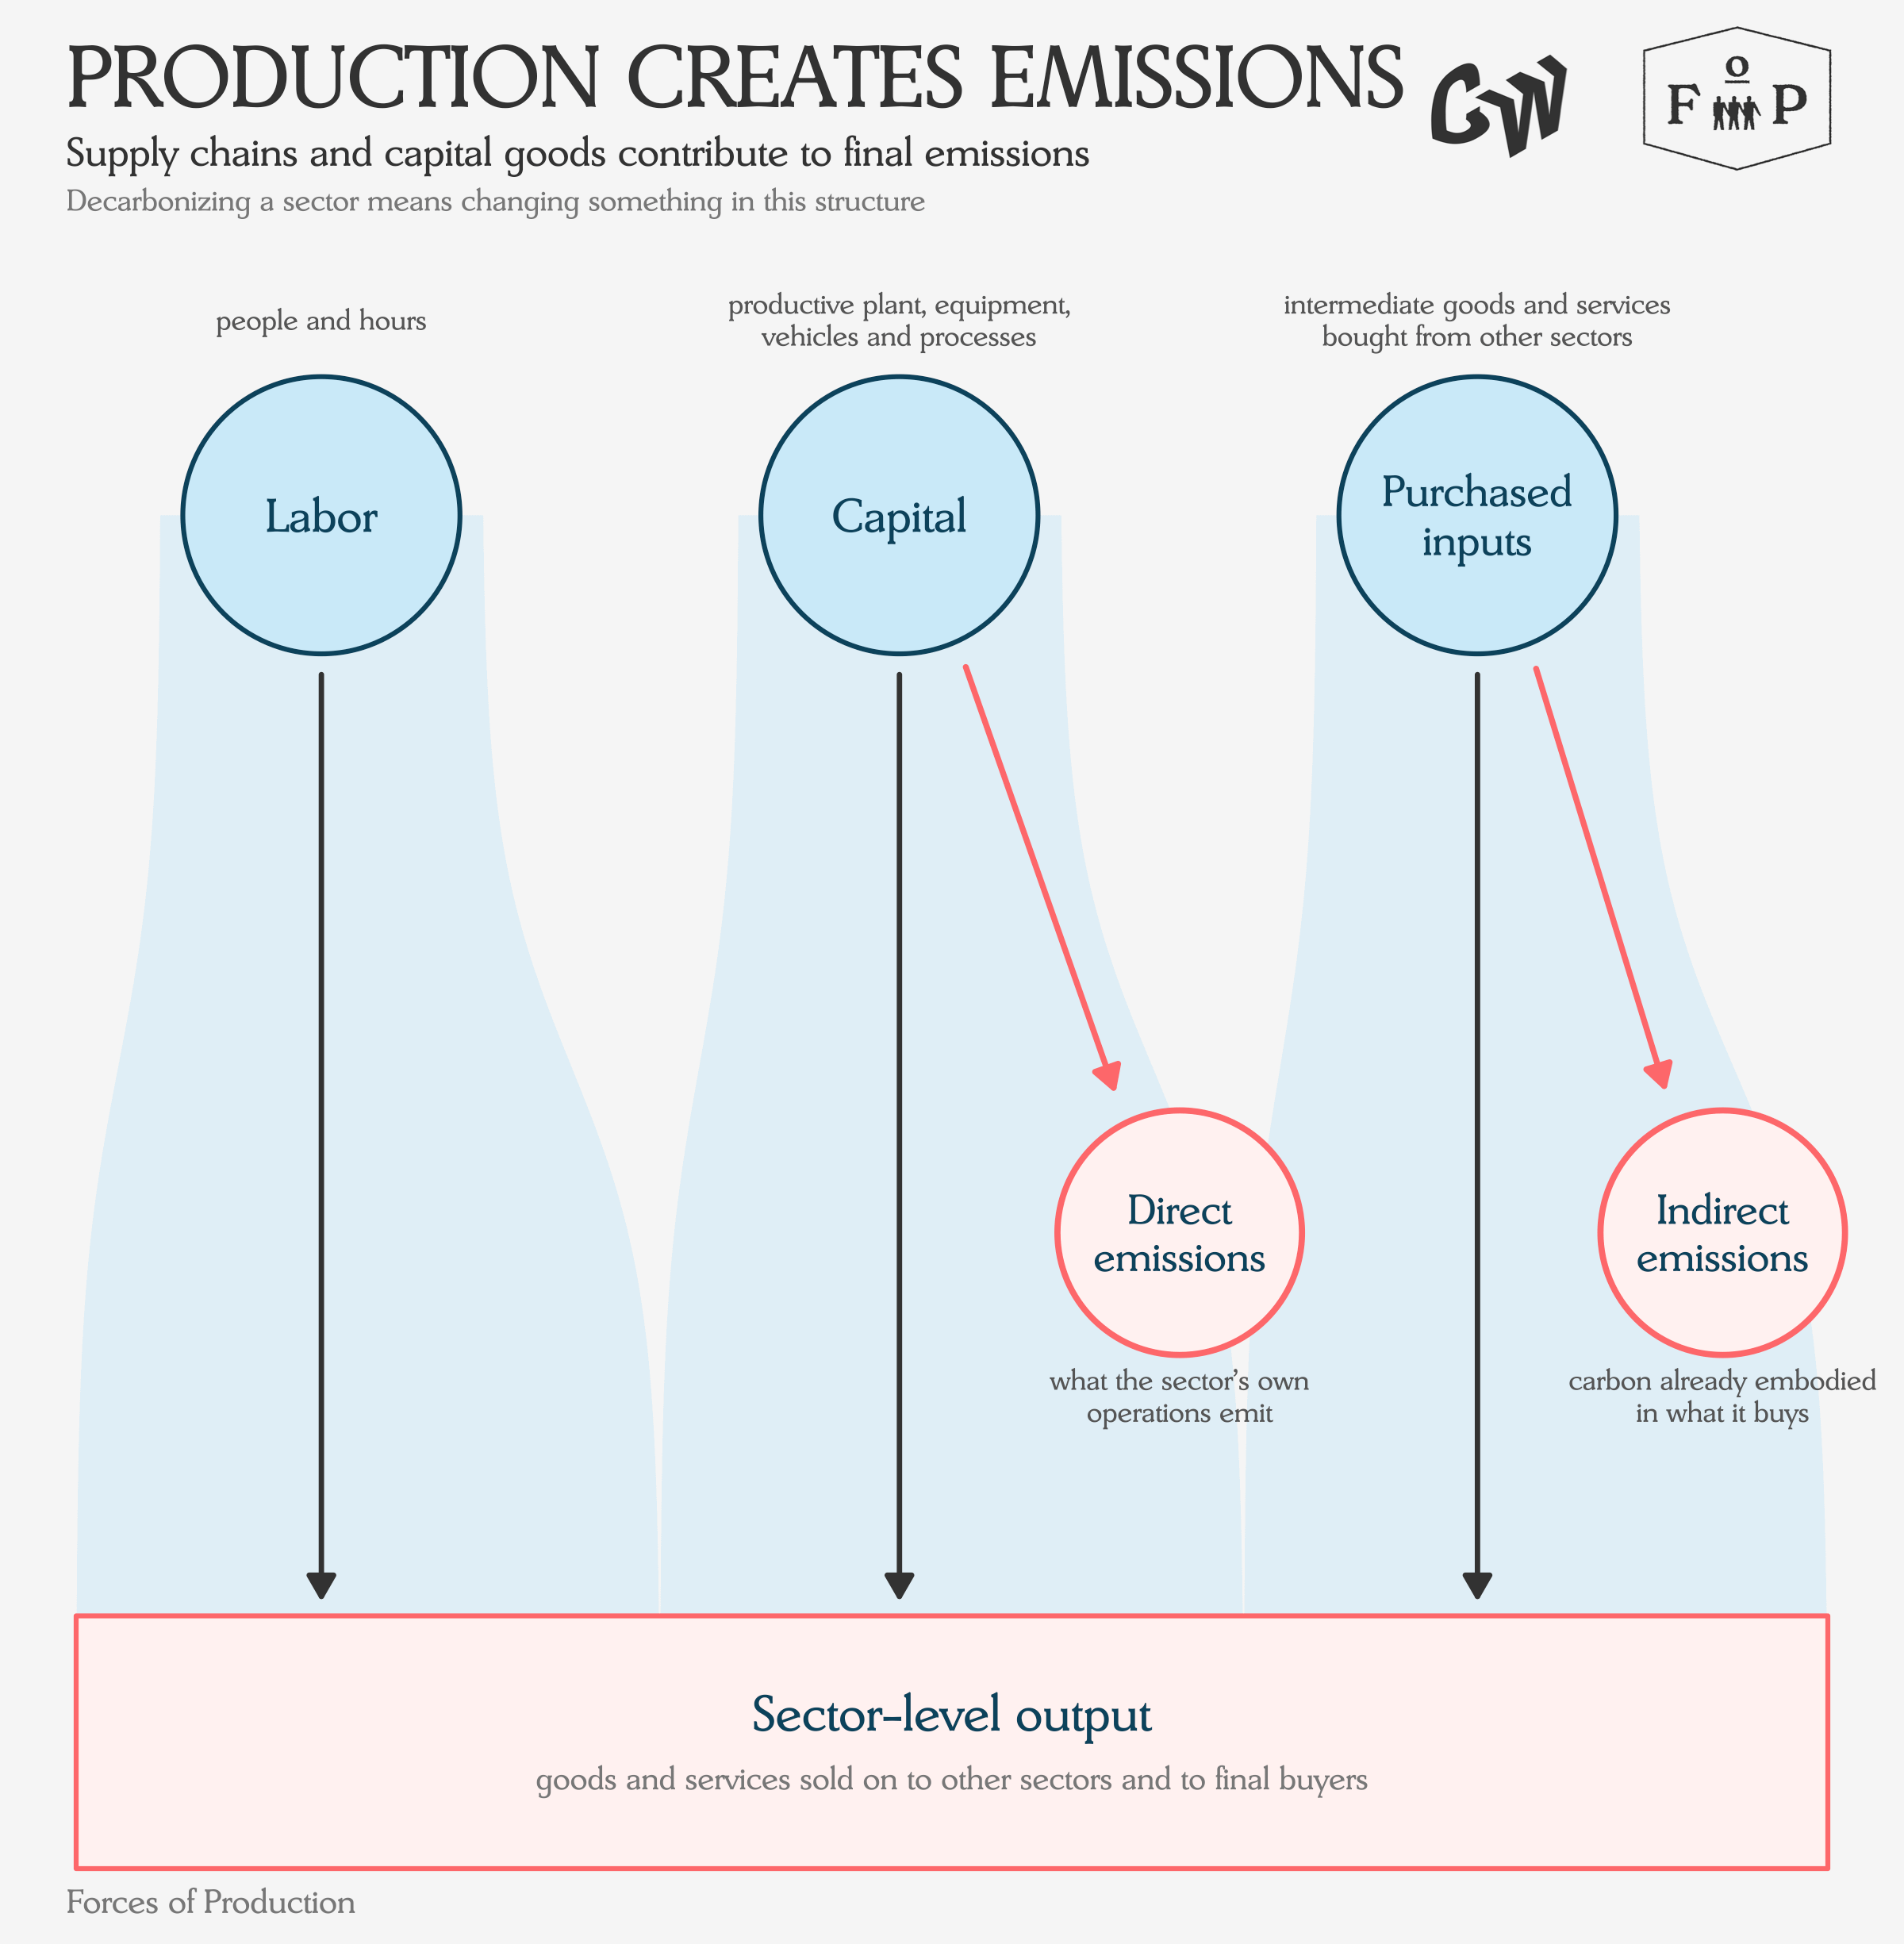
Since these Direct and Indirect emissions happen at different stages in the production process, the economic project of decarbonization will have to coordinate them in different ways. As the modelling technique of one of our heroes at Forces of Production — Faye Duchin — shows, a process of production is a kind of “recipe” that firms use, and which can be changed to a different “recipe” which uses different capital goods or purchased inputs.
Direct emissions are straightforward to mitigate from an economic perspective: replace the machinery or processes involved in the step in the production process that emits carbon with machinery or processes that do not. Removing Indirect emissions is a more economically complex process, as sectors must change their “recipe” of production more fully, rewiring their supply chains and inputs specifically to exclude upstream emissions.
We advocate for the Productive State approach specifically because it offers tools to engage these two tasks directly and distinctly. Bringing the state to the supply side as both a producer and coordinator unlocks tools that allow policymakers to guide supply chains to mitigate Indirect emissions while simultaneously making supporting investments in reducing Direct emissions. Sequencing is critical to decarbonization, as are the Productive State institutions of the federal Power Authority and Public Investment Authority which unlock and channel the administrative capacity necessary to deliver real change.
To see how endemic these Indirect emissions are, we can look at them using a very aggregated form of the input-output table. This allows us to track which sectors pass carbon to others visually.
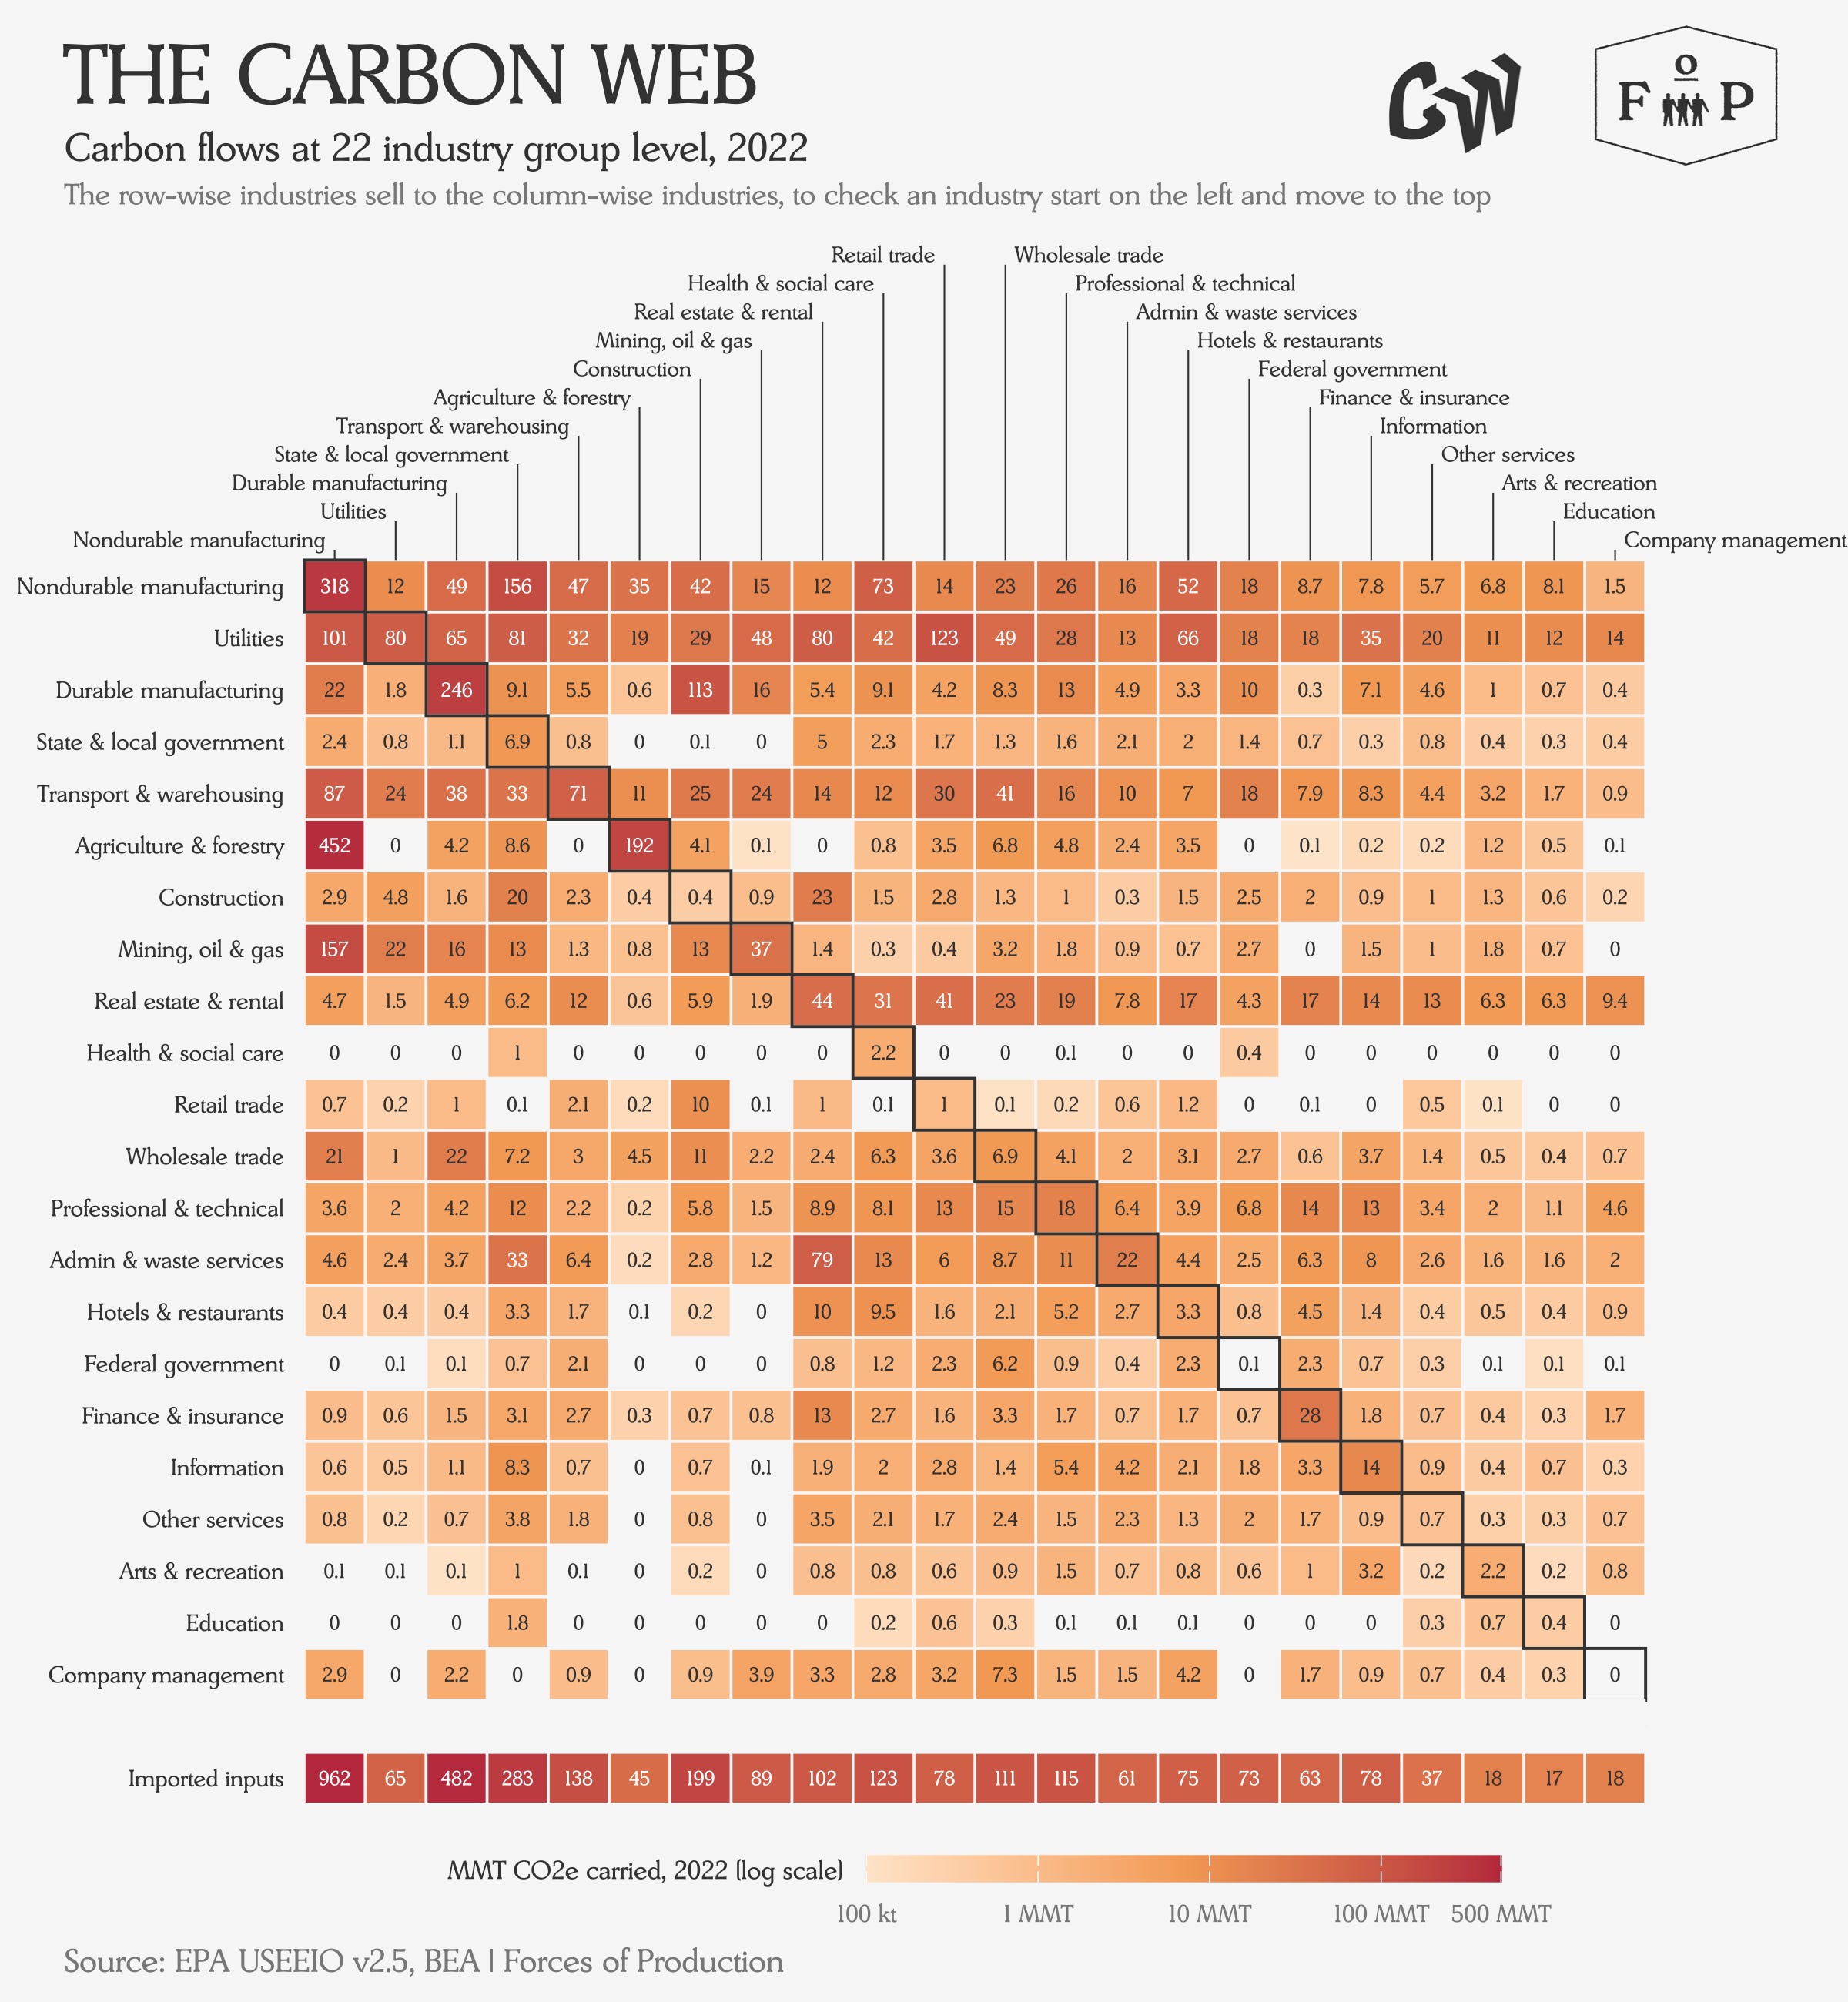
(If readers are interested in blown-up versions of the much larger — and much less legible — disaggregated versions of the table above, sound off in the comments and I will make them available!)
In fact, looking at the sector level in terms of direct versus indirect carbon emissions radically changes the leaderboard, which will impact the sectoral prioritization, strategy, and sequencing of decarbonization.
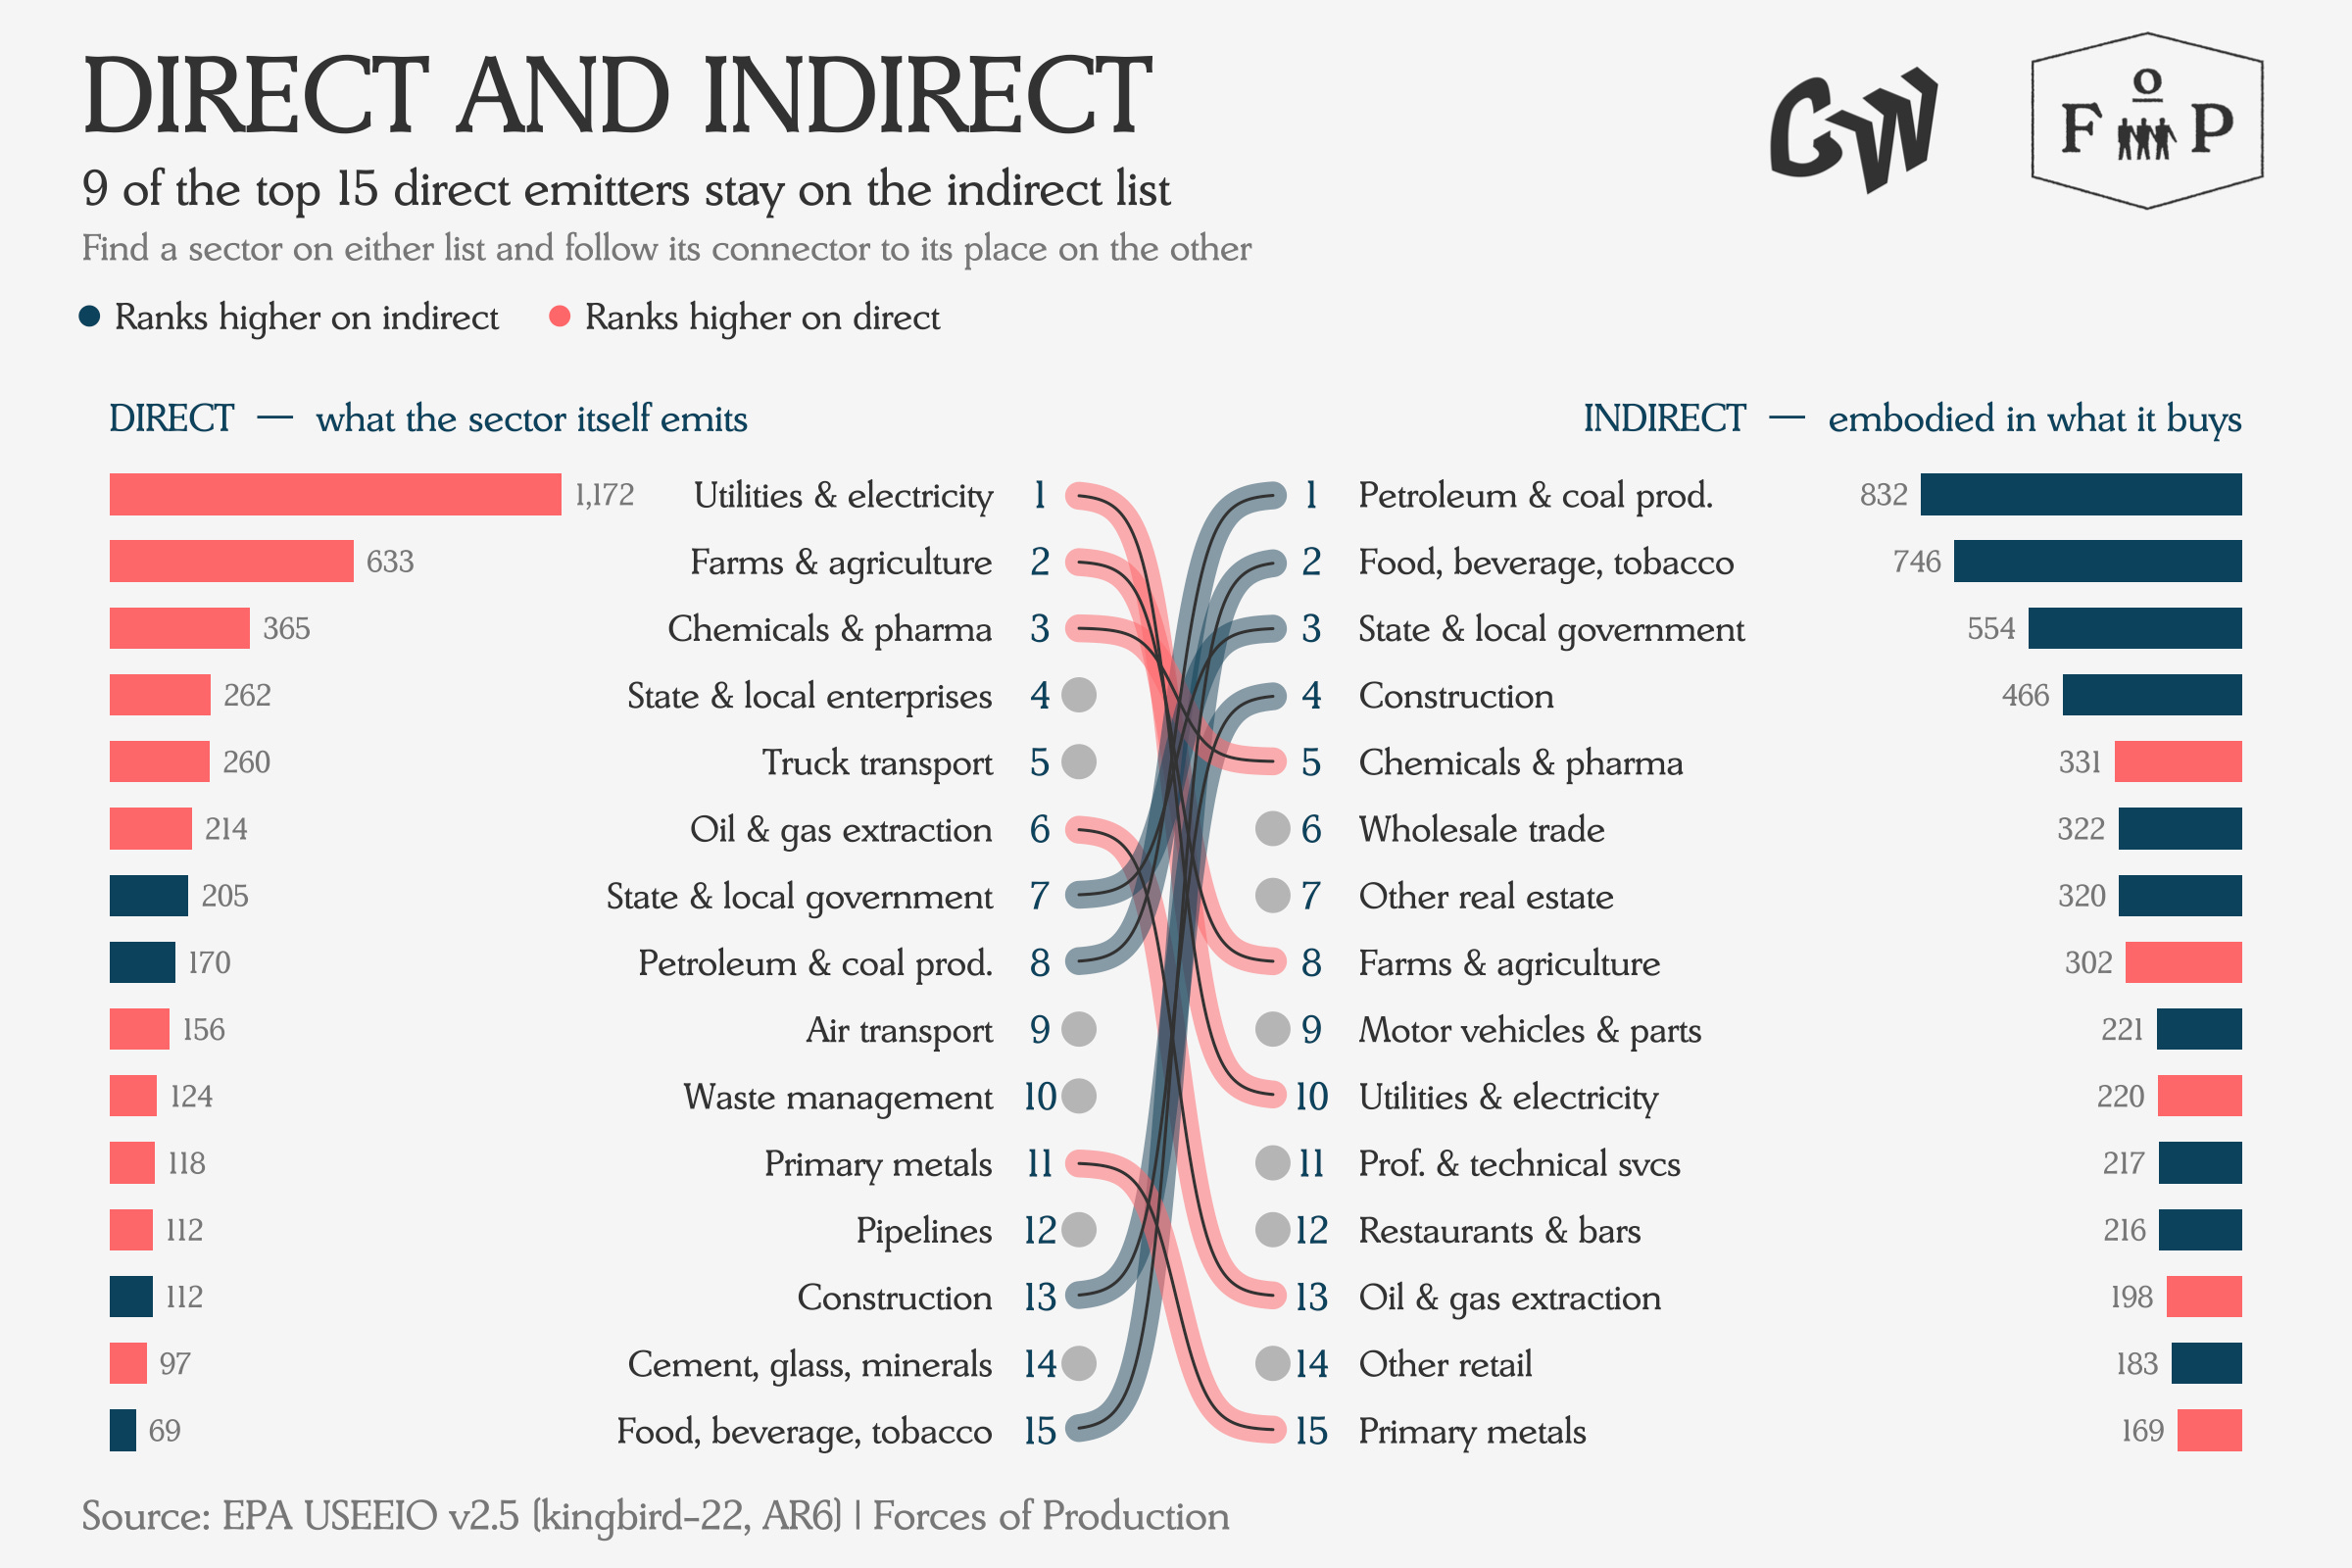
But how do we know which leaderboard is the most important?
Prioritizing Decarbonization
Looking at decarbonization as a macroeconomic task, the prioritization and strategy are far from obvious, even through a sectoral lens. Each sector is enmeshed in a web of changeable relations, and must be coordinated across fiscal, economic, physical, financial, scientific, and technological dimensions. The institutions driving decarbonization need to be able to take each of these into account.
Yet having so many degrees of freedom gives us significant flexibility to explore different strategies for prioritizing public investment. Different criteria produce different rankings for intervention across sectors, and today we will show how these different goals can be combined to produce a more macroprudential approach to the supply side.
In today’s newsletter, we are going to look at the five different approaches to see what they reveal about the carbon structure of the supply side, and the different tradeoffs involved in prioritization.
Biggest Direct Emissions Sources
The natural first move is to target the sectors with the biggest direct emissions. On the one hand, these sectors are the largest source of emissions generally, and so make sense to target. On the other hand, sectors with large direct emissions are also conceptually easier to intervene in. Rather than reworking whole supply chains, or coordinating changes in upstream inputs, a program of decarbonization in these sectors only demands investment in new capital goods to support new production processes.
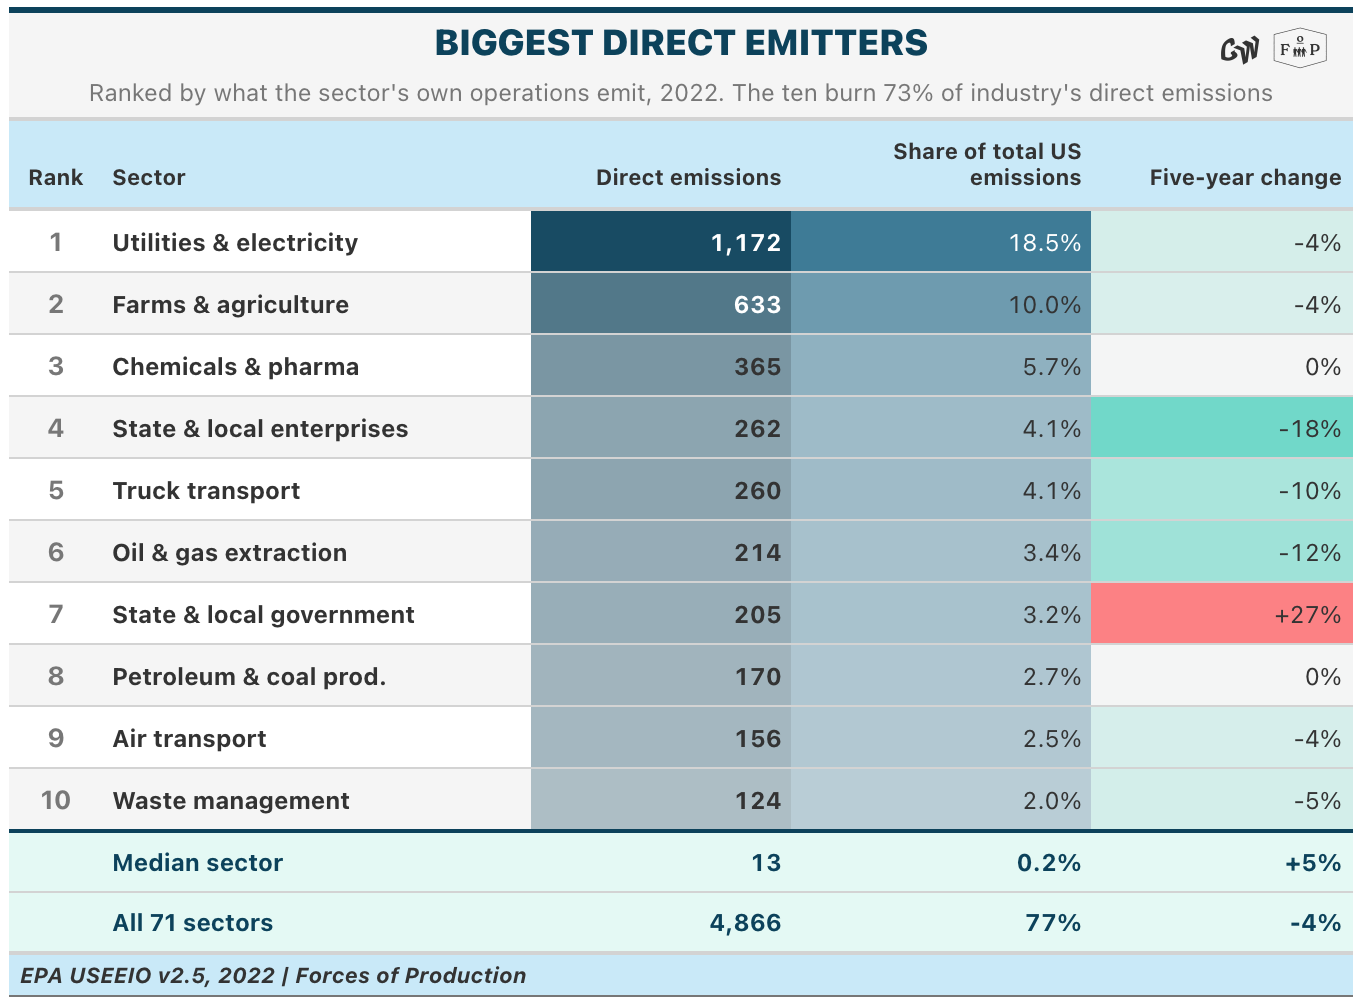
Through this lens, we see mainly sectors which burn significant fossil fuels or whose production processes involve chemical or organic processes that emit significant carbon. Direct emissions from the sectors above amount to over 50 percent of total emissions from the supply side.
However, we are also worried about the indirect emissions passing through the supply chain as well, which motivates our next ranking.
Most Common Indirect Emissions Sources
Now, if targeting the largest direct emitters was the most direct way to tackle direct emissions, the way to target indirect emissions is by looking at how many other sectors are connected to a given carbon-emitting sector. Decarbonizing a supplier cuts every buyer’s carbon footprint at once, and the more general supplier, the broader the cut.
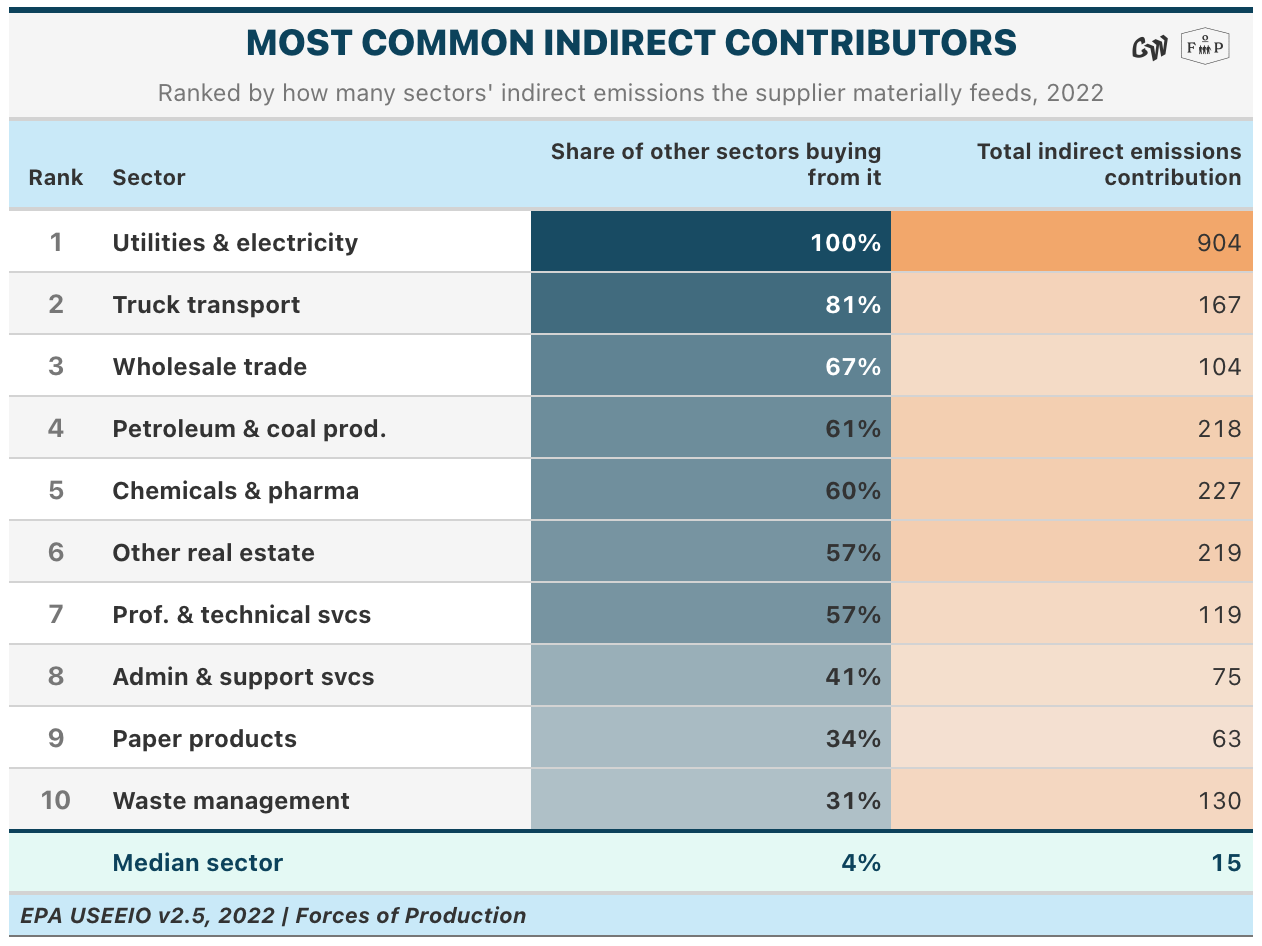
We see many of the same sectors as from the Direct Emissions leaderboard, but with some new ones, especially Wholesale Trade and Paper Products. At the same time, the median carbon emissions flow between sectors for most of the industries above are quite small.
Rather than focusing on connectivity, our third ranking tracks the economic contribution of a given sector’s emissions by pricing out the value-add of a sector in carbon terms.
“Worst Deal” Sources
What we mean by “worst deal” is really the least economic activity for the most carbon emissions. In these cases, we would expect to see sectors with very high absolute emissions, but also sectors which are high emission relative to their economic size. These sectors have a good case for investment and intervention to reduce the carbon intensity of production.
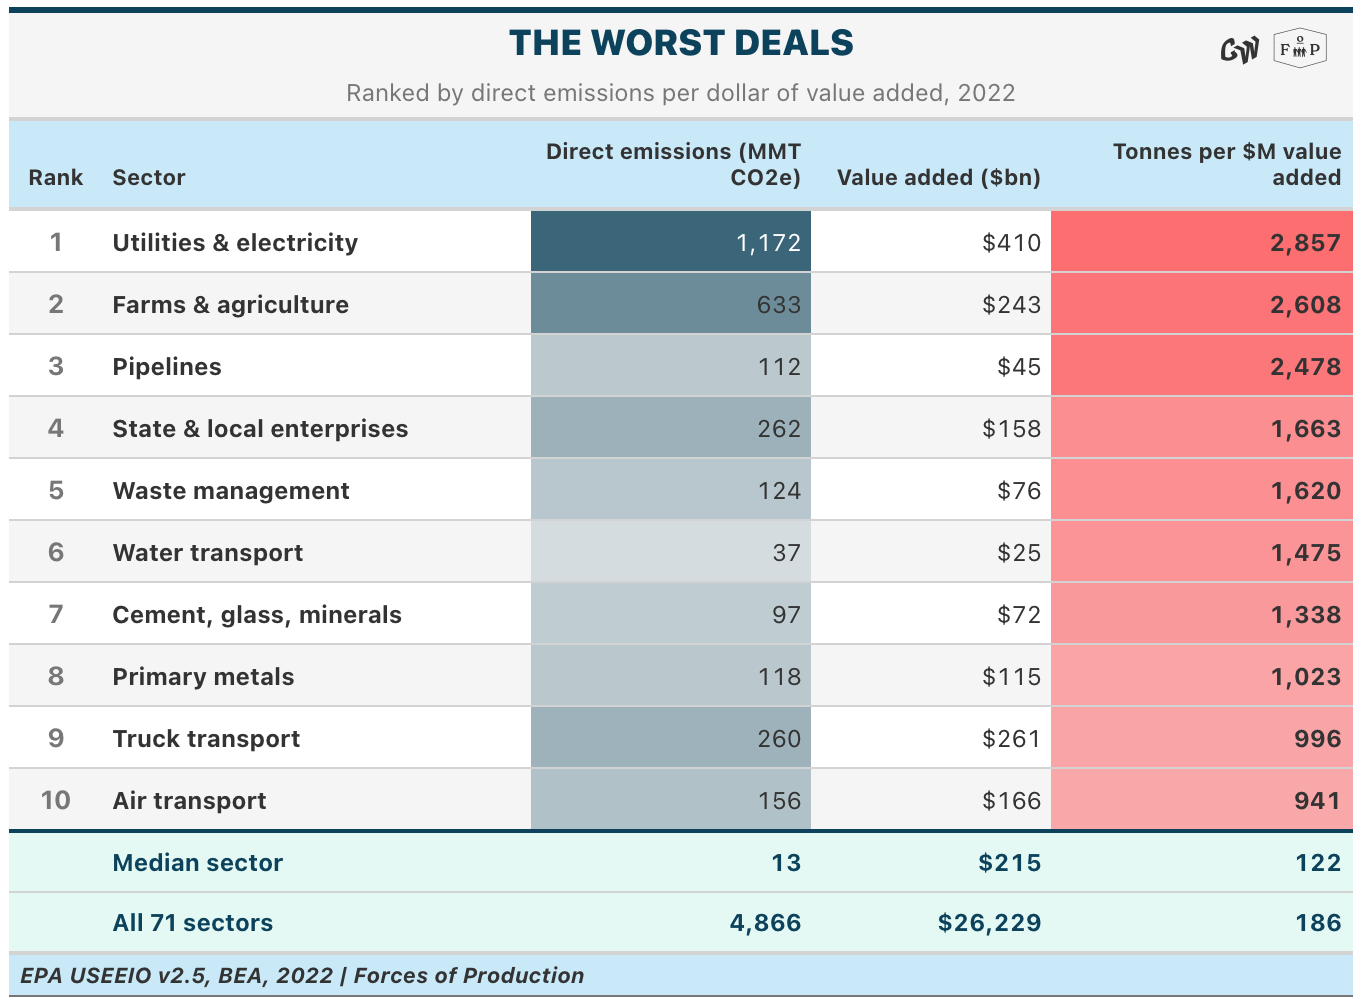
Many of the usual suspects show up again — Farms and Petroleum and Coal Products are near the top of most rankings — but we see some new sectors in Primary Metals and Cement, Glass, and Minerals.
The next ranking moves from a flow measurement — value added over a period — to a stock measurement, comparing emissions from a given sector to the estimated current cost of the capital stock in that sector.
Smallest Investment Sources
Most attempts to price carbon so far have focused on a consumer-side social cost of carbon, based on a tax to shift production by shifting consumption. Yet for a Public Investment Authority, the more interesting measure is likely to be an investment-side social cost of carbon which prices ongoing emissions relative to the cost of turning over the capital stock.
Now, this is admittedly a coarse estimate, as there are longstanding conceptual problems with measuring and aggregating capital, even within a given sector. Despite this, the measure gives an interesting first cut at a prioritization in terms of investment efficiency.
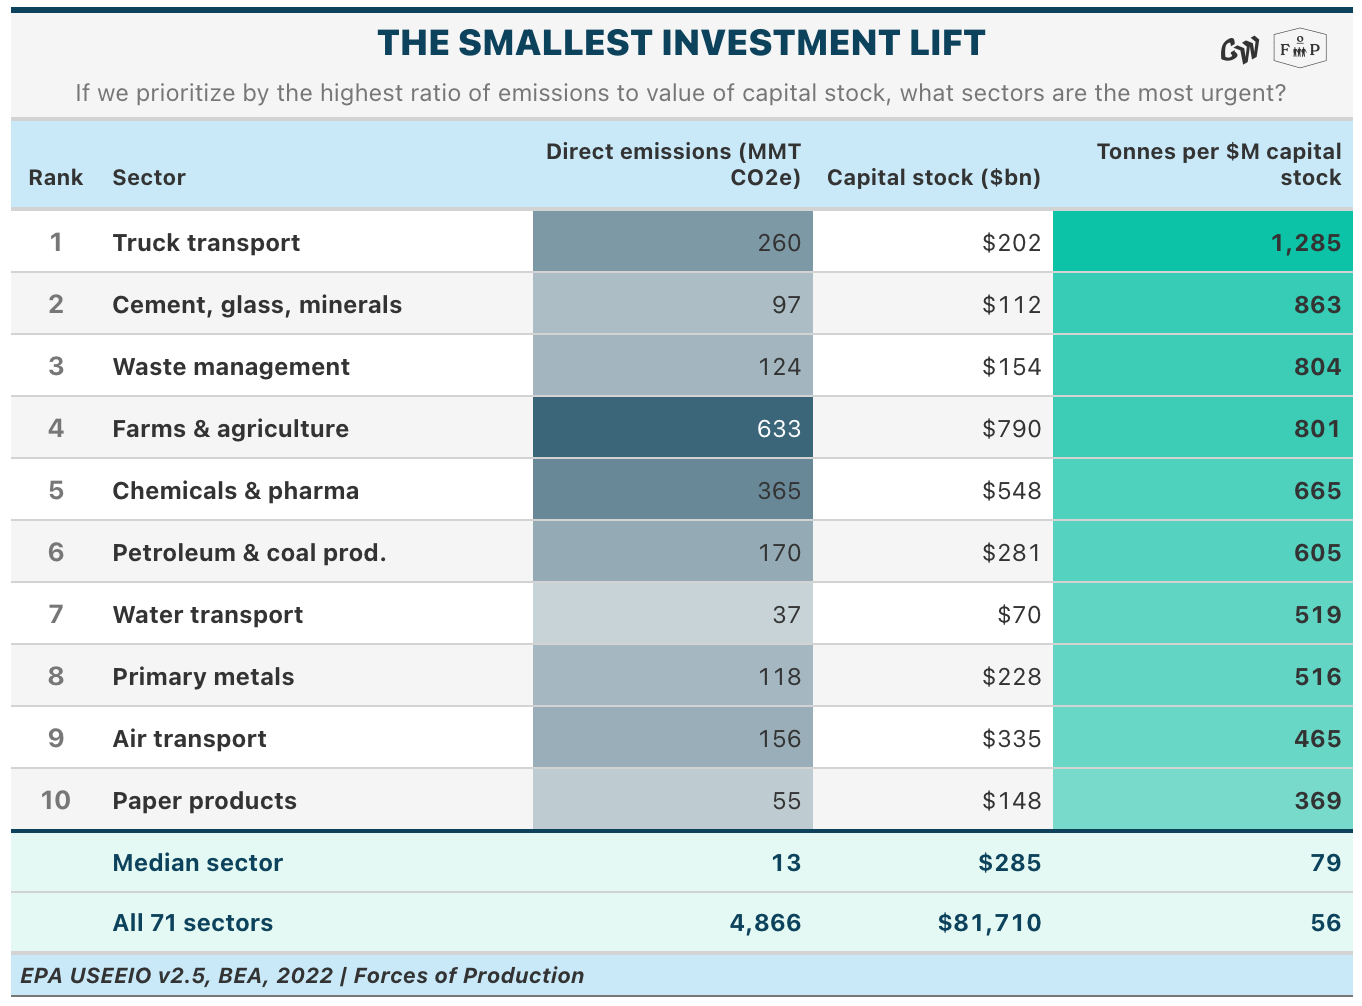
Yet even beyond the fiscal cost and efficiency of spending, we are also interested in how the sectors receiving public investment for decarbonization interact with the sectors driving our current affordability crisis.
Systemically Important Prices
We can also order these according to how important the prices in each sector are to both the broader economy and to households themselves. Public investment will increase capacity and reduce private costs in the sectors it targets, and the tools for targeting affordability are similar to those for emissions, with differing goals.
The goal of identifying and managing Systemically Important Prices is to keep exogenous shocks from bumping certain prices out of whack with the broader economy in ways that exacerbate inflation. The goal of decarbonization is to permanently eliminate an unpriced secondary output from the production structure of the supply side.
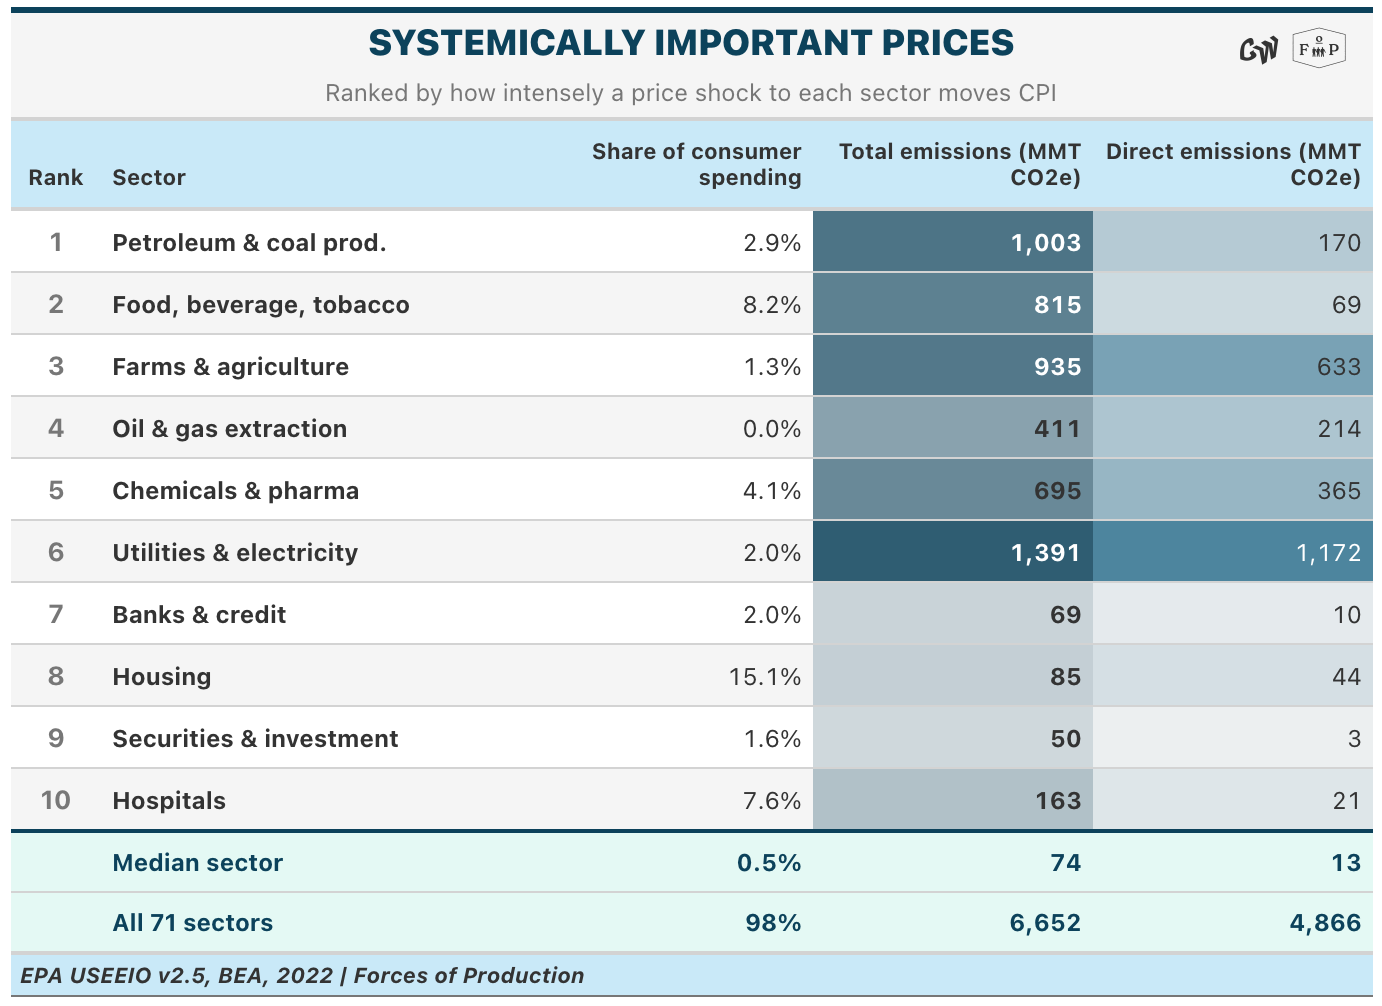
Very interestingly, we see many of the same major sectors over again, showing that decarbonization and affordability are closely linked goals.
Ranking and Intervening
Although each of these weightings produces a different ranking, they all show the same economy. Coordinating decarbonization will require significant decision-making leeway and policymakers to become comfortable with significant intervention on the supply side. Economic policy is a place where tradeoffs are coordinated, an understanding which The Productive State approach formalizes into new economic institutions.
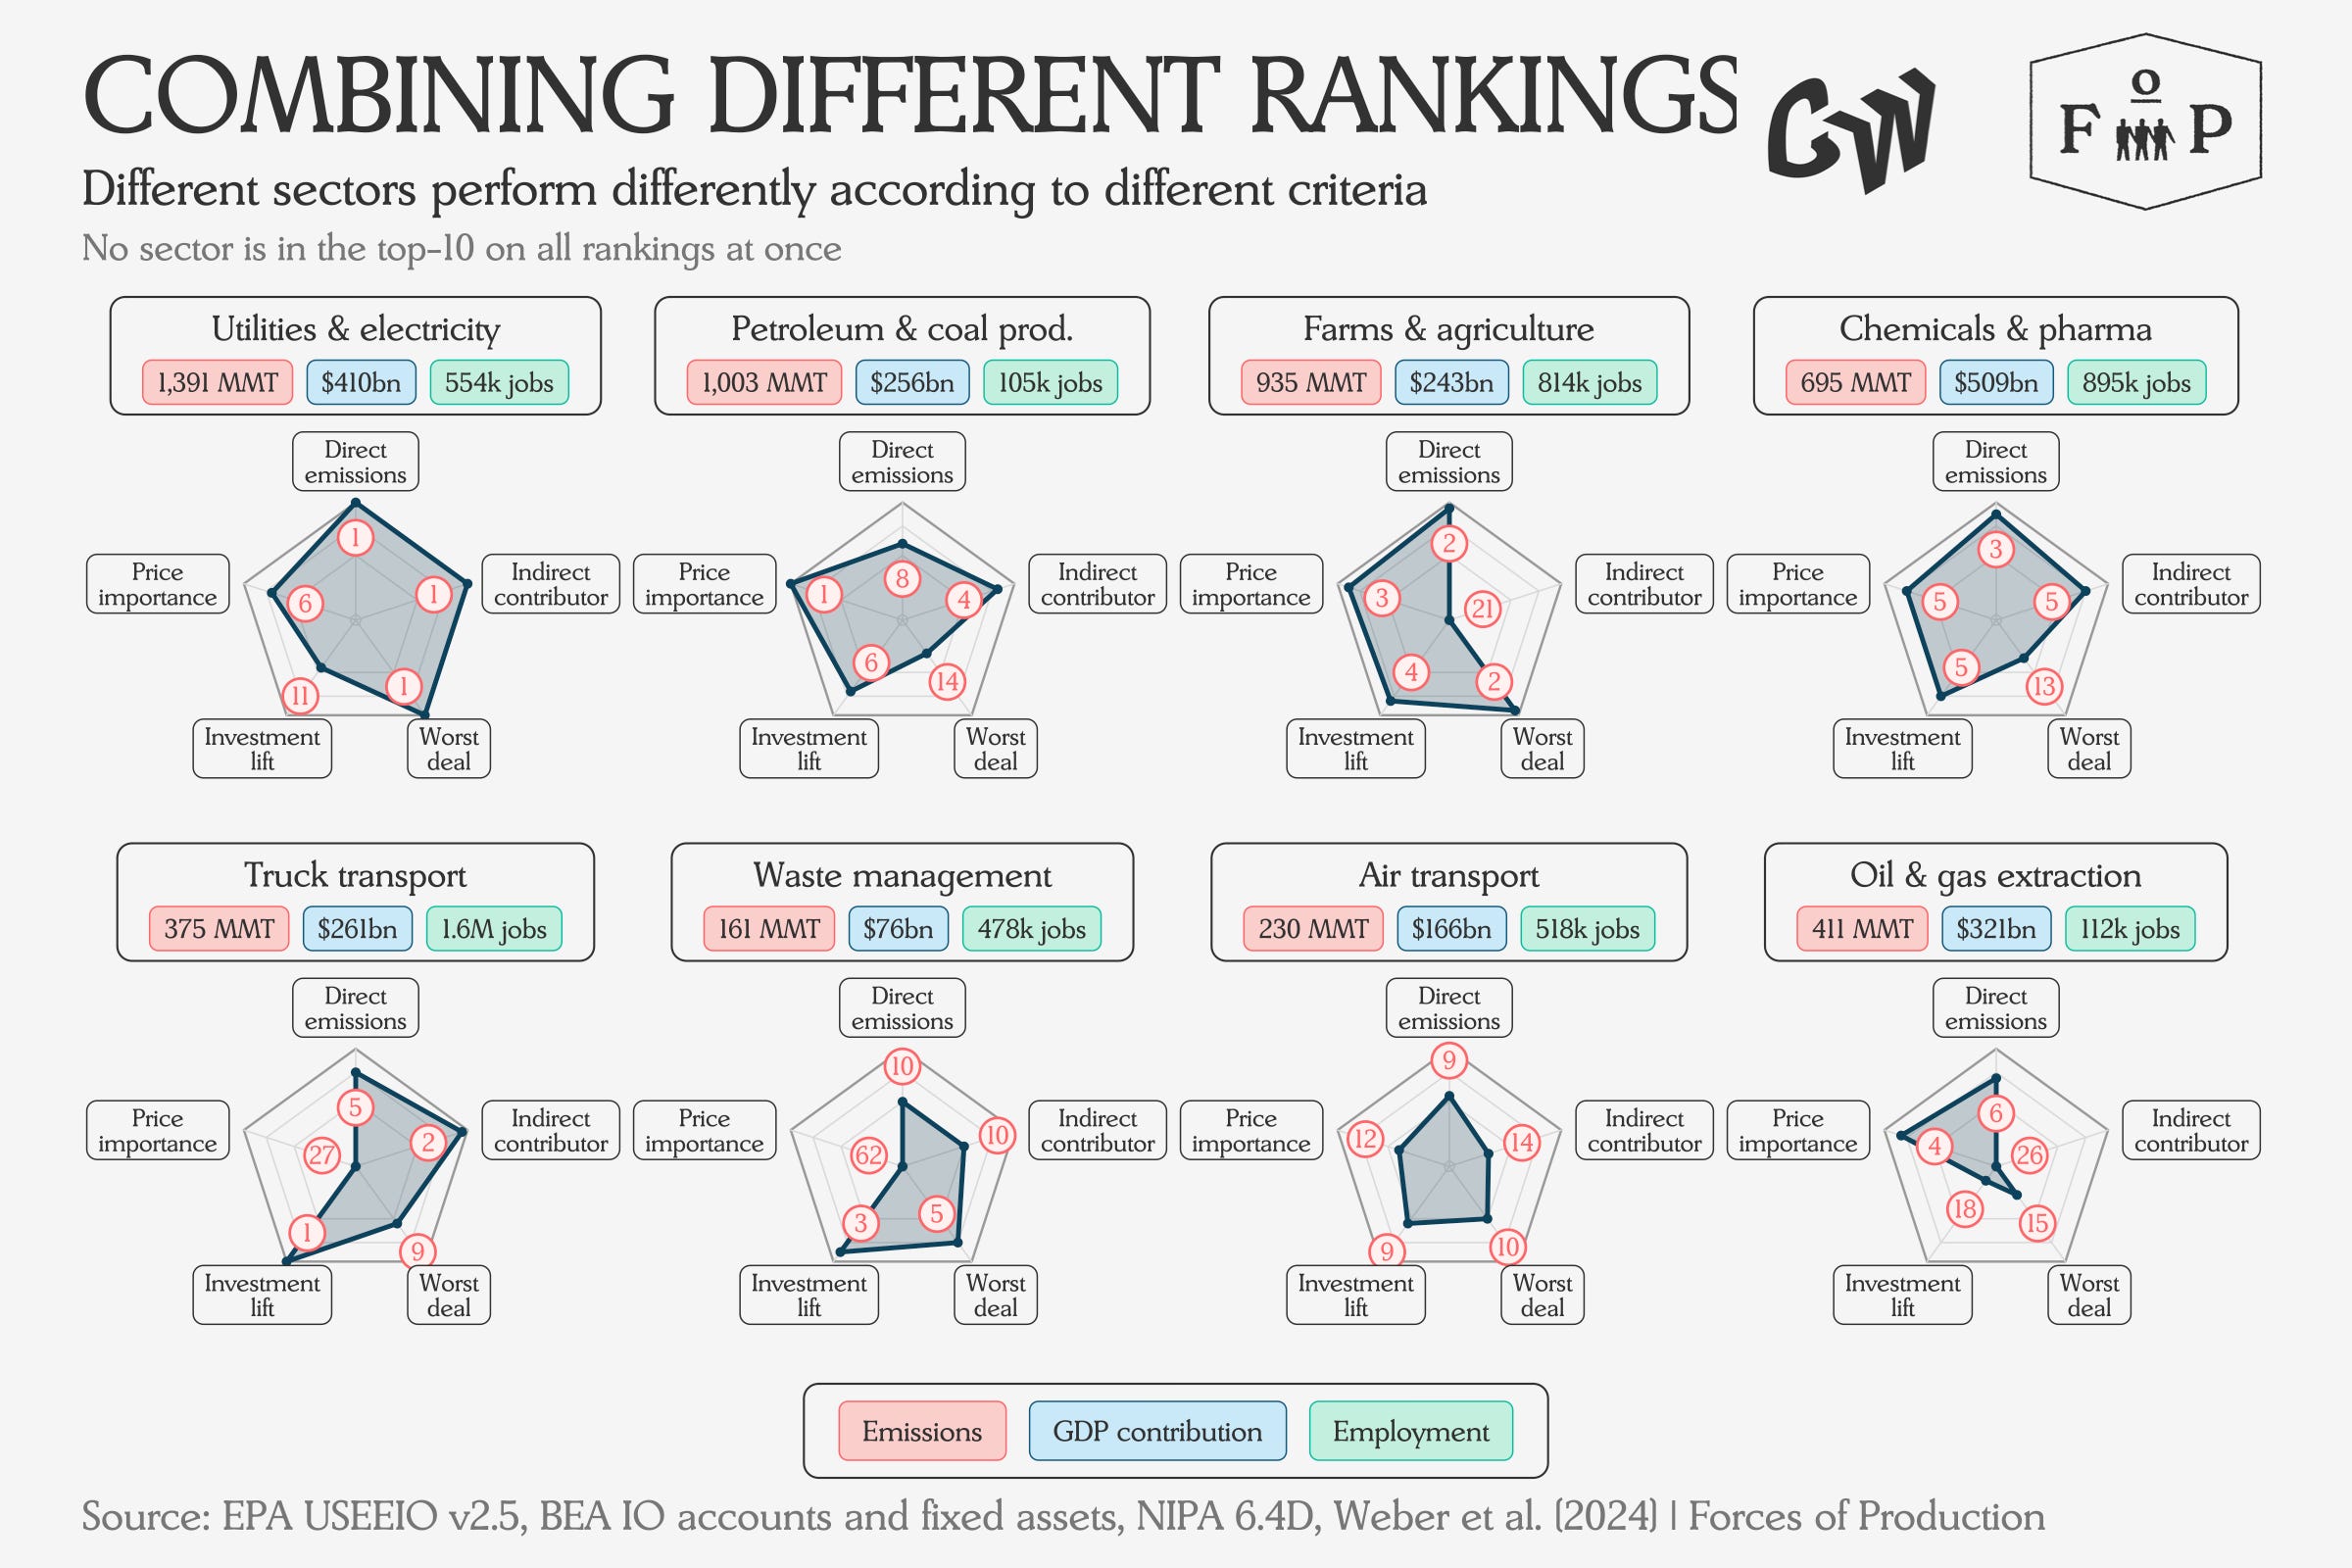
As the production structure changes and technology evolves, the project of decarbonization demands institutions that can address different emissions sources in economically appropriate ways.
A Public Power Authority can address the biggest universal emitter: utilities and electricity. However, fully decarbonizing utilities will only remove a quarter of all emissions. The rest is tangled up in webs of indirect emissions, where shifts in economic structure will require coordination and direct investment. If decarbonization investments are effective, they will change both direct and embodied emissions for a given sector, while also changing market prices and likely the broader production structure.
A Productive State that can take a properly multidimensional and macroprudential view of the supply side is a requirement for decarbonization. Where early government work on decarbonization focused on research to make the technology viable and the IRA sought to generate a green investment boom through a “derisking” approach, extensive public investment will be required to replace the billions of machines behind today’s emissions. This kind of task demands a unique and committed institution: a Public Investment Authority.
The Productive State approach aims at governing and stabilizing the supply lines that transmit indirect emissions, as well as funding the replacement of socially critical capital goods and infrastructure that currently emit too much carbon.
This Month’s Data
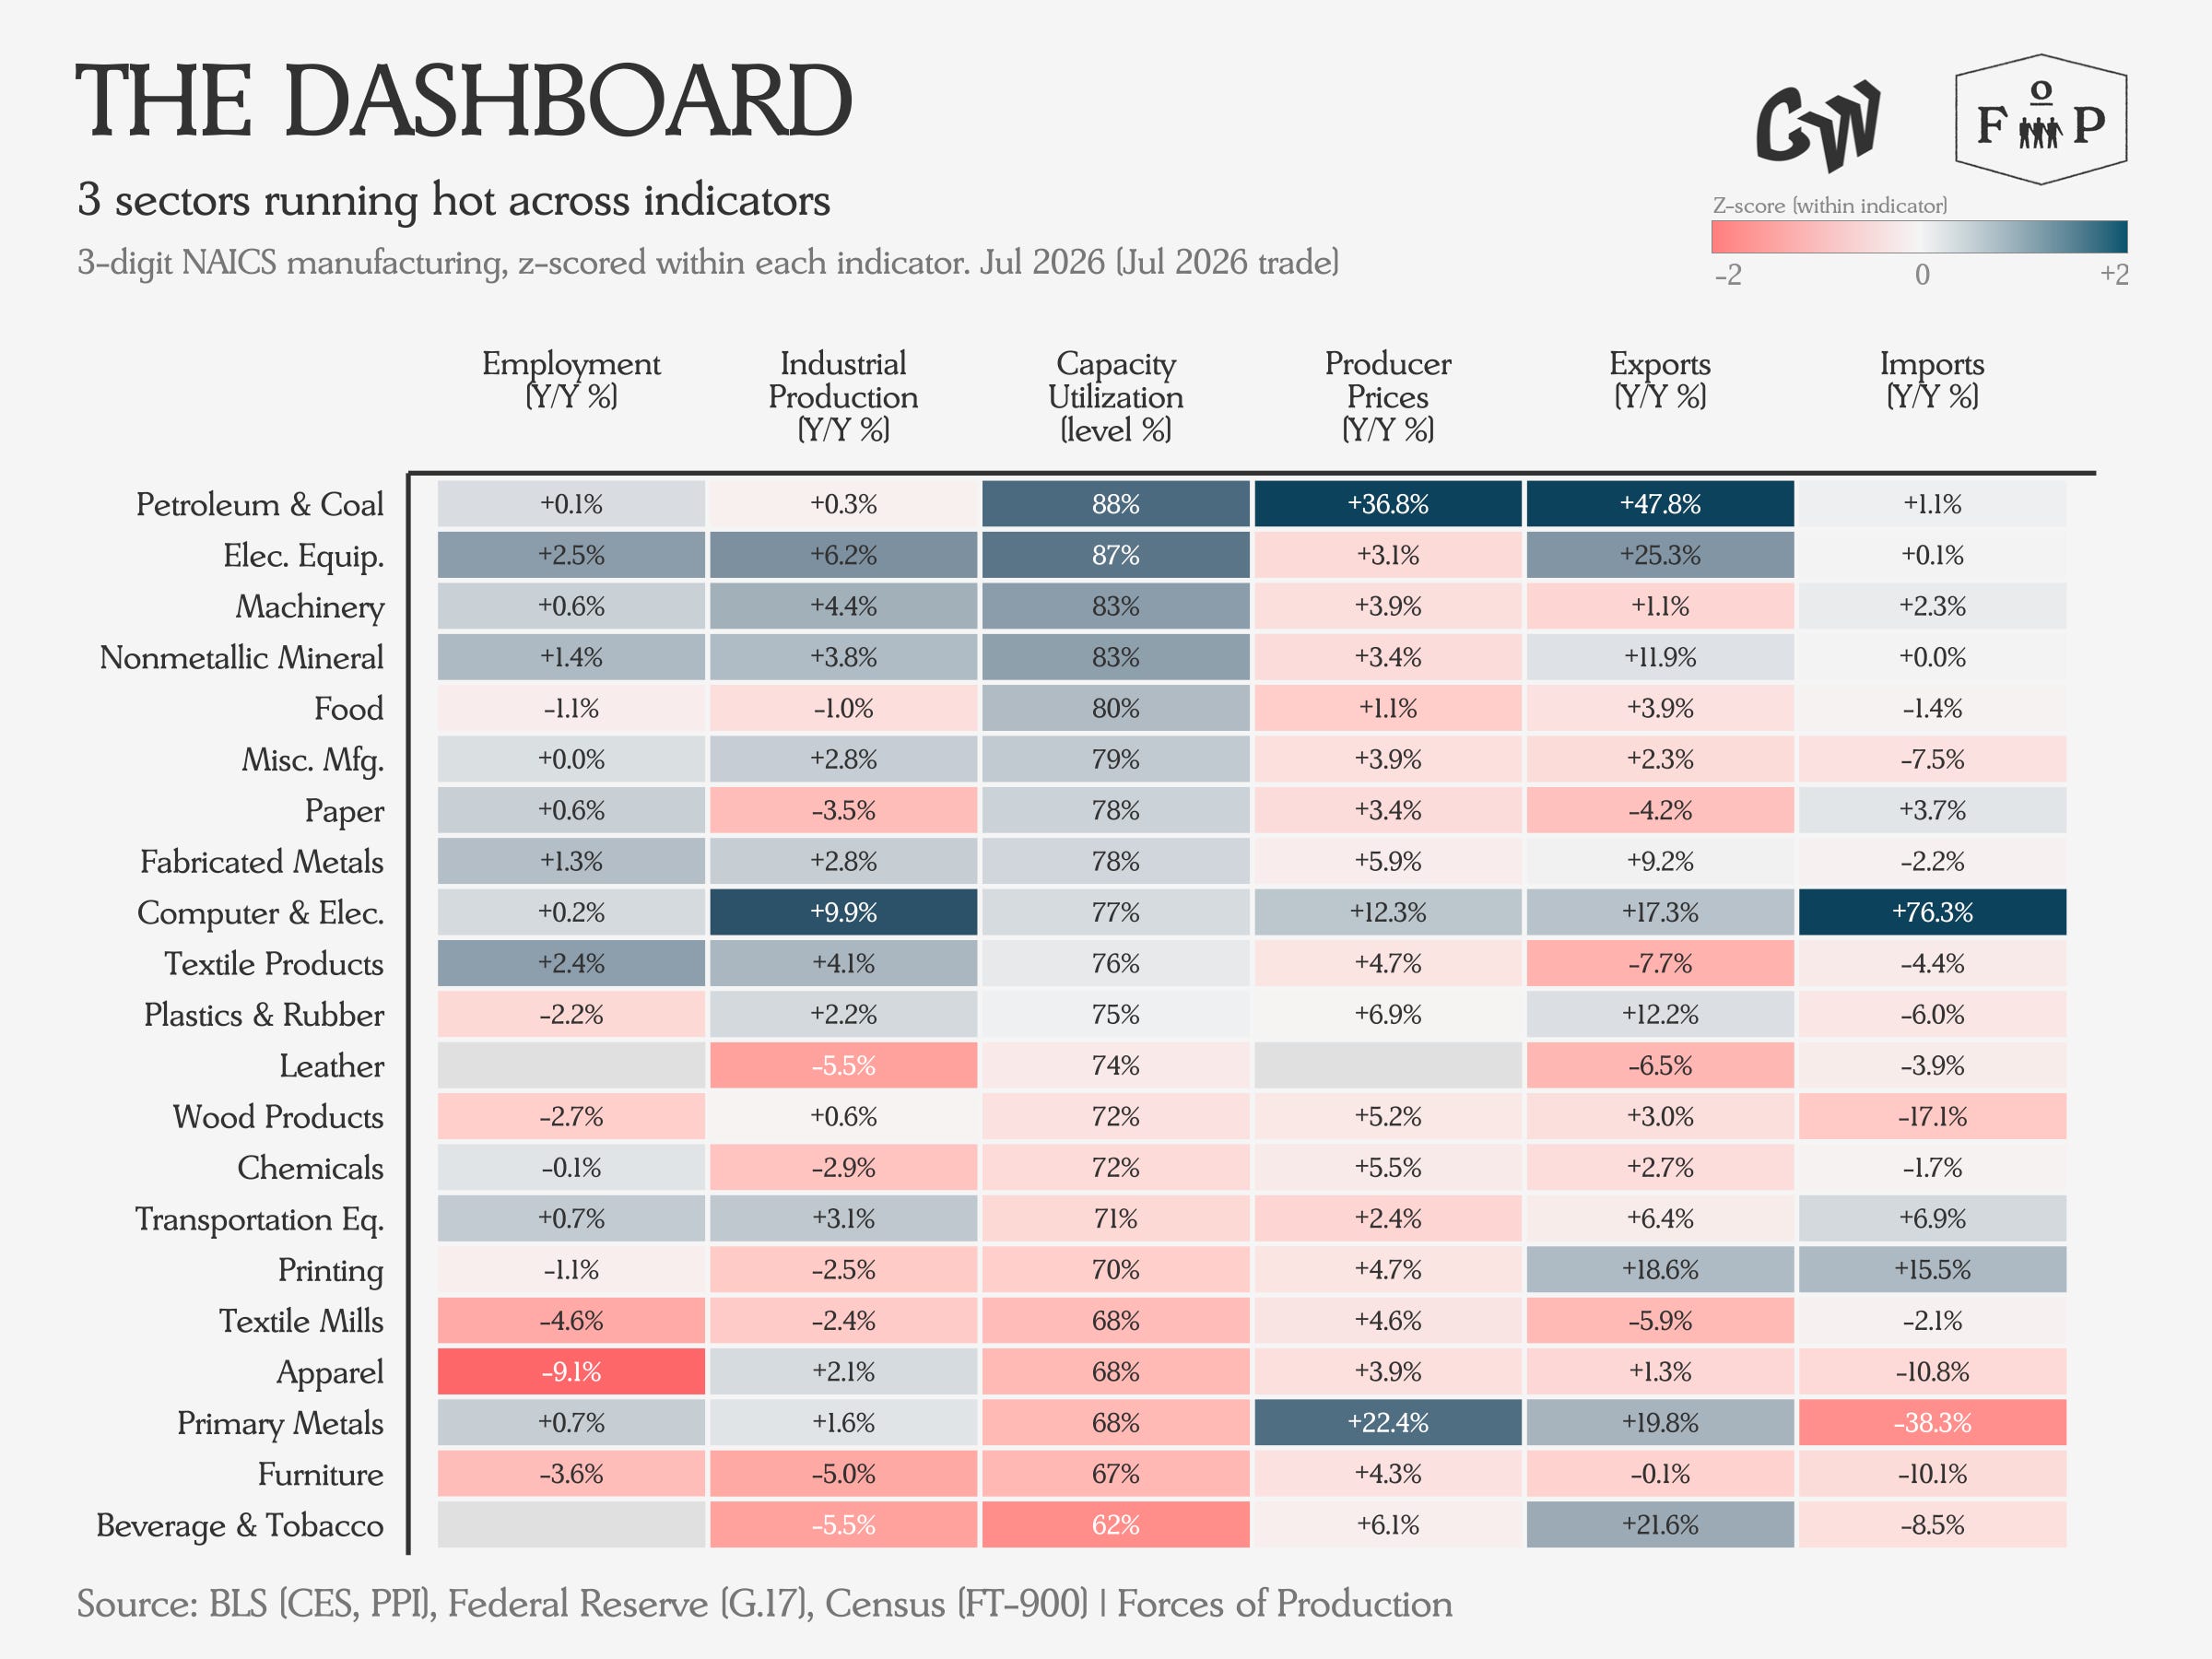
Looking across manufacturing, we see the same trends continuing from last month: outperformance in Electrical Equipment and Computer and Electronic Equipment, rising prices and tight capacity thresholds across the fossil fuel complex, and broad weakness outside of the chain linking Metals, Machinery, and Transportation equipment.
Employment
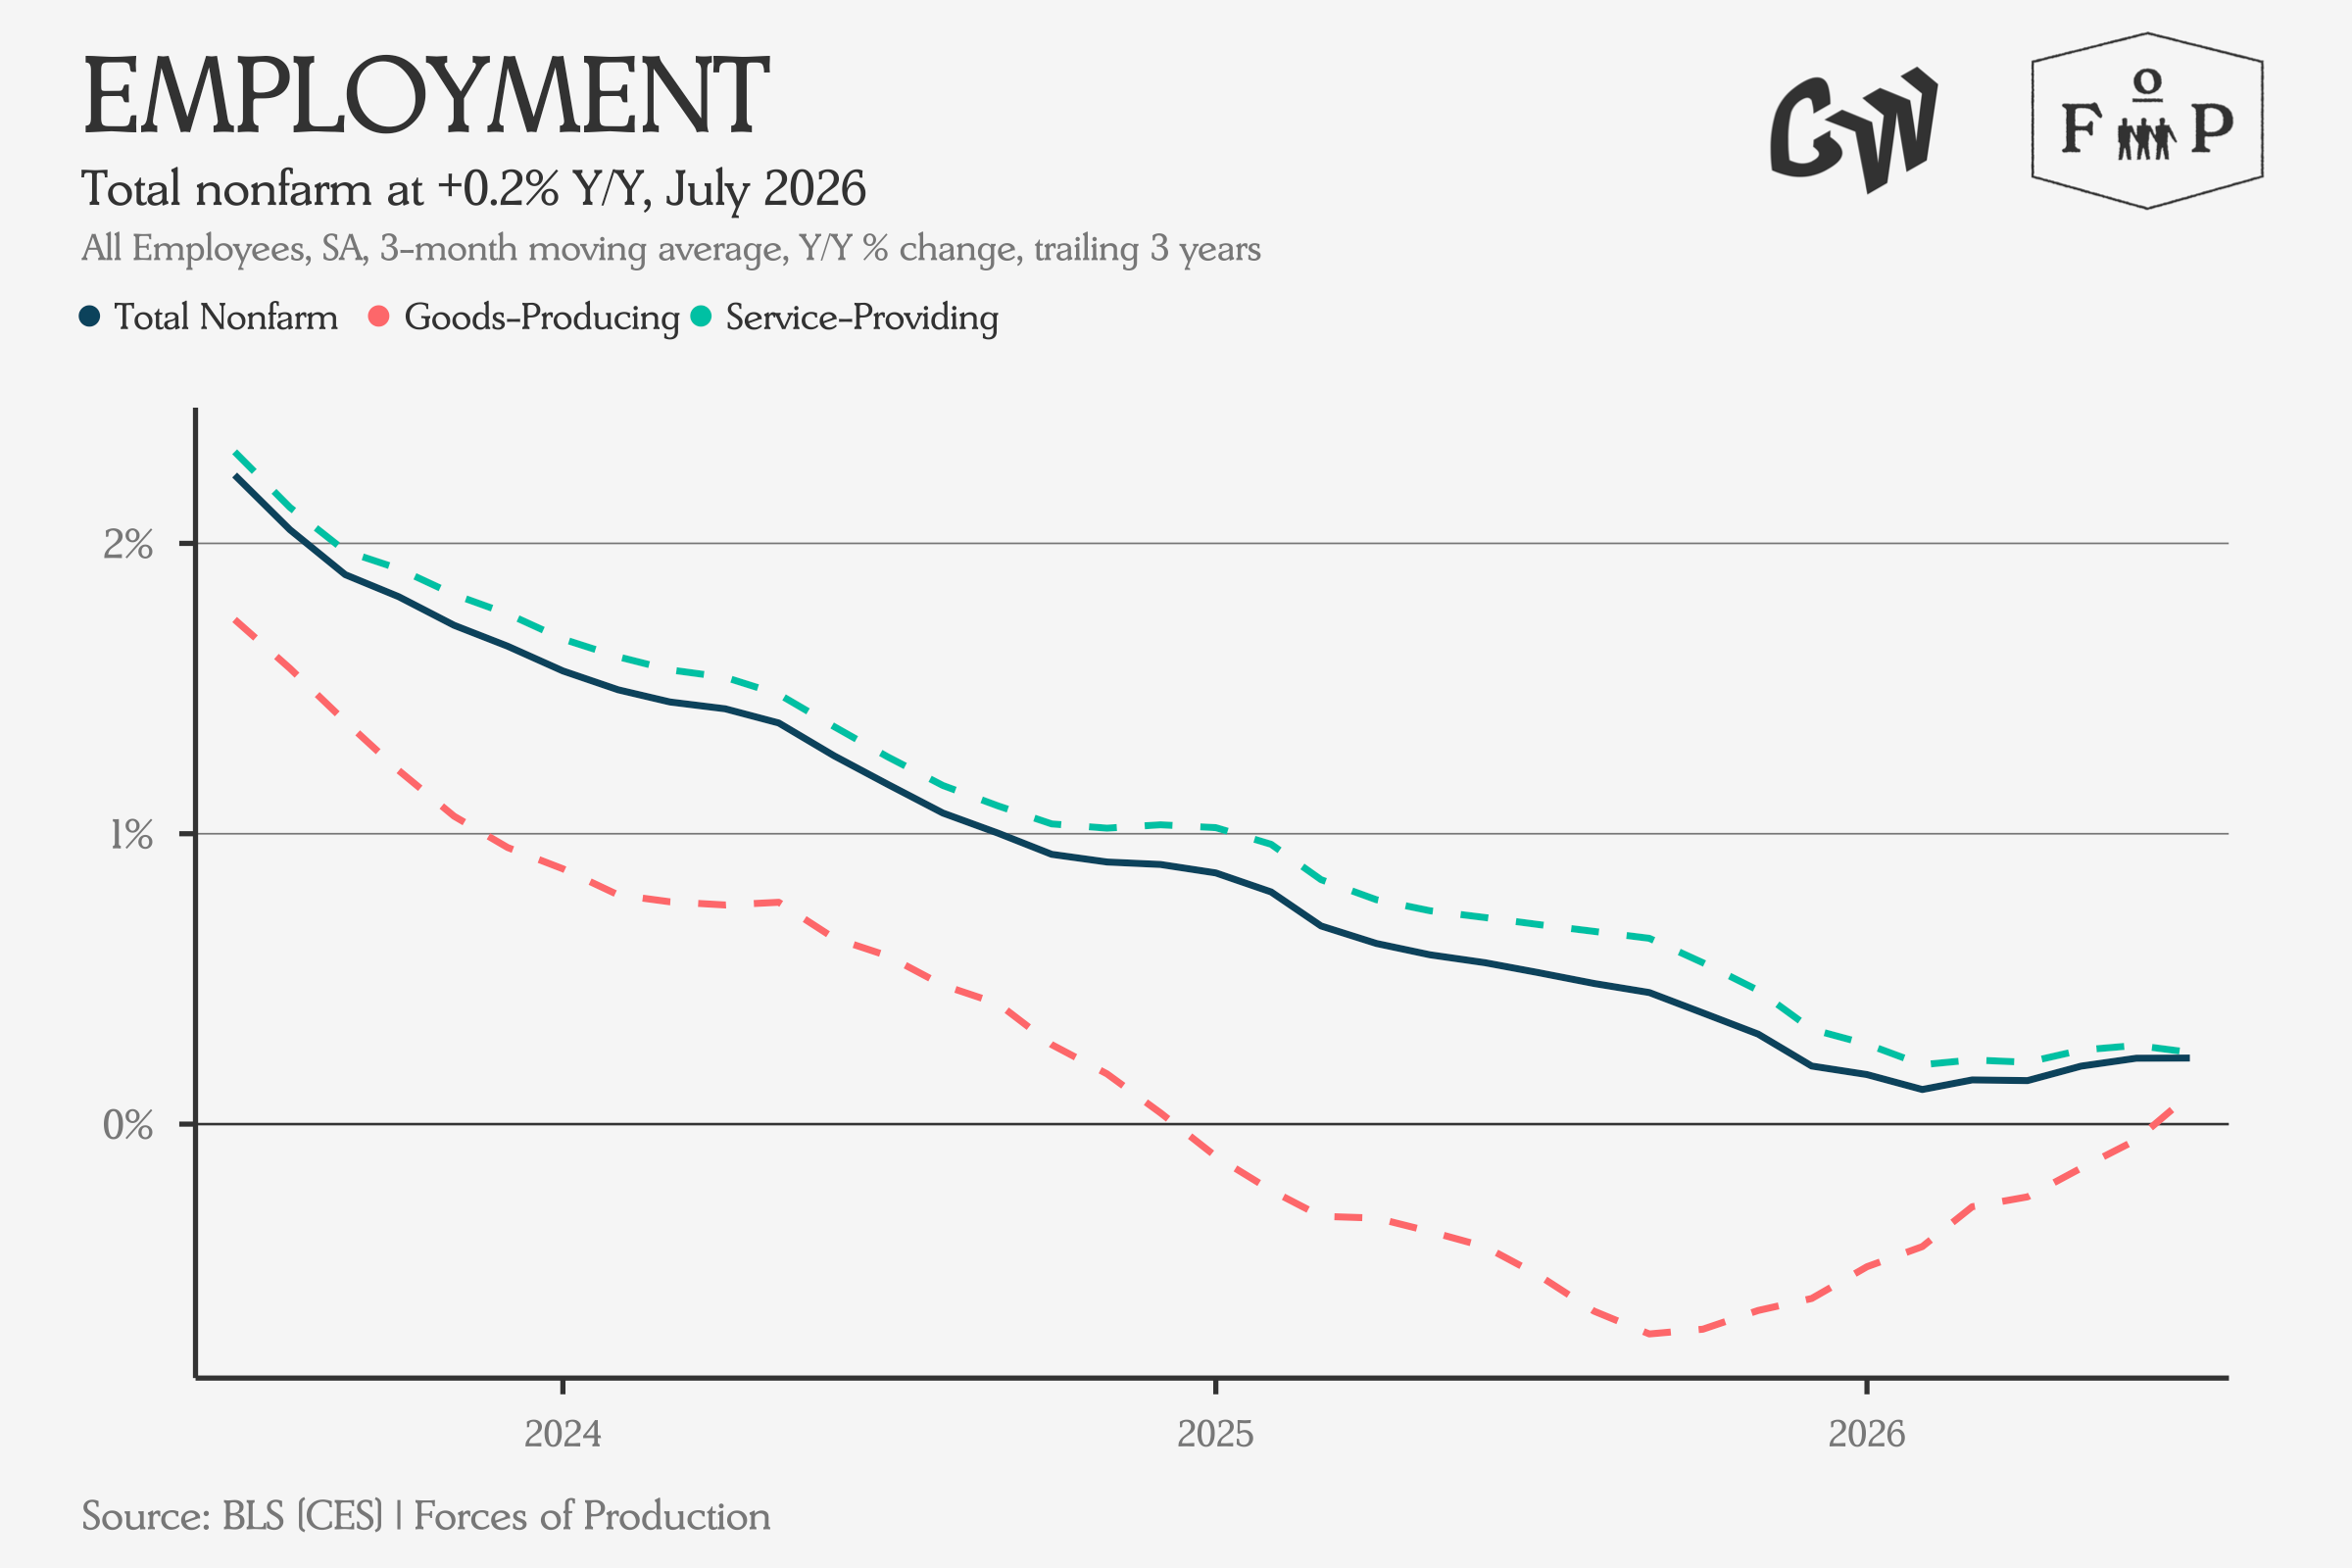
Employment fell unexpectedly in the July data month-to-month, but the drop was not large enough to affect the unemployment rate, and the year-over-year trend continues to show slow growth. For the first time in nearly two years, Goods-Producing employment notched a slight year-over-year gain.
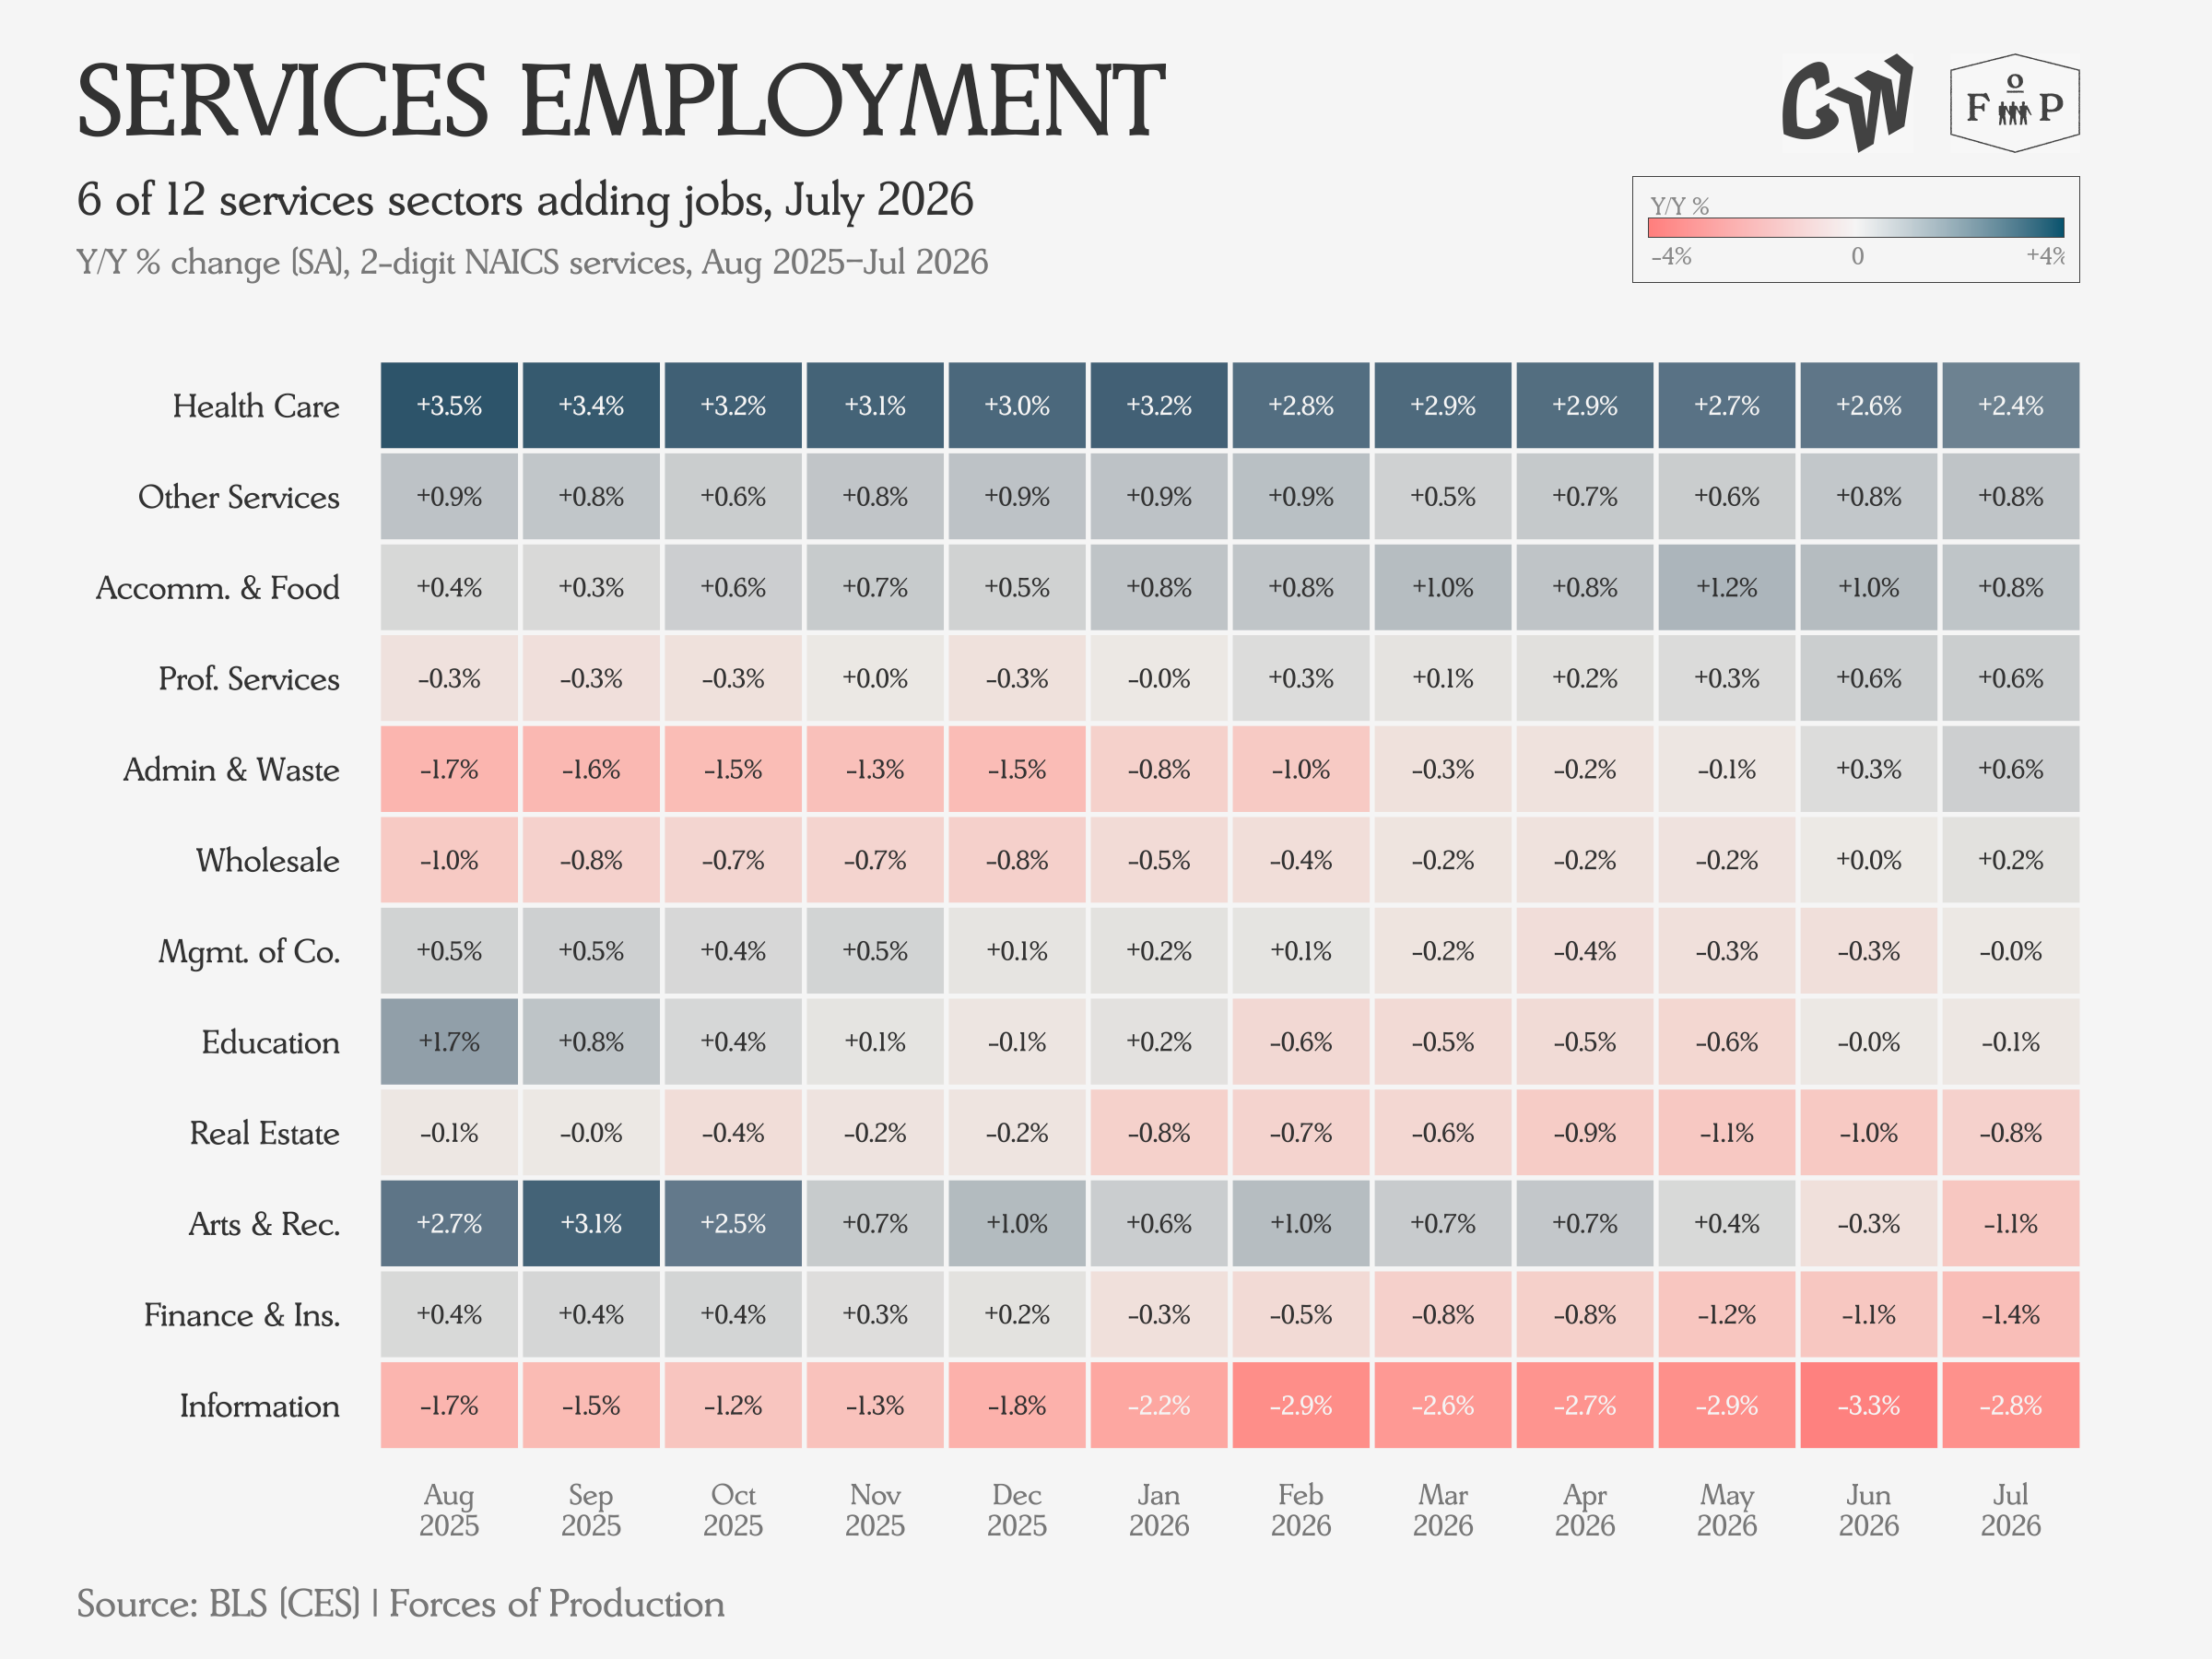
Health Care continues to drive employment growth in the Service side of the economy, posting three times the annual growth rate of the next fastest growing sector. Meanwhile, the Information sector continues to post losses and is now shrinking faster than Health Care is growing, in percentage terms.
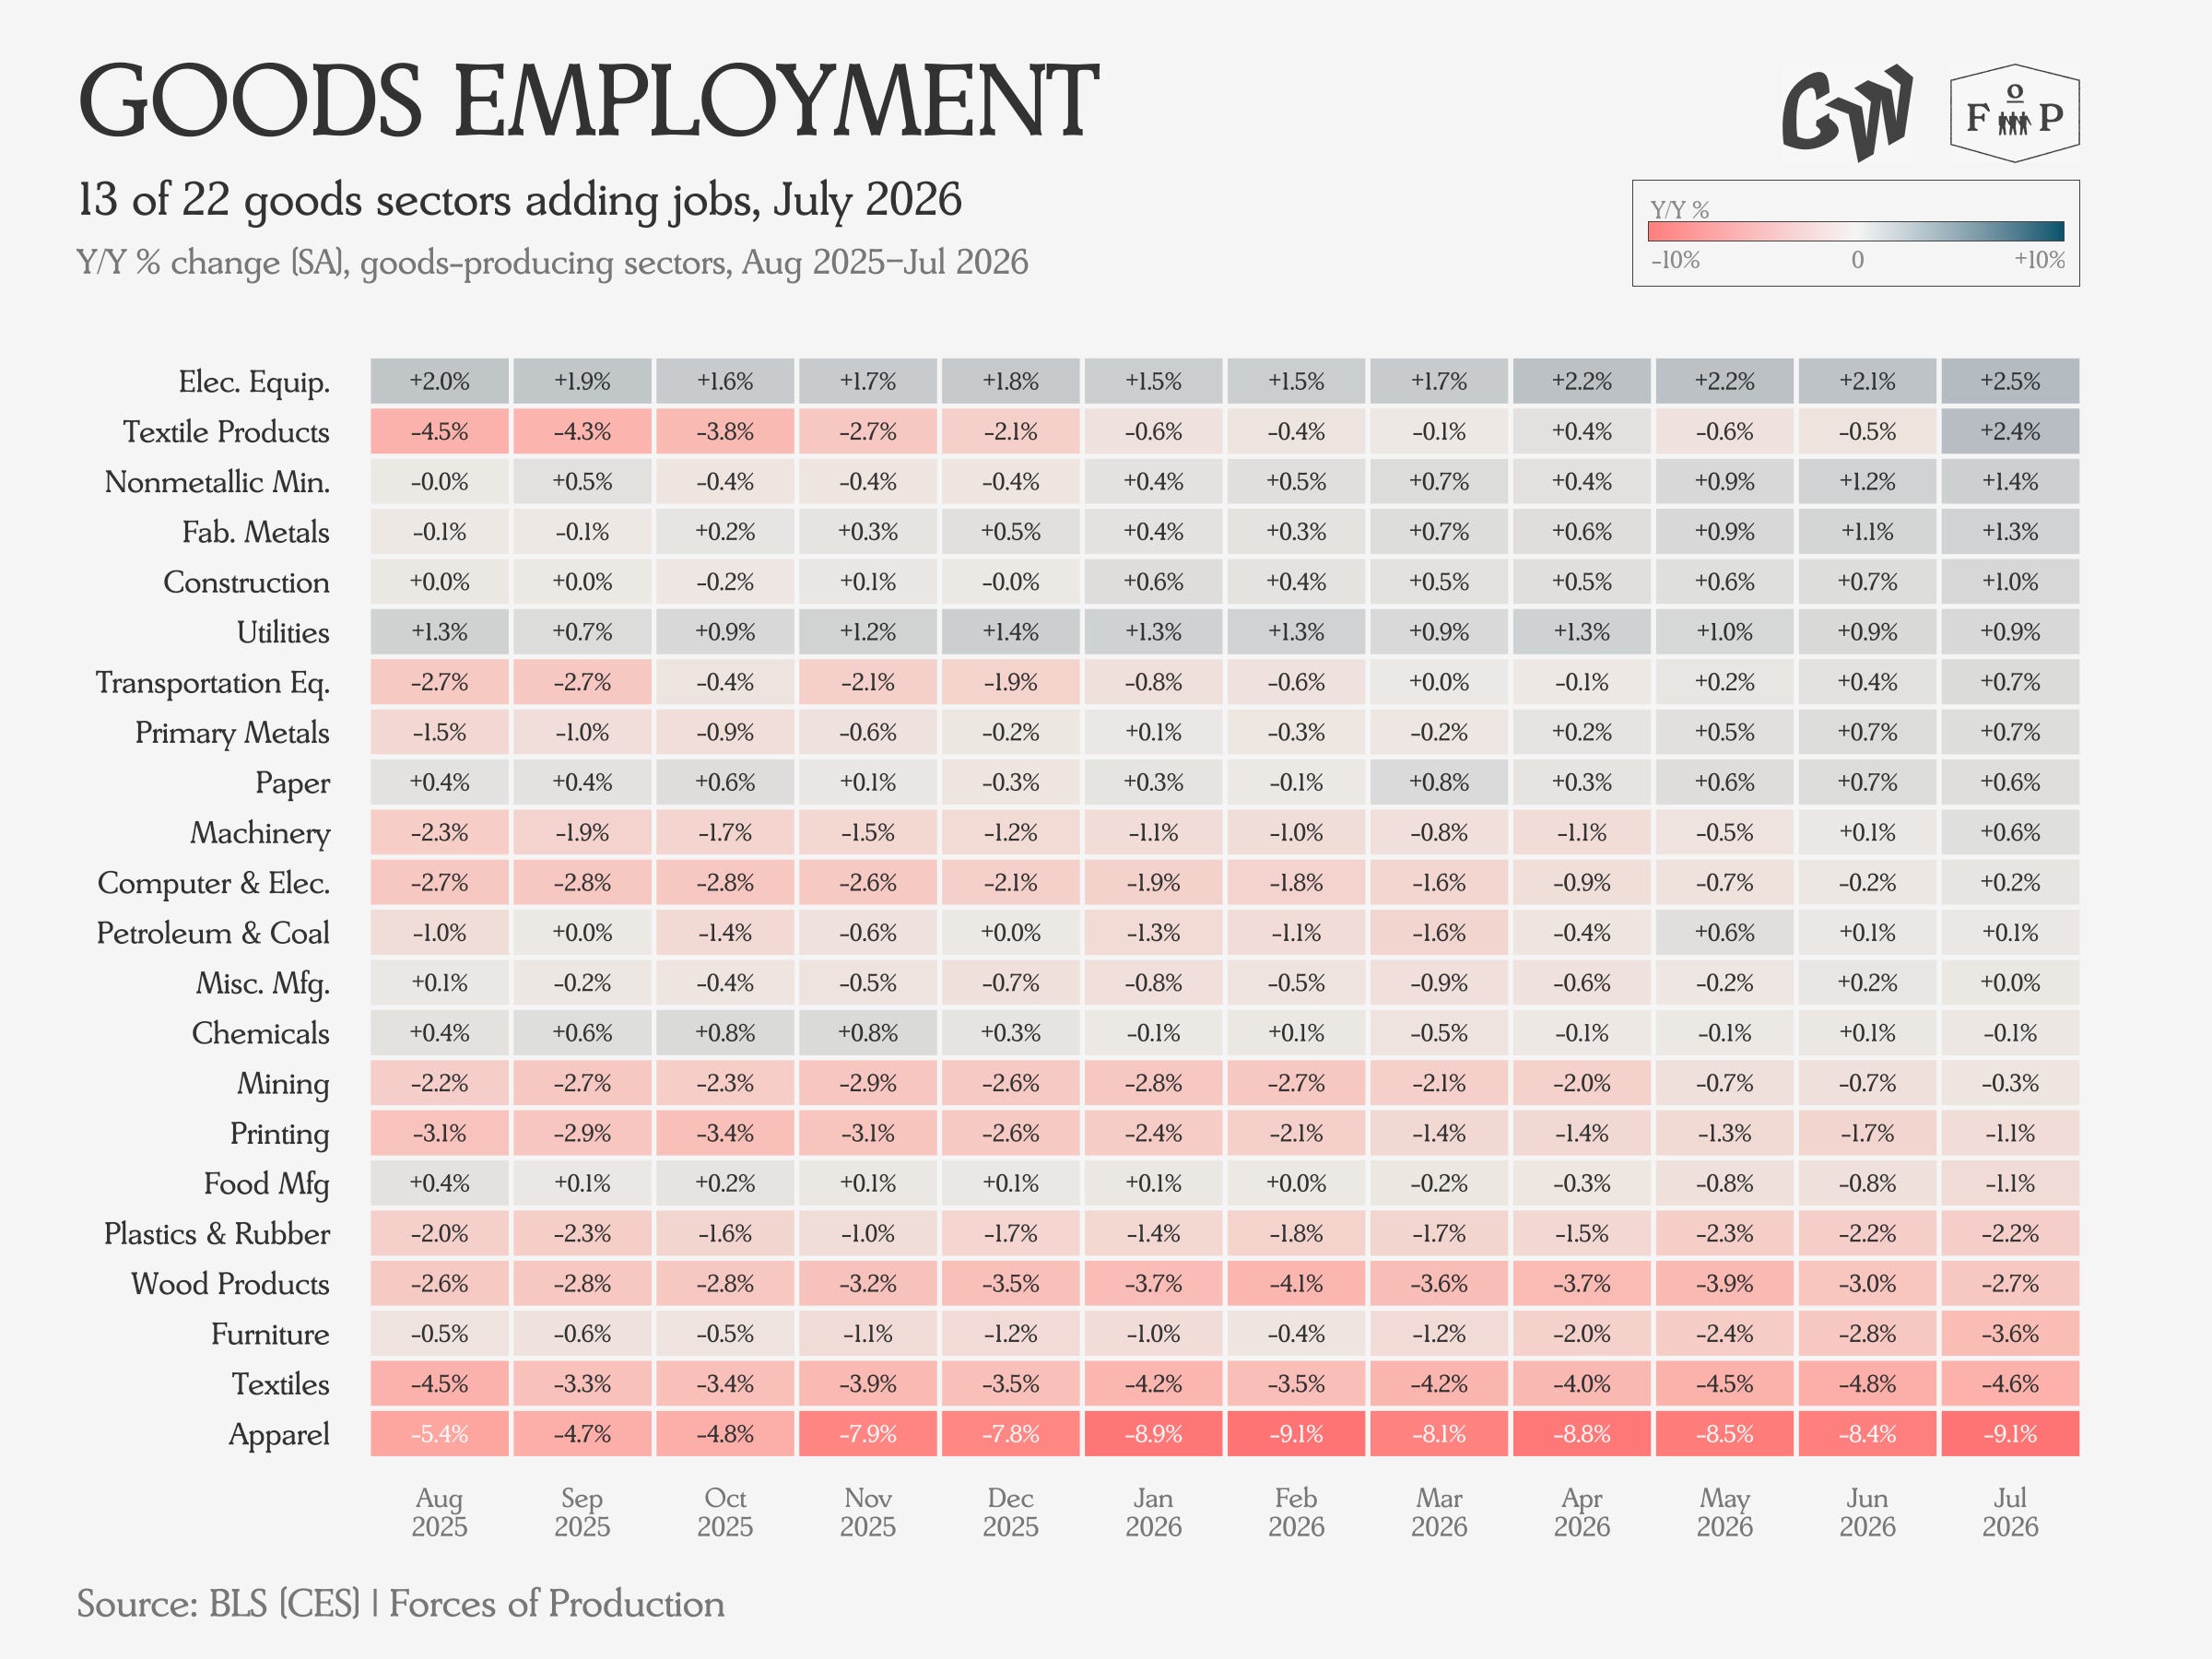
Goods employment shows continued weakness overall, with the main growth in sectors connected with the ongoing grid buildout: Electrical Equipment, Fabricated Metals, Construction, Utilities and Primary Metals, to name a few of the top.
Producer Prices
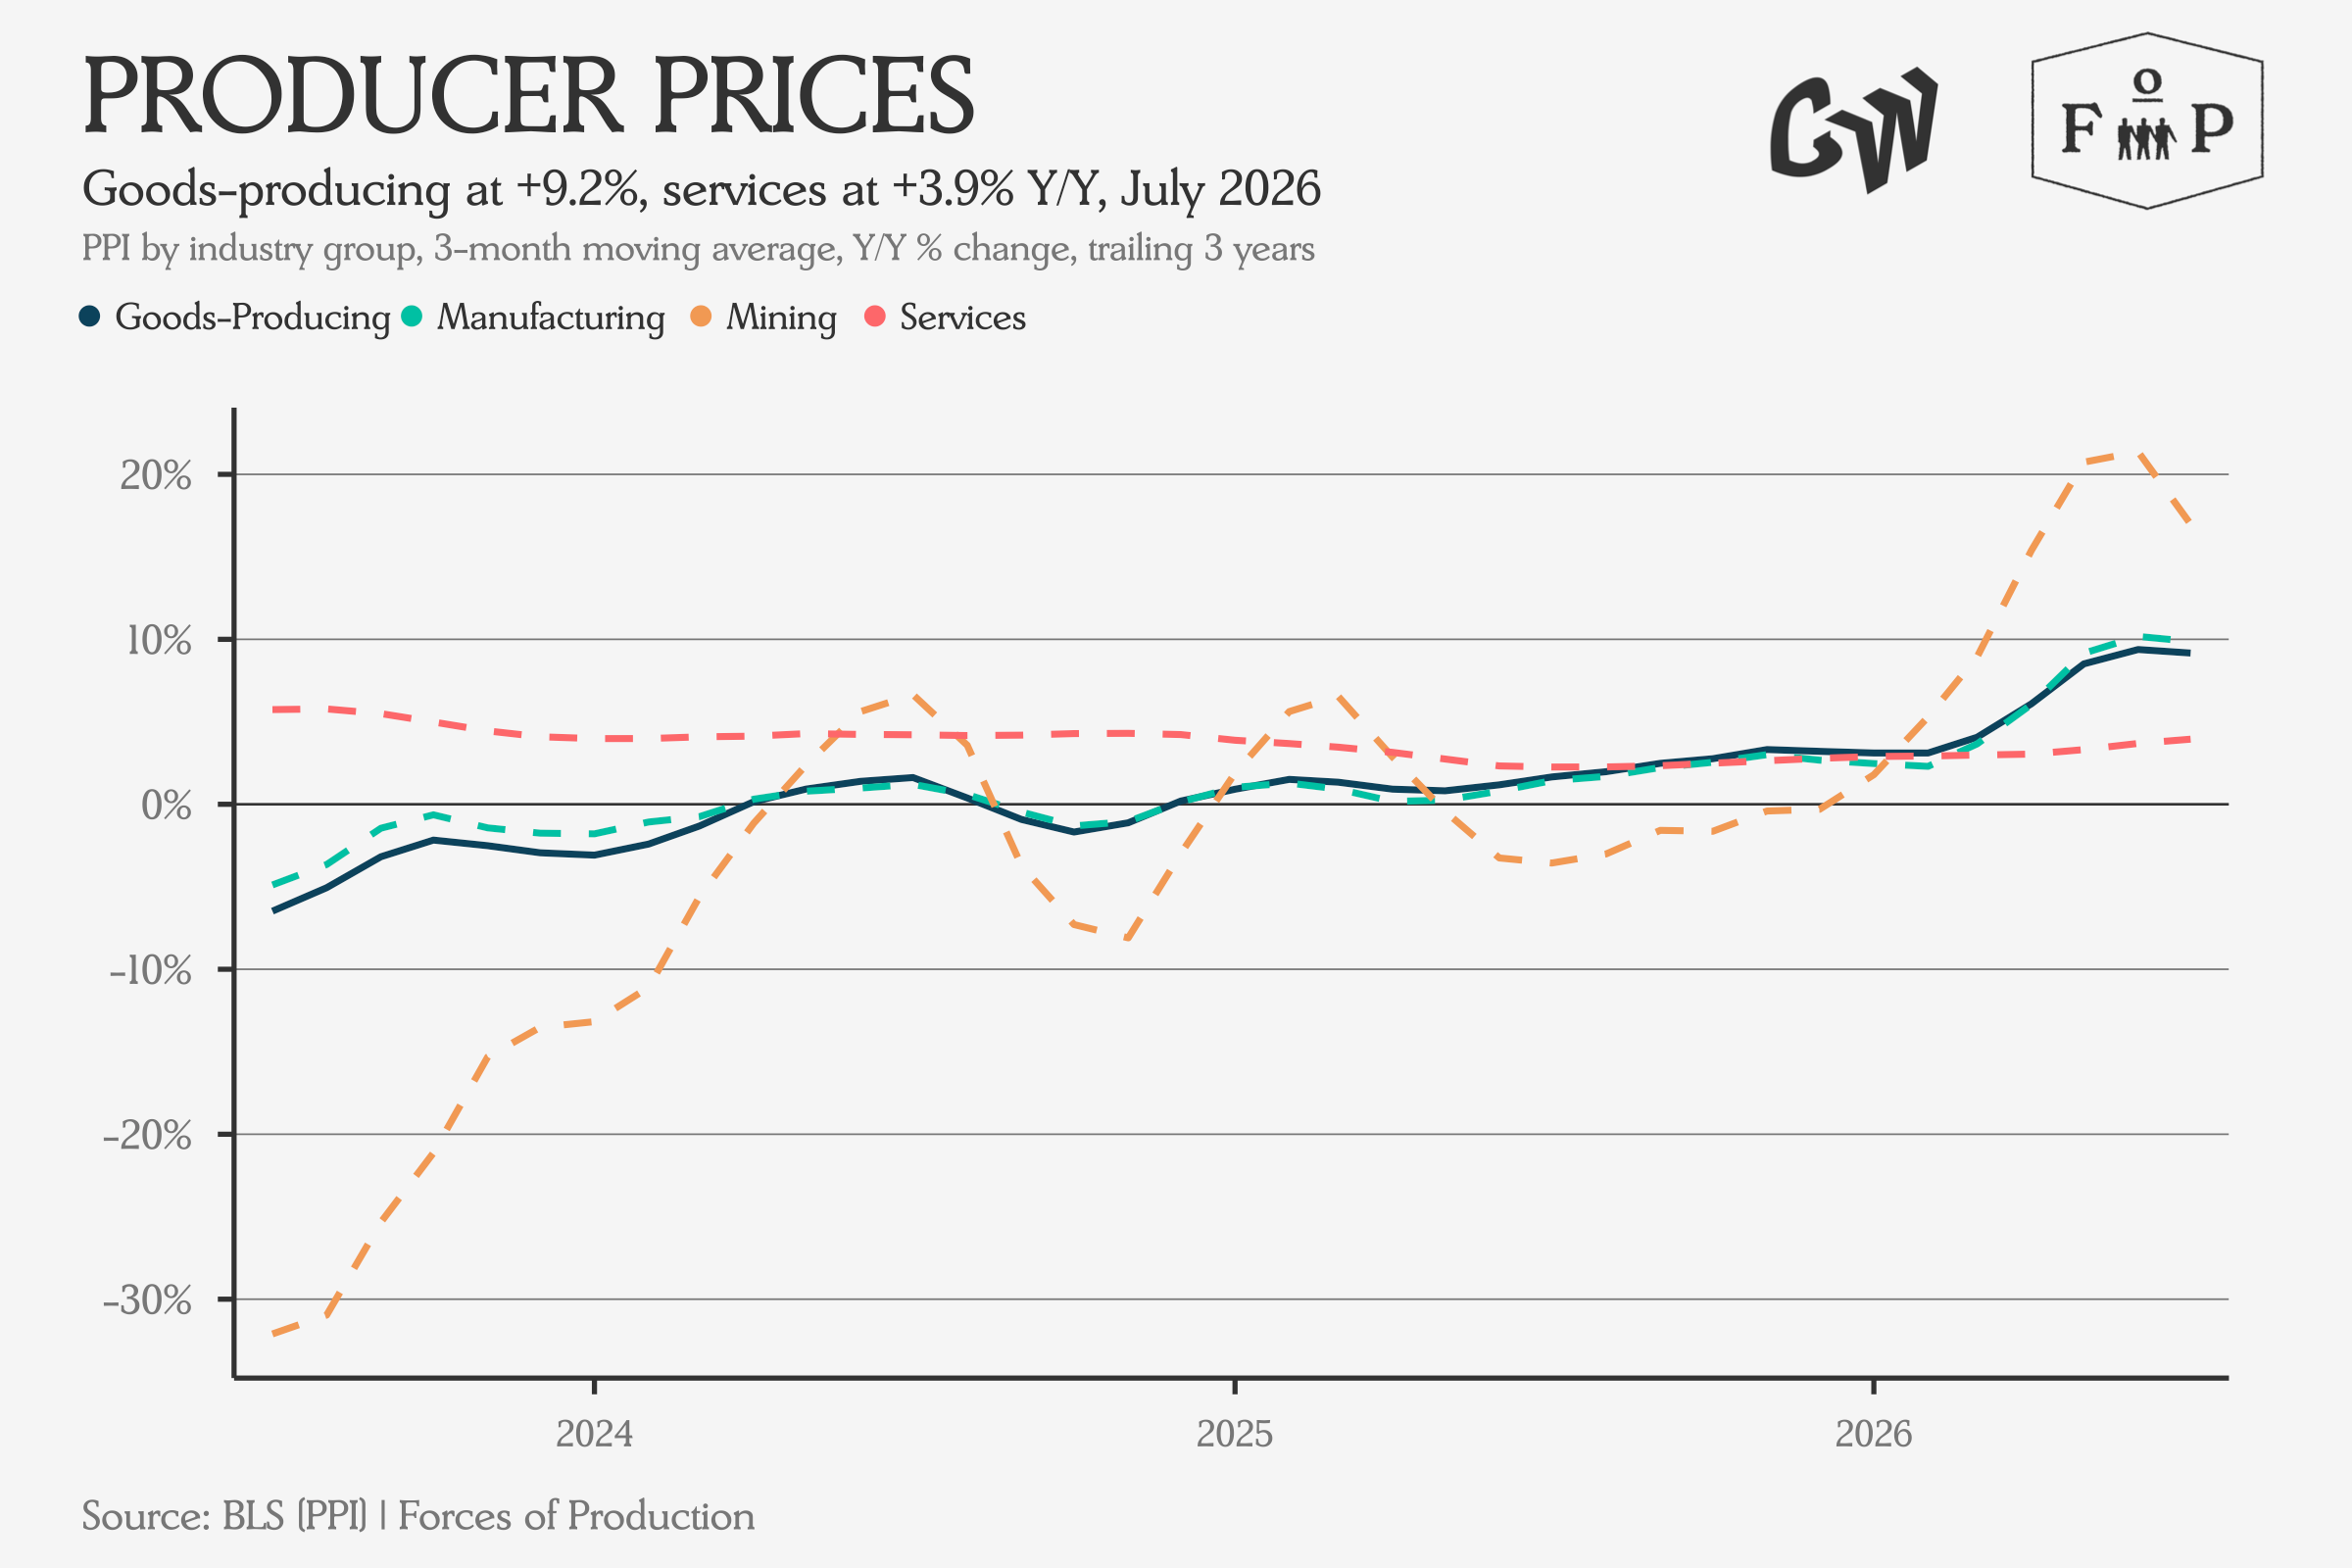
The Producer Price index remained roughly unchanged month-over-month in the July data, supporting a deceleration in year-over-year inflation on the supply side. Wholesale Durable and Nondurable Goods both saw significant reductions in year-over-year inflation, while price pressures on fossil fuels continued to ease with global spot prices.
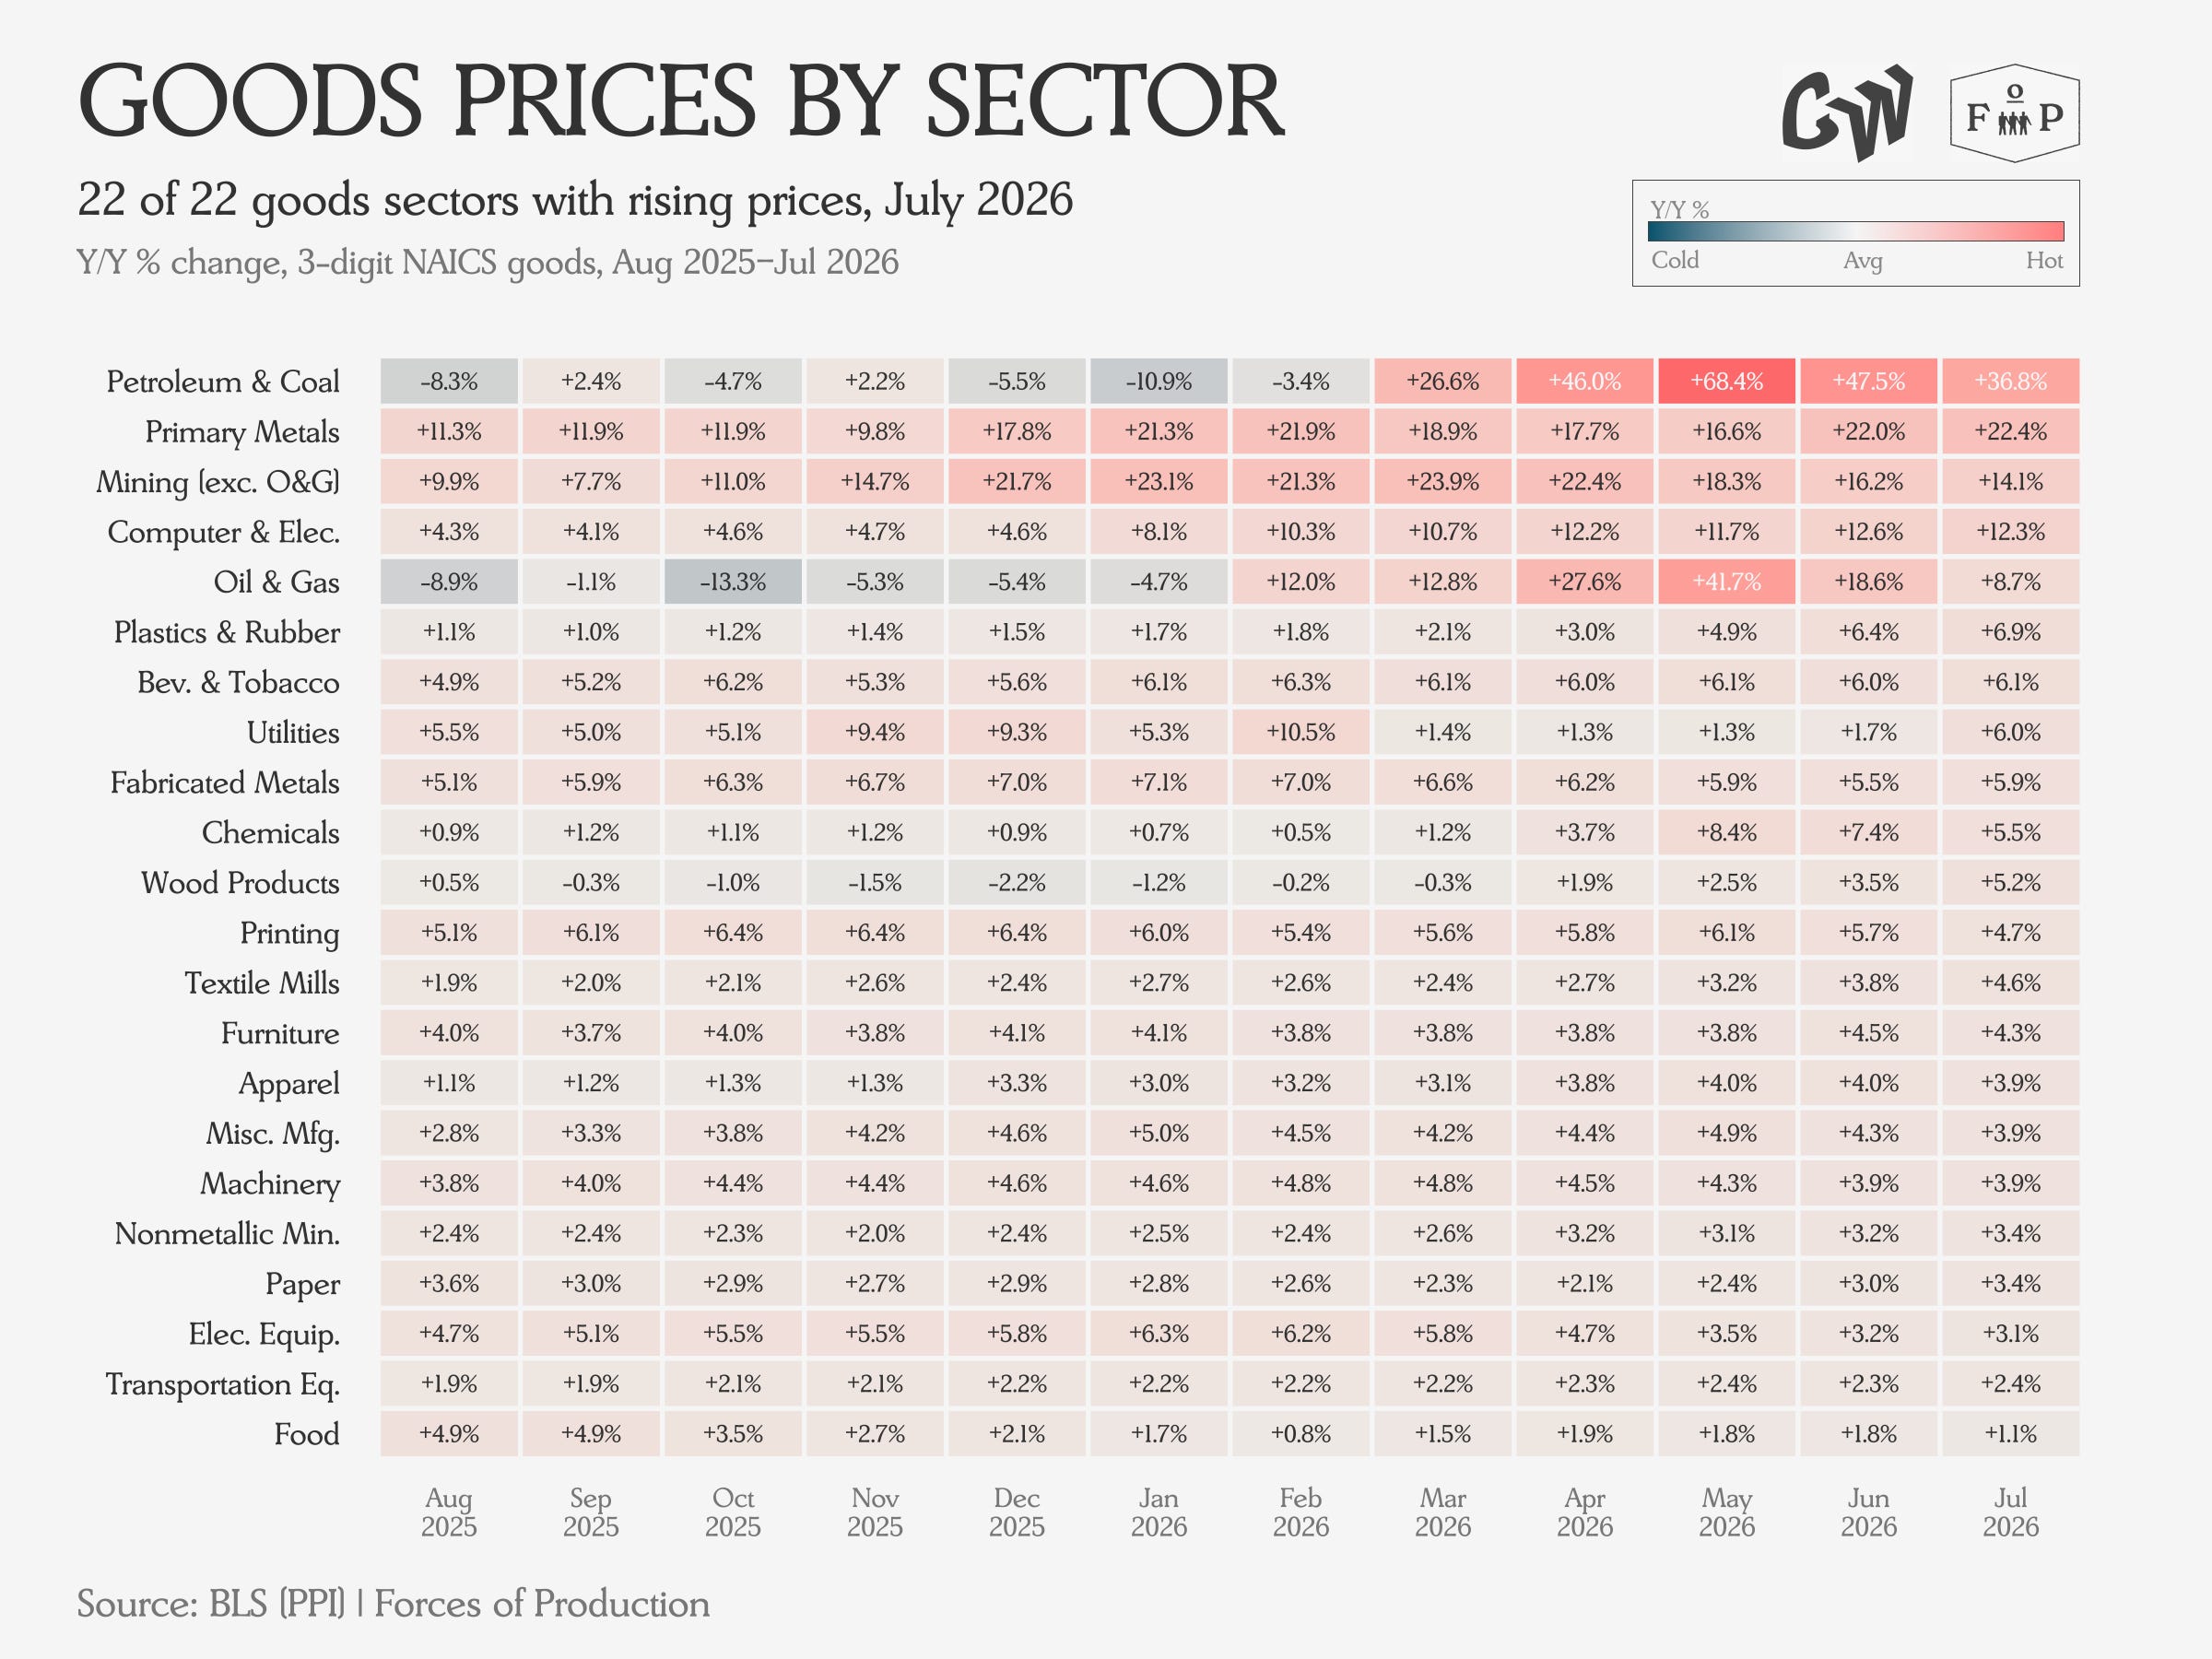
We continue to see broad-based price pressures across the Goods side on a year-over-year basis, with the median sector posting a roughly five percentincrease.
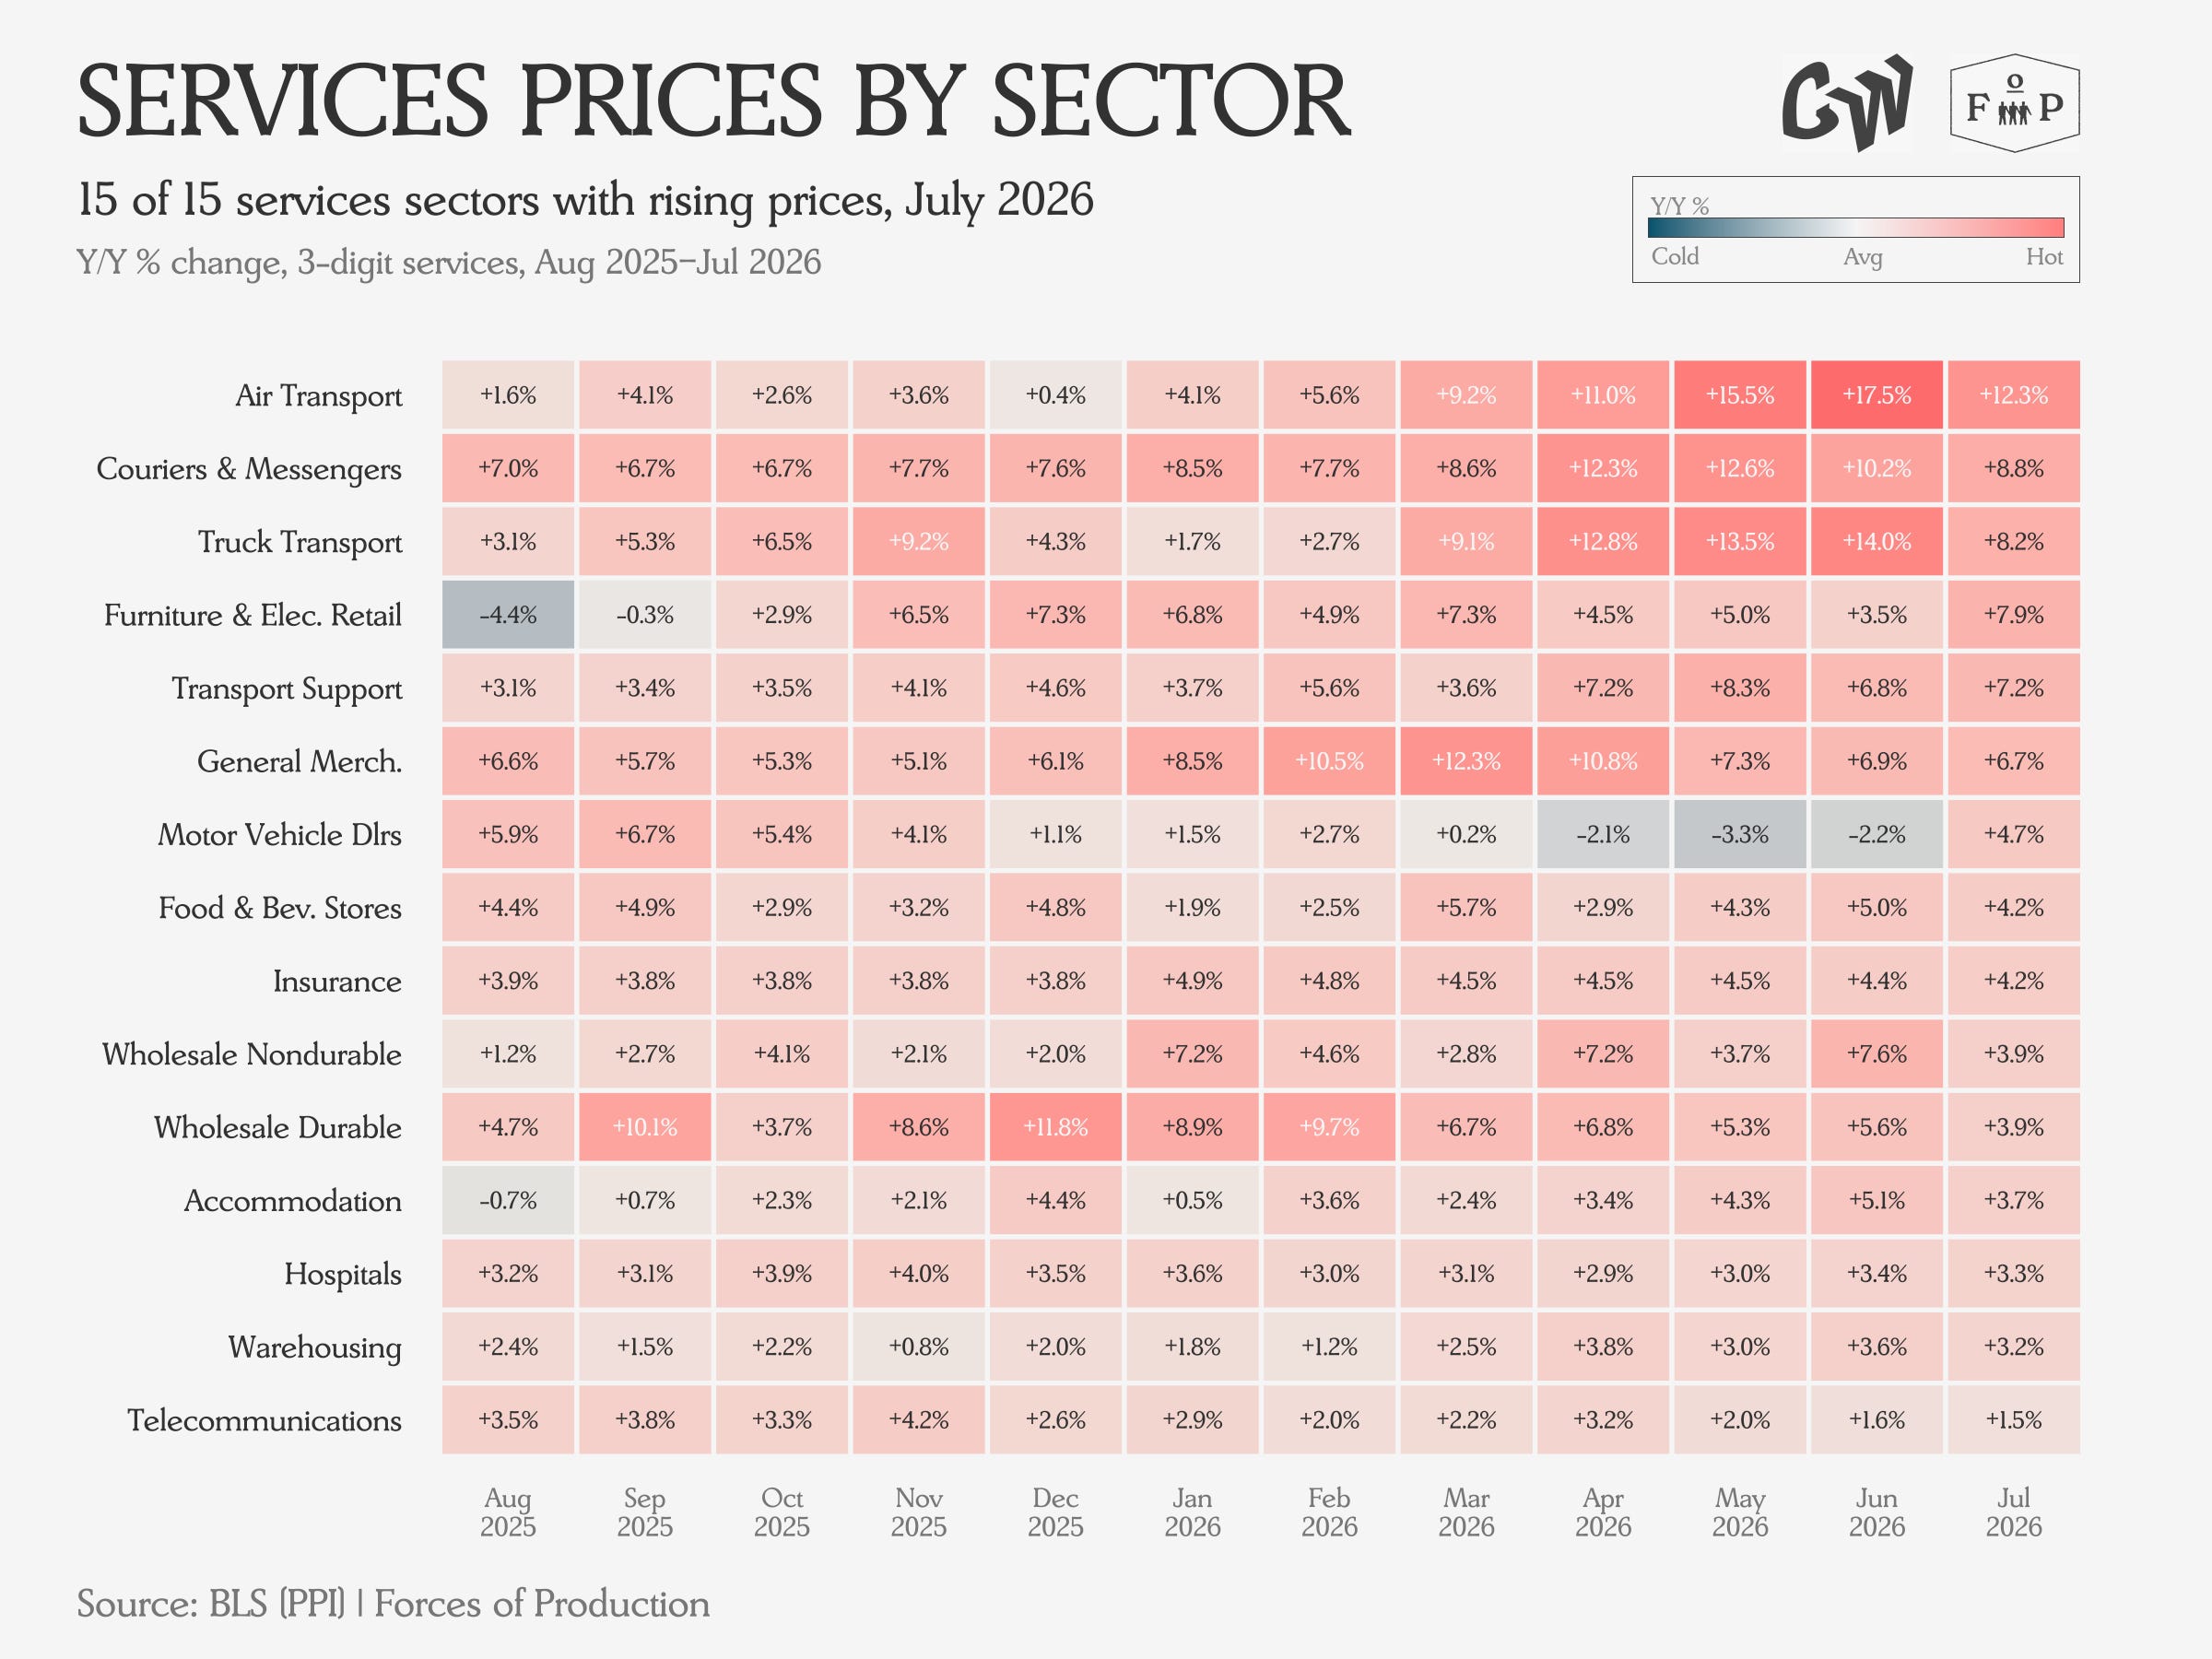
Outside of sectors specifically exposed to changes in energy and fuel costs, inflation on the Services side continues at roughly the same pace as it has since the end of the pandemic.
Industrial Production & Capacity
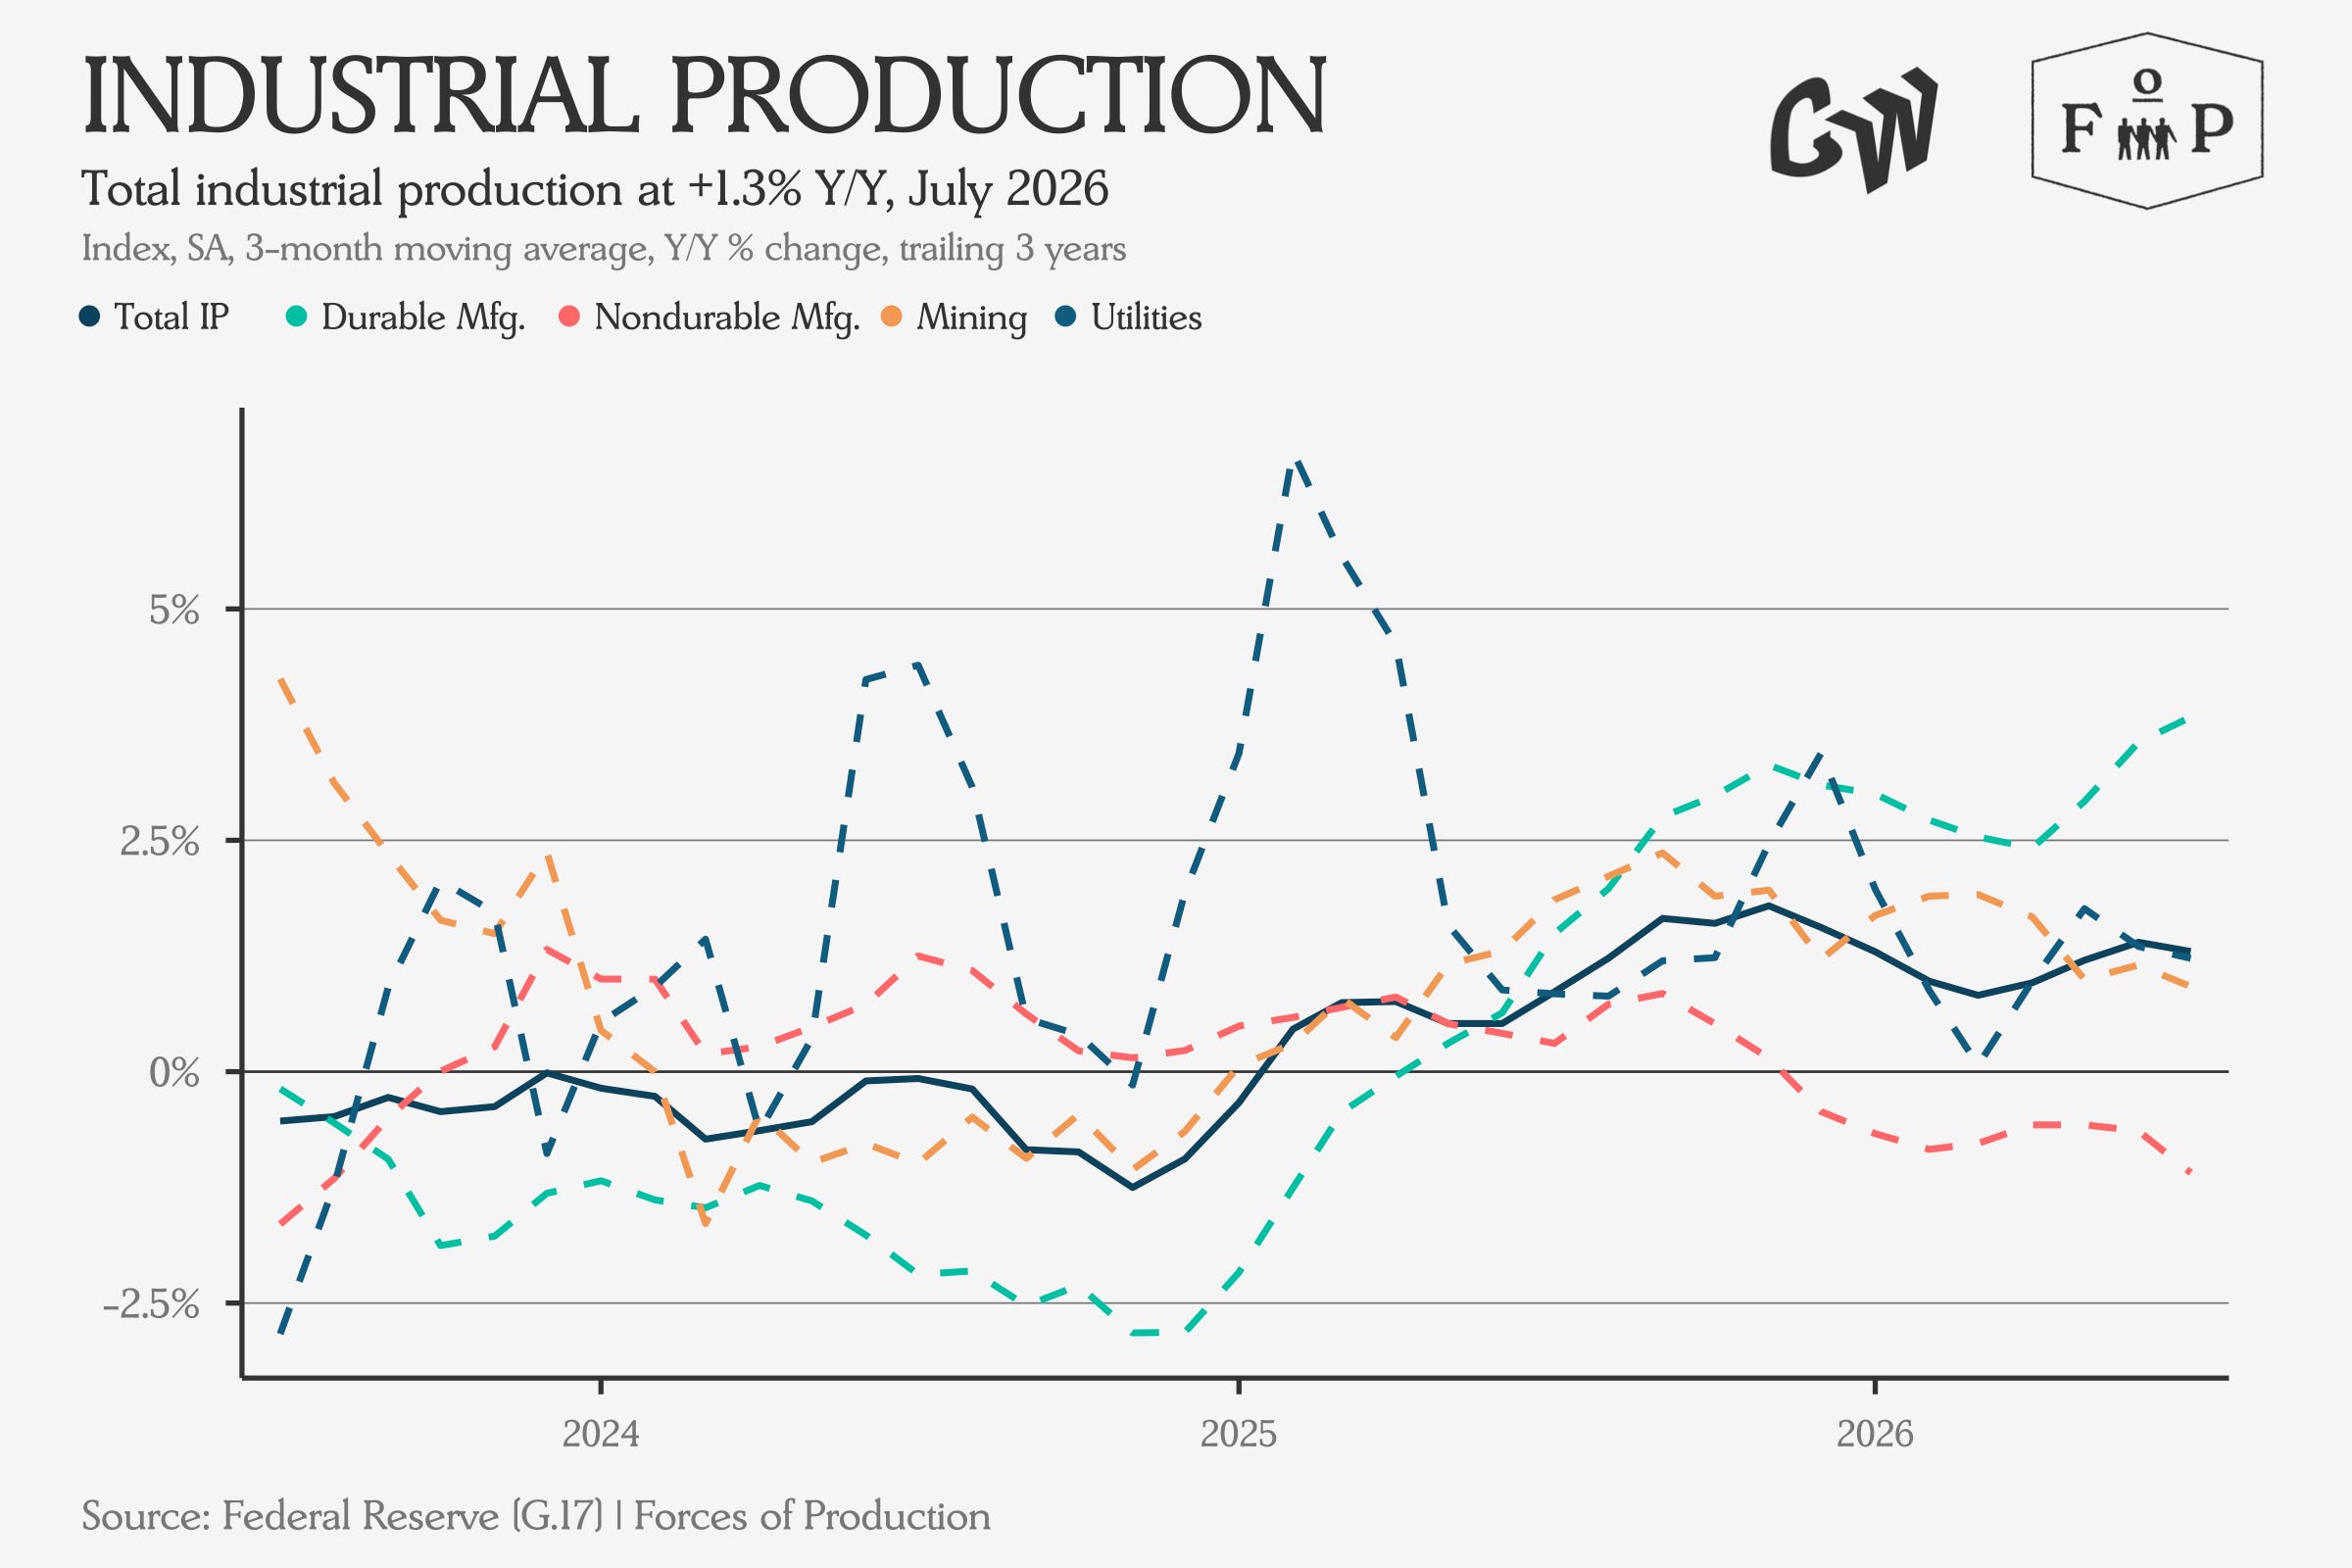
Industrial Production grew month-over-month, but by less than consensus expectations. Despite this, output continues to grow, with the index notching a four percent increase over its index year of 2017.
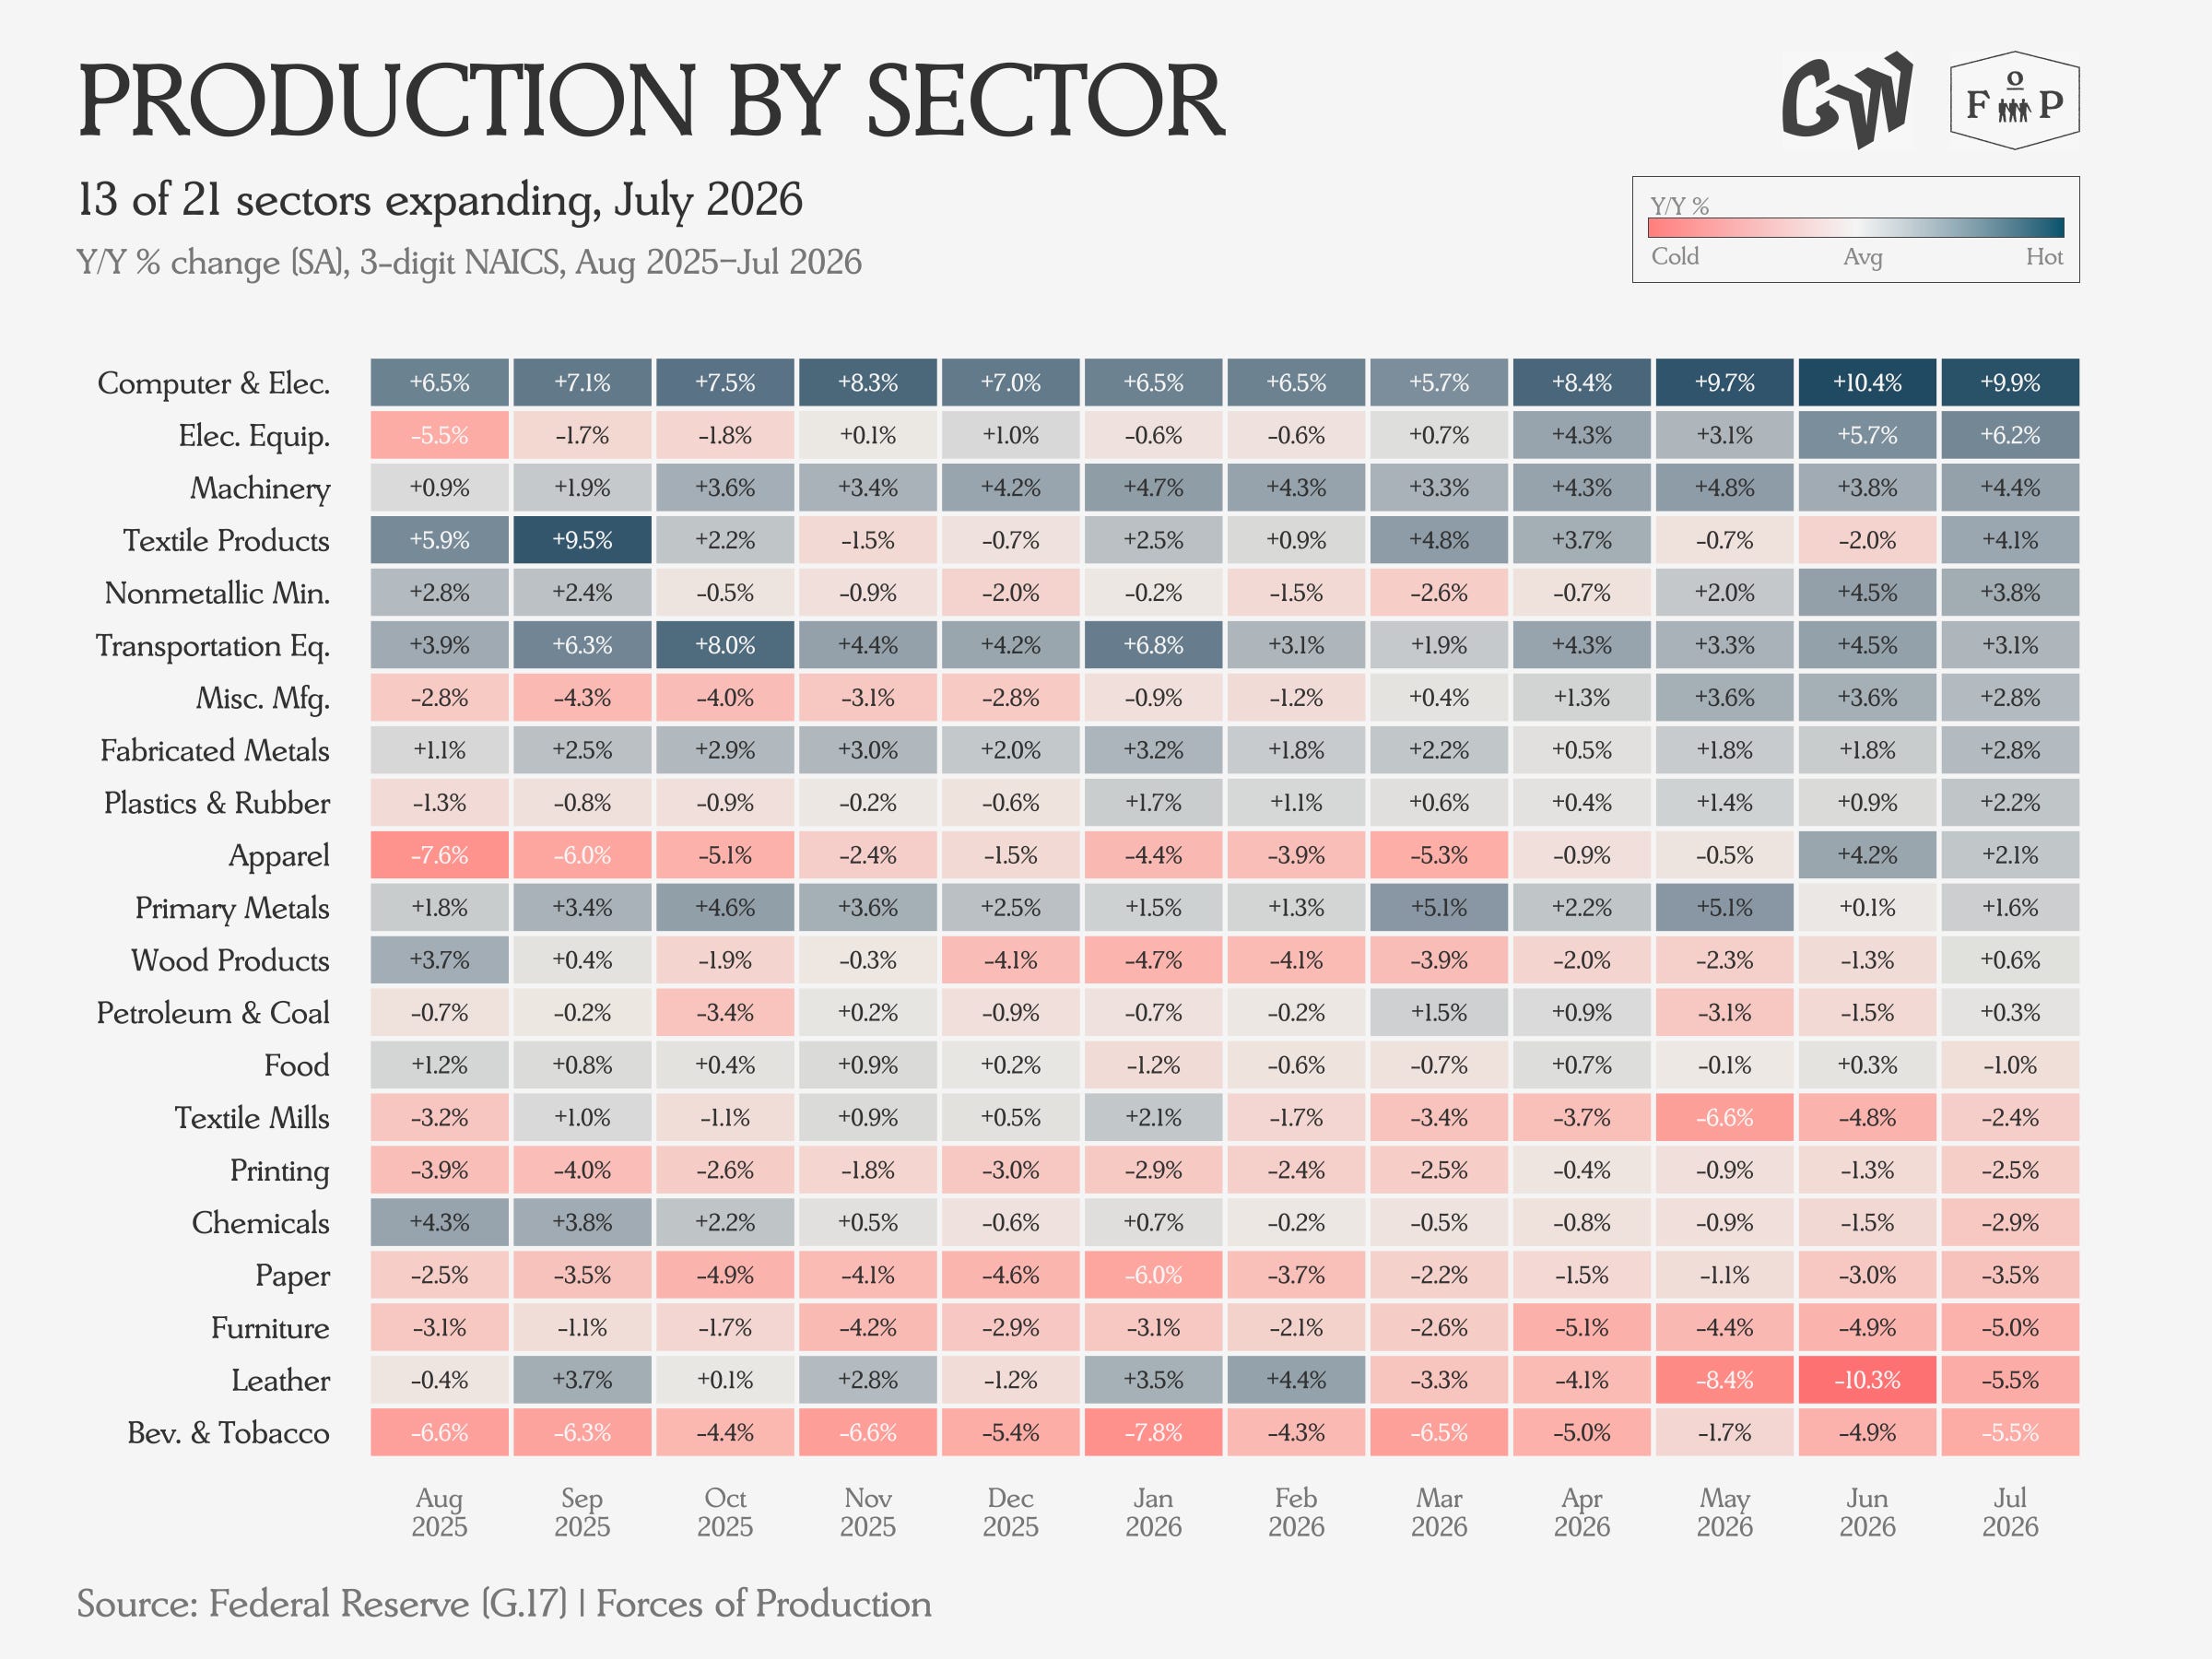
At the sector level, the biggest output gains over the last year have come from Computers and Electronic Equipment, Electrical Equipment and Machinery. As these sectors continued to accelerate in the July data, some sectors that had been shrinking saw accelerated declines, especially Chemicals.
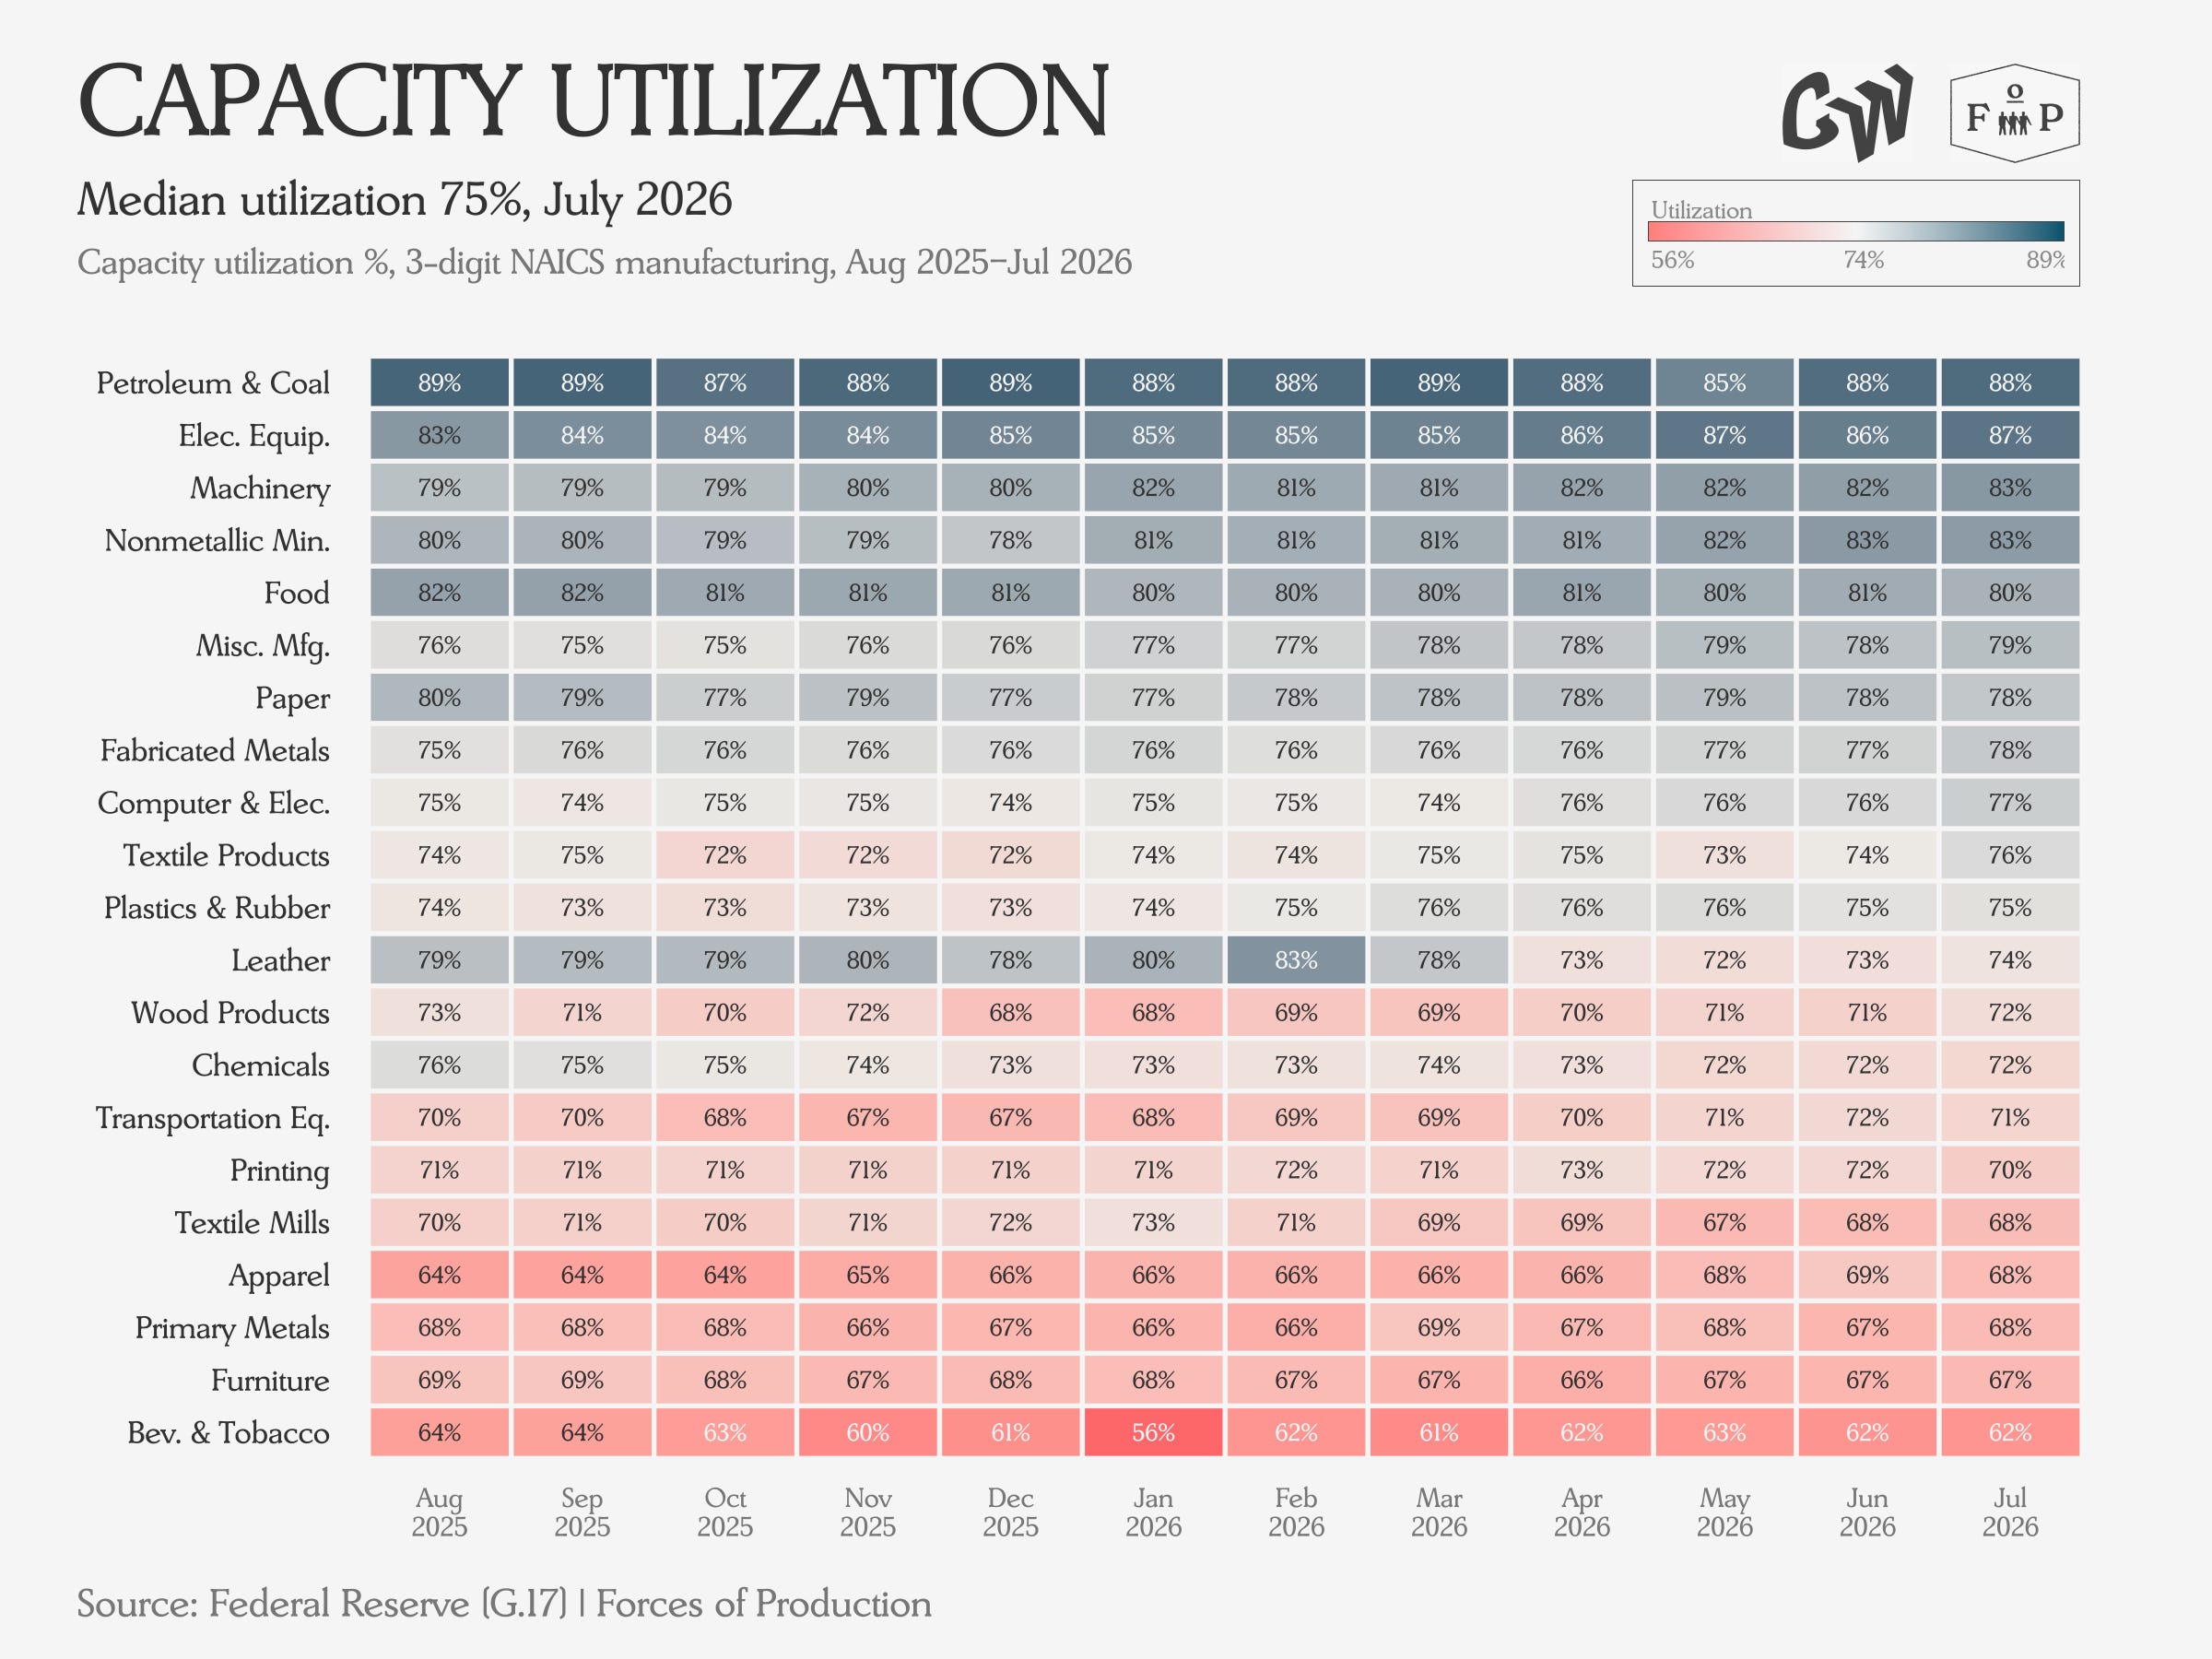
As we can see from the growing triangle of blue-tinted cells in the top right of the heatmap, capacity utilization is rising across a broader base of sectors. Utilization in the Electrical Equipment sector in particular has increased by four percentage points over the past year.
International Trade
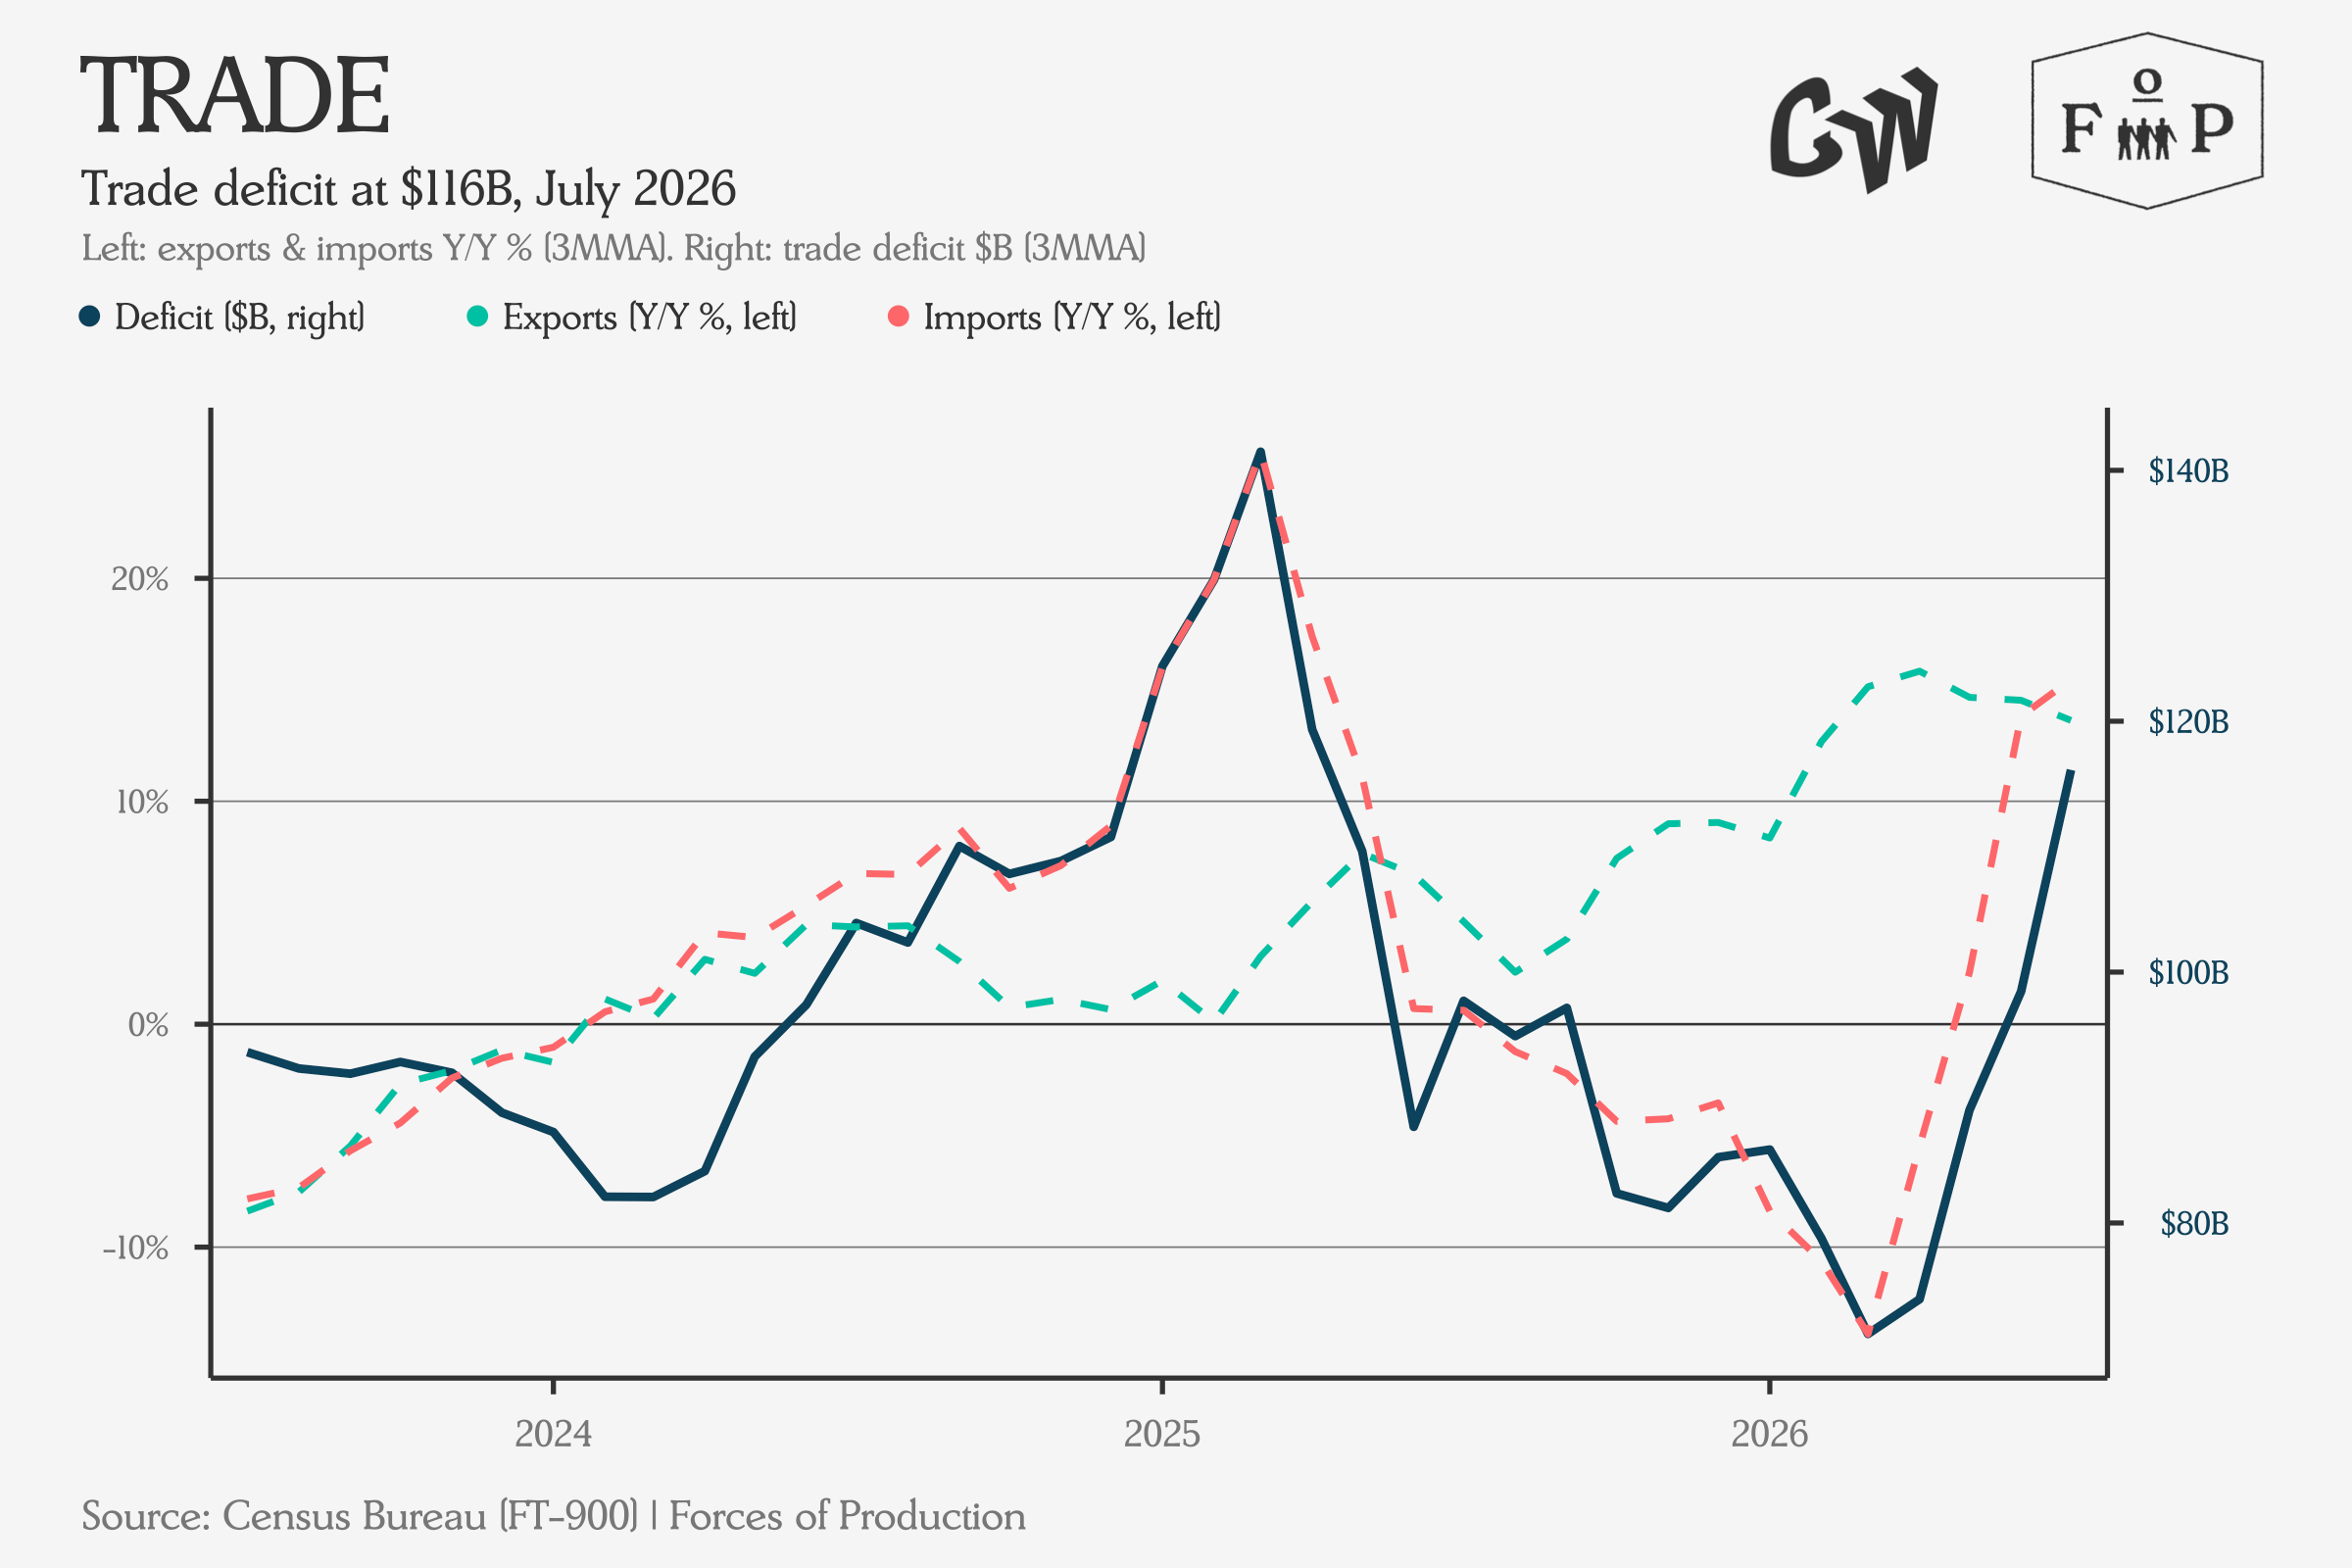
The US trade deficit hit a 16-month high in the July data, on a slight decline in exports and significant jump in imports. The bulk of the jump is from an increase in imports of capital goods, in particular those related to the buildout of AI infrastructure and data centers.
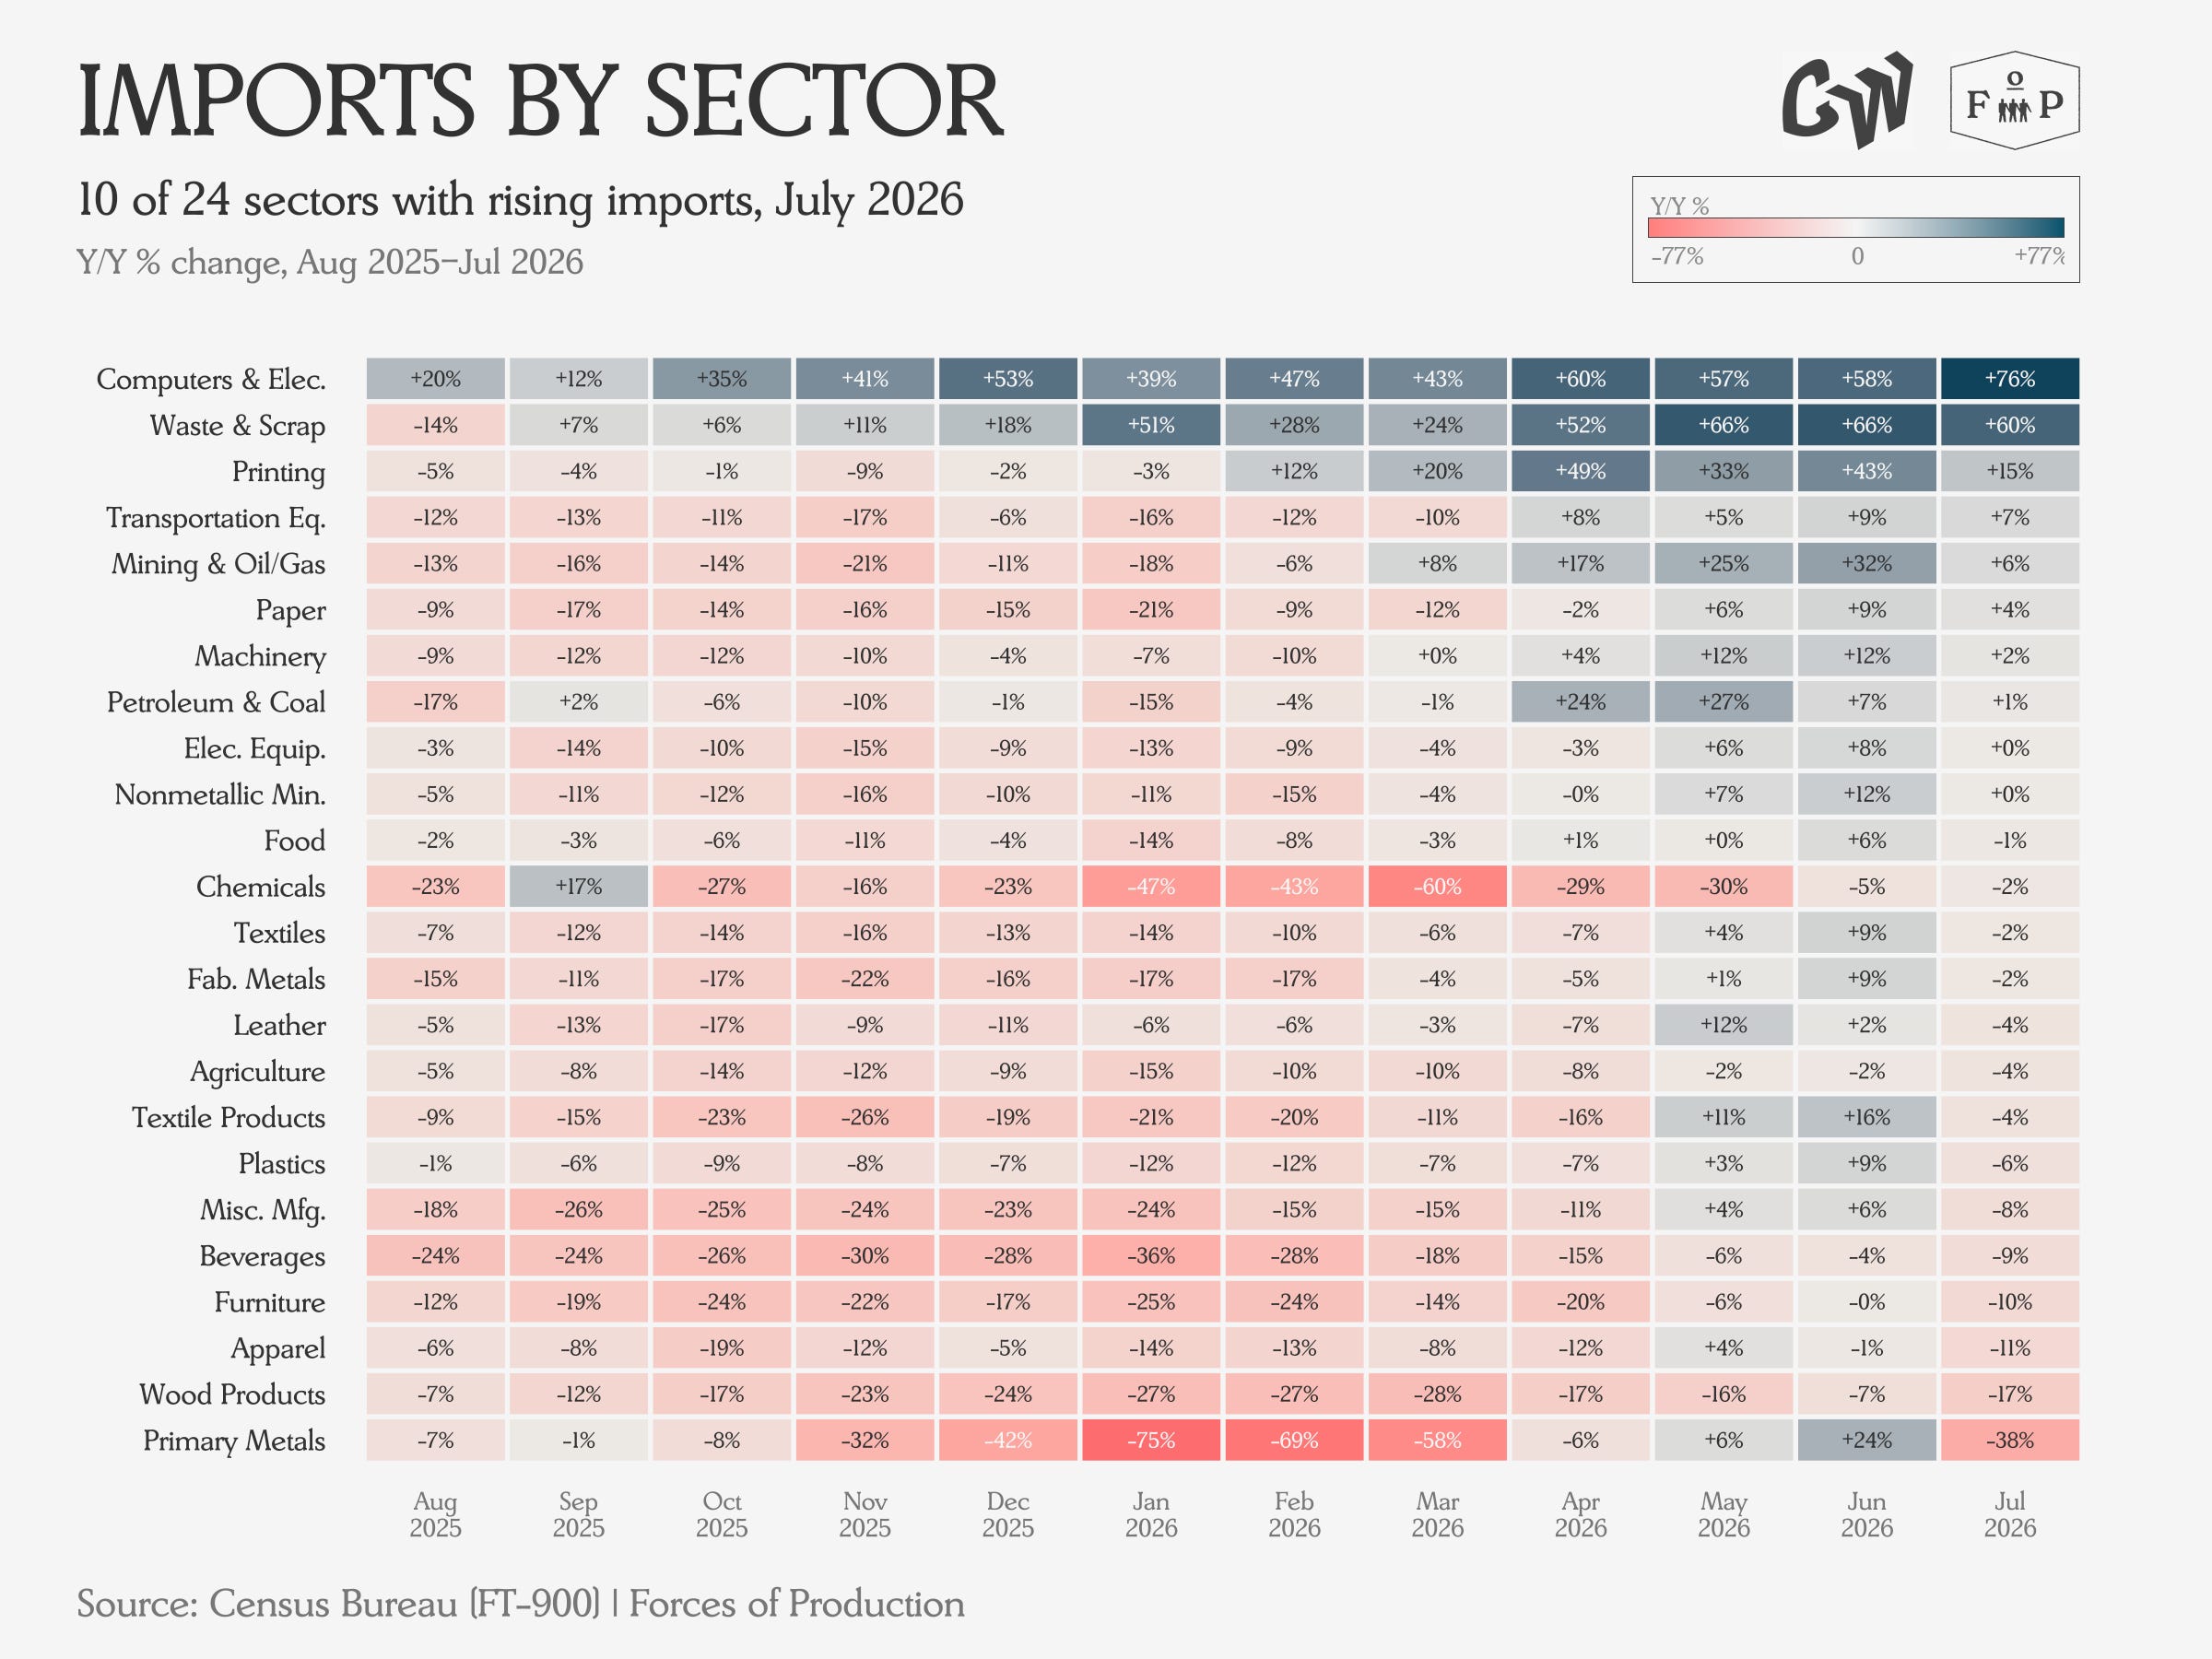
We can see that dramatic increase in AI-related imports in the absolutely enormous growth in the import of Computers and Electronic Products. All other import growth remains subdued where it is not negative.
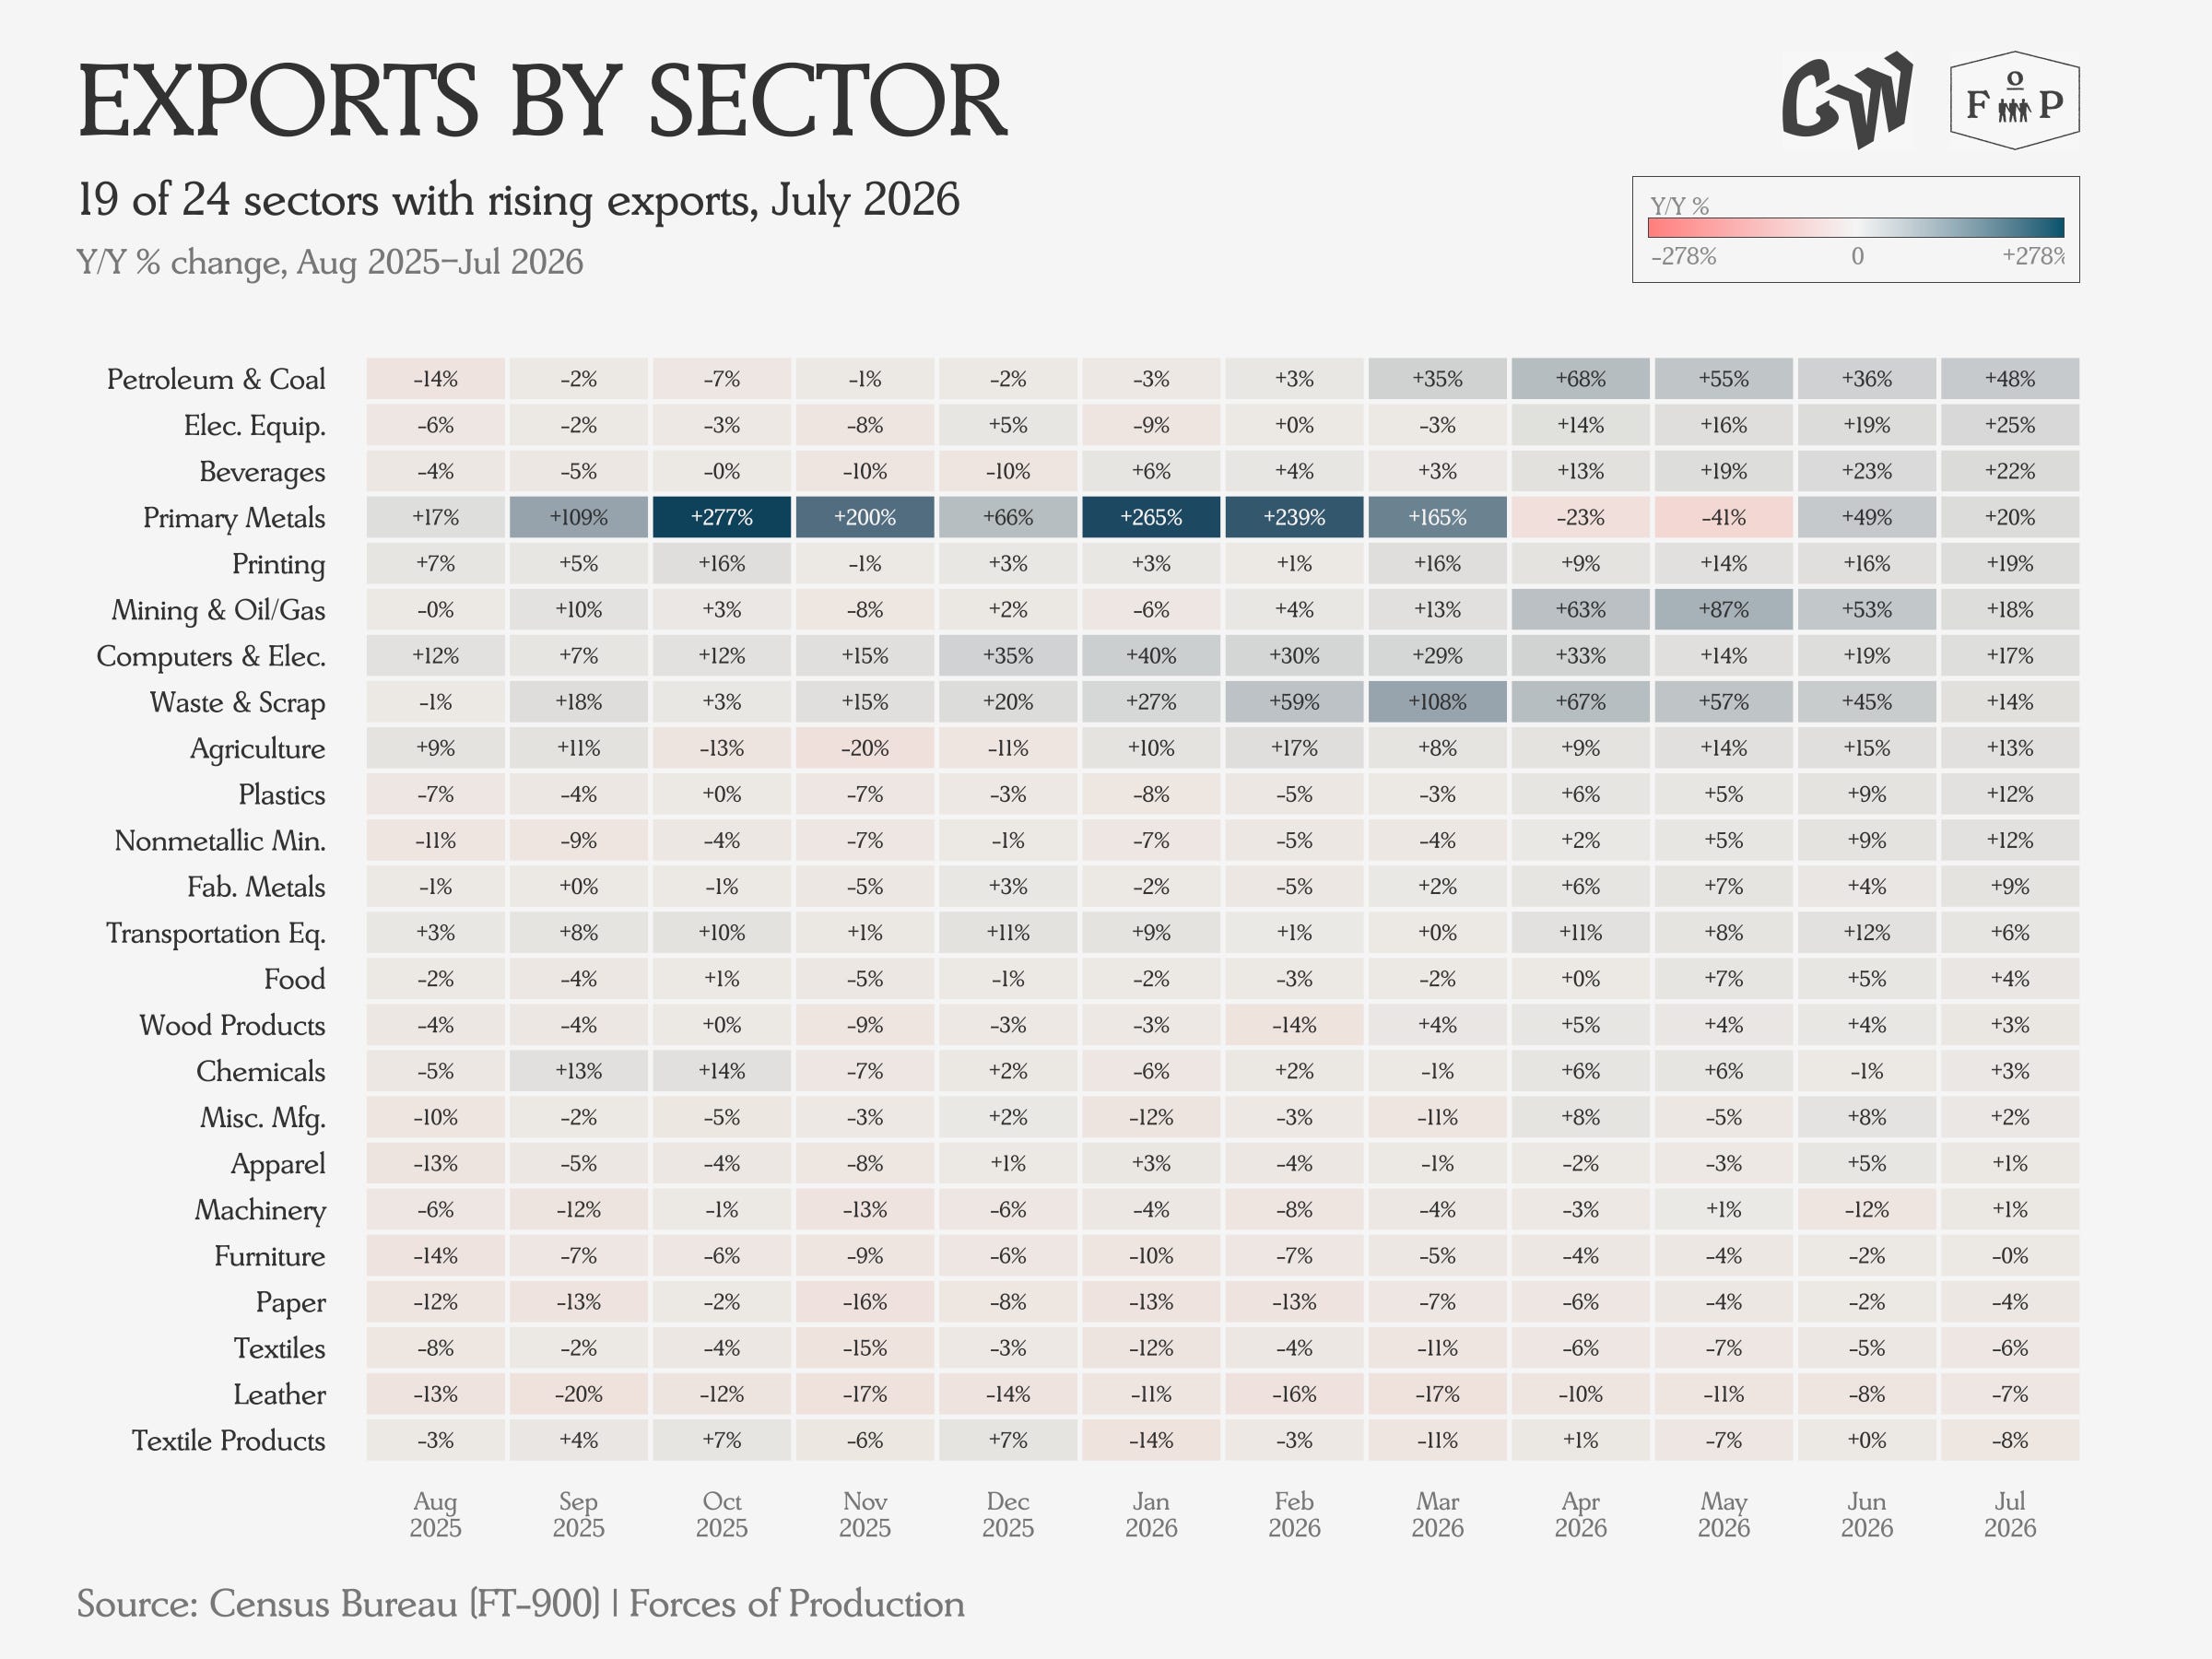
Exports of fossil fuels remain strong as the Strait of Hormuz remained largely blocked through July, while nearly every sector saw higher export values than the year previous.