


The November midterms were a massive rebuke of the Republican Party and its political agenda.
The trifecta they won in 2024 had given them complete freedom to govern with the approval of a compliant Supreme Court. They used the opportunity to focus on corruption, warmongering, attacking the sources and future of economic growth, the promulgation of huckster pseudoscience through official channels, the gutting of science funding that has already radically impacted a generation of researchers, ICE arrests nearly indistinguishable from armed carjackings — the list goes on almost indefinitely.
Republican voters stayed home or voted Democratic last Tuesday. The midterm swing was massive and carried downballot, potentially creating enough Electoral College votes to abolish the institution through state Democratic trifectas. The electorally unthinkable happened over and over again. David Shor had been arguing that Democrats couldn’t retake the Senate without winning back culturally conservative voters in deep-red states just days before James Talarico and Adam Hamilton won Senate seats in Texas and Kansas. If the same shifts remain durable to 2028, the result would be an overwhelming presidential mandate and a filibuster-proof Democratic Senate majority.
A swing of this size and thoroughness is hard to interpret as entirely limited to economic concerns when the numbers do not show acute crisis. The headline economic indicators remain strong by historical standards, even as they continue to decelerate with the ending of the last knock-on effects of the Bidenomics stimulus. Paul Krugman makes this point as well.
Understanding the sources of a rout often requires taking a longer view.
Over the years, the Republican Party has been held in check by norms and Democratic politicians in ways that prevented them from directly acting on their worst impulses — the raw id of the party — to make national policy. After years of this, focus groups have actually found that when GOP policies are explained to voters, they do not actually believe that the party endorses those policies. Like the rallies for mass deportation at the end of the 2024 campaign, reality is bad enough to be essentially self-censoring. However, the 119th Congress, combined with an undoubtedly partisan Supreme Court, has allowed the party to pursue and enact their agenda with neither “checks and balances” nor constitutionality as fetters.
That program has resulted in omnidirectional chaos and looting at the highest levels of government — even after the midterm rout, Trump tries to make fun of Ross Douthat for failing to make money off of the administration — and the people hated it! They hated it so much that they voted straight-ticket Democrat so thoroughly that even Democratic candidates who dropped out of their races for apolitical reasons found themselves elected to new offices. The closest analogy is probably the total collapse of the Conservative Party in the UK in 2024.
The job for Democratic politicians now is simple: don’t waste the wave. The goal should be to follow the example of Mamdani in delivering tangible victories that everyday Americans notice while using the expanding bench of new talent to develop a compelling new vision for shared economic growth. We have put forward the silhouette of this new model in our manifesto for The Productive State, and have been pleased to see similar rhetoric from major winners like Abdul El-Sayed.
Now, even though the economy was at most one part of the Republican policy rejected by voters, this is an economics publication after all. We are going to talk about economics, specifically energy. Although tariffs contributed significantly to inflation without meaningfully changing employment levels or capacity utilization in the targeted sectors, they have cost the economy as a whole less than the energy policy pursued in 2025–26.
Energy prices spiked over the first half of the second Trump administration as a direct consequence of both the dismantling of the Inflation Reduction Act and the Iran war, alongside an unprecedented increase in load growth from the data center buildout encouraged by the administration. We previously looked at the input-output tables to forecast how the Iran war might impact inflation overall. That prediction turned out high, both because of the ability of the administration to jawbone oil markets and because the real economy is much squishier and more elastic than the ironclad functional form of the input-output tables. So today we are going to look at some of the structural disadvantages of energy use on the supply side.
Businesses and consumers alike faced big jumps in the price of energy, especially refined products.
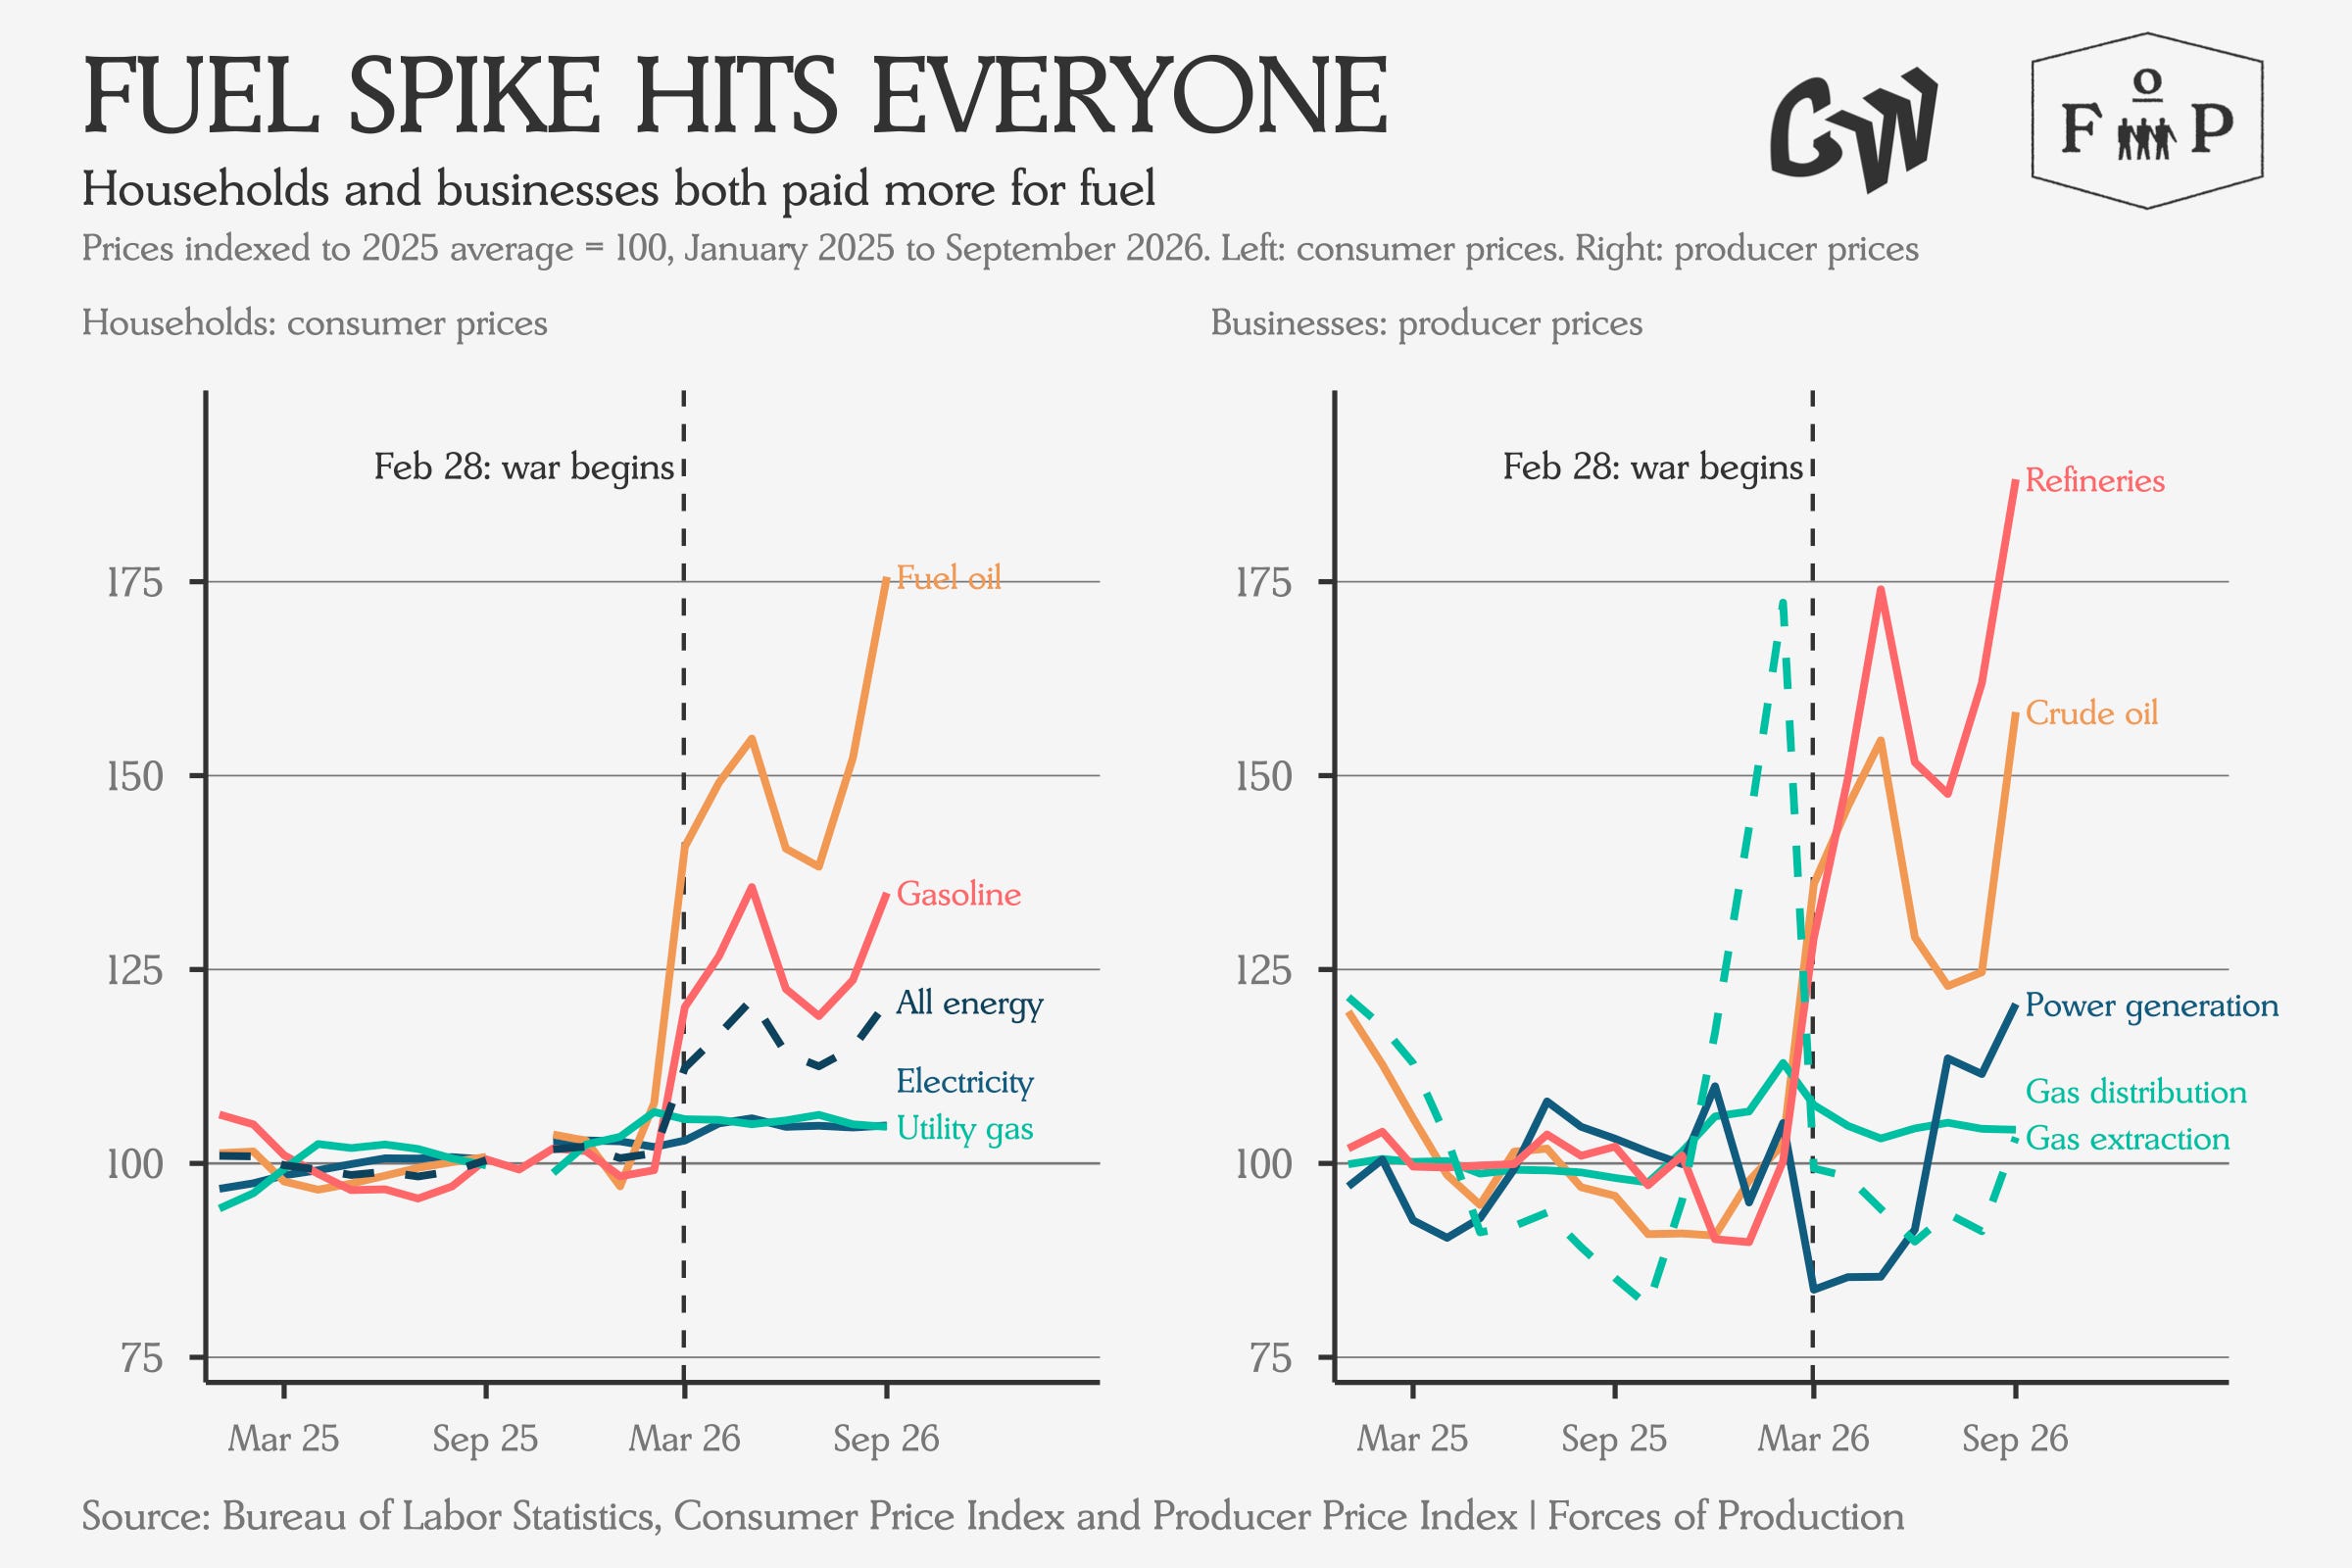
In fact, looking across the whole supply side, it seems energy plays a larger role in consumer baskets than in business spending.
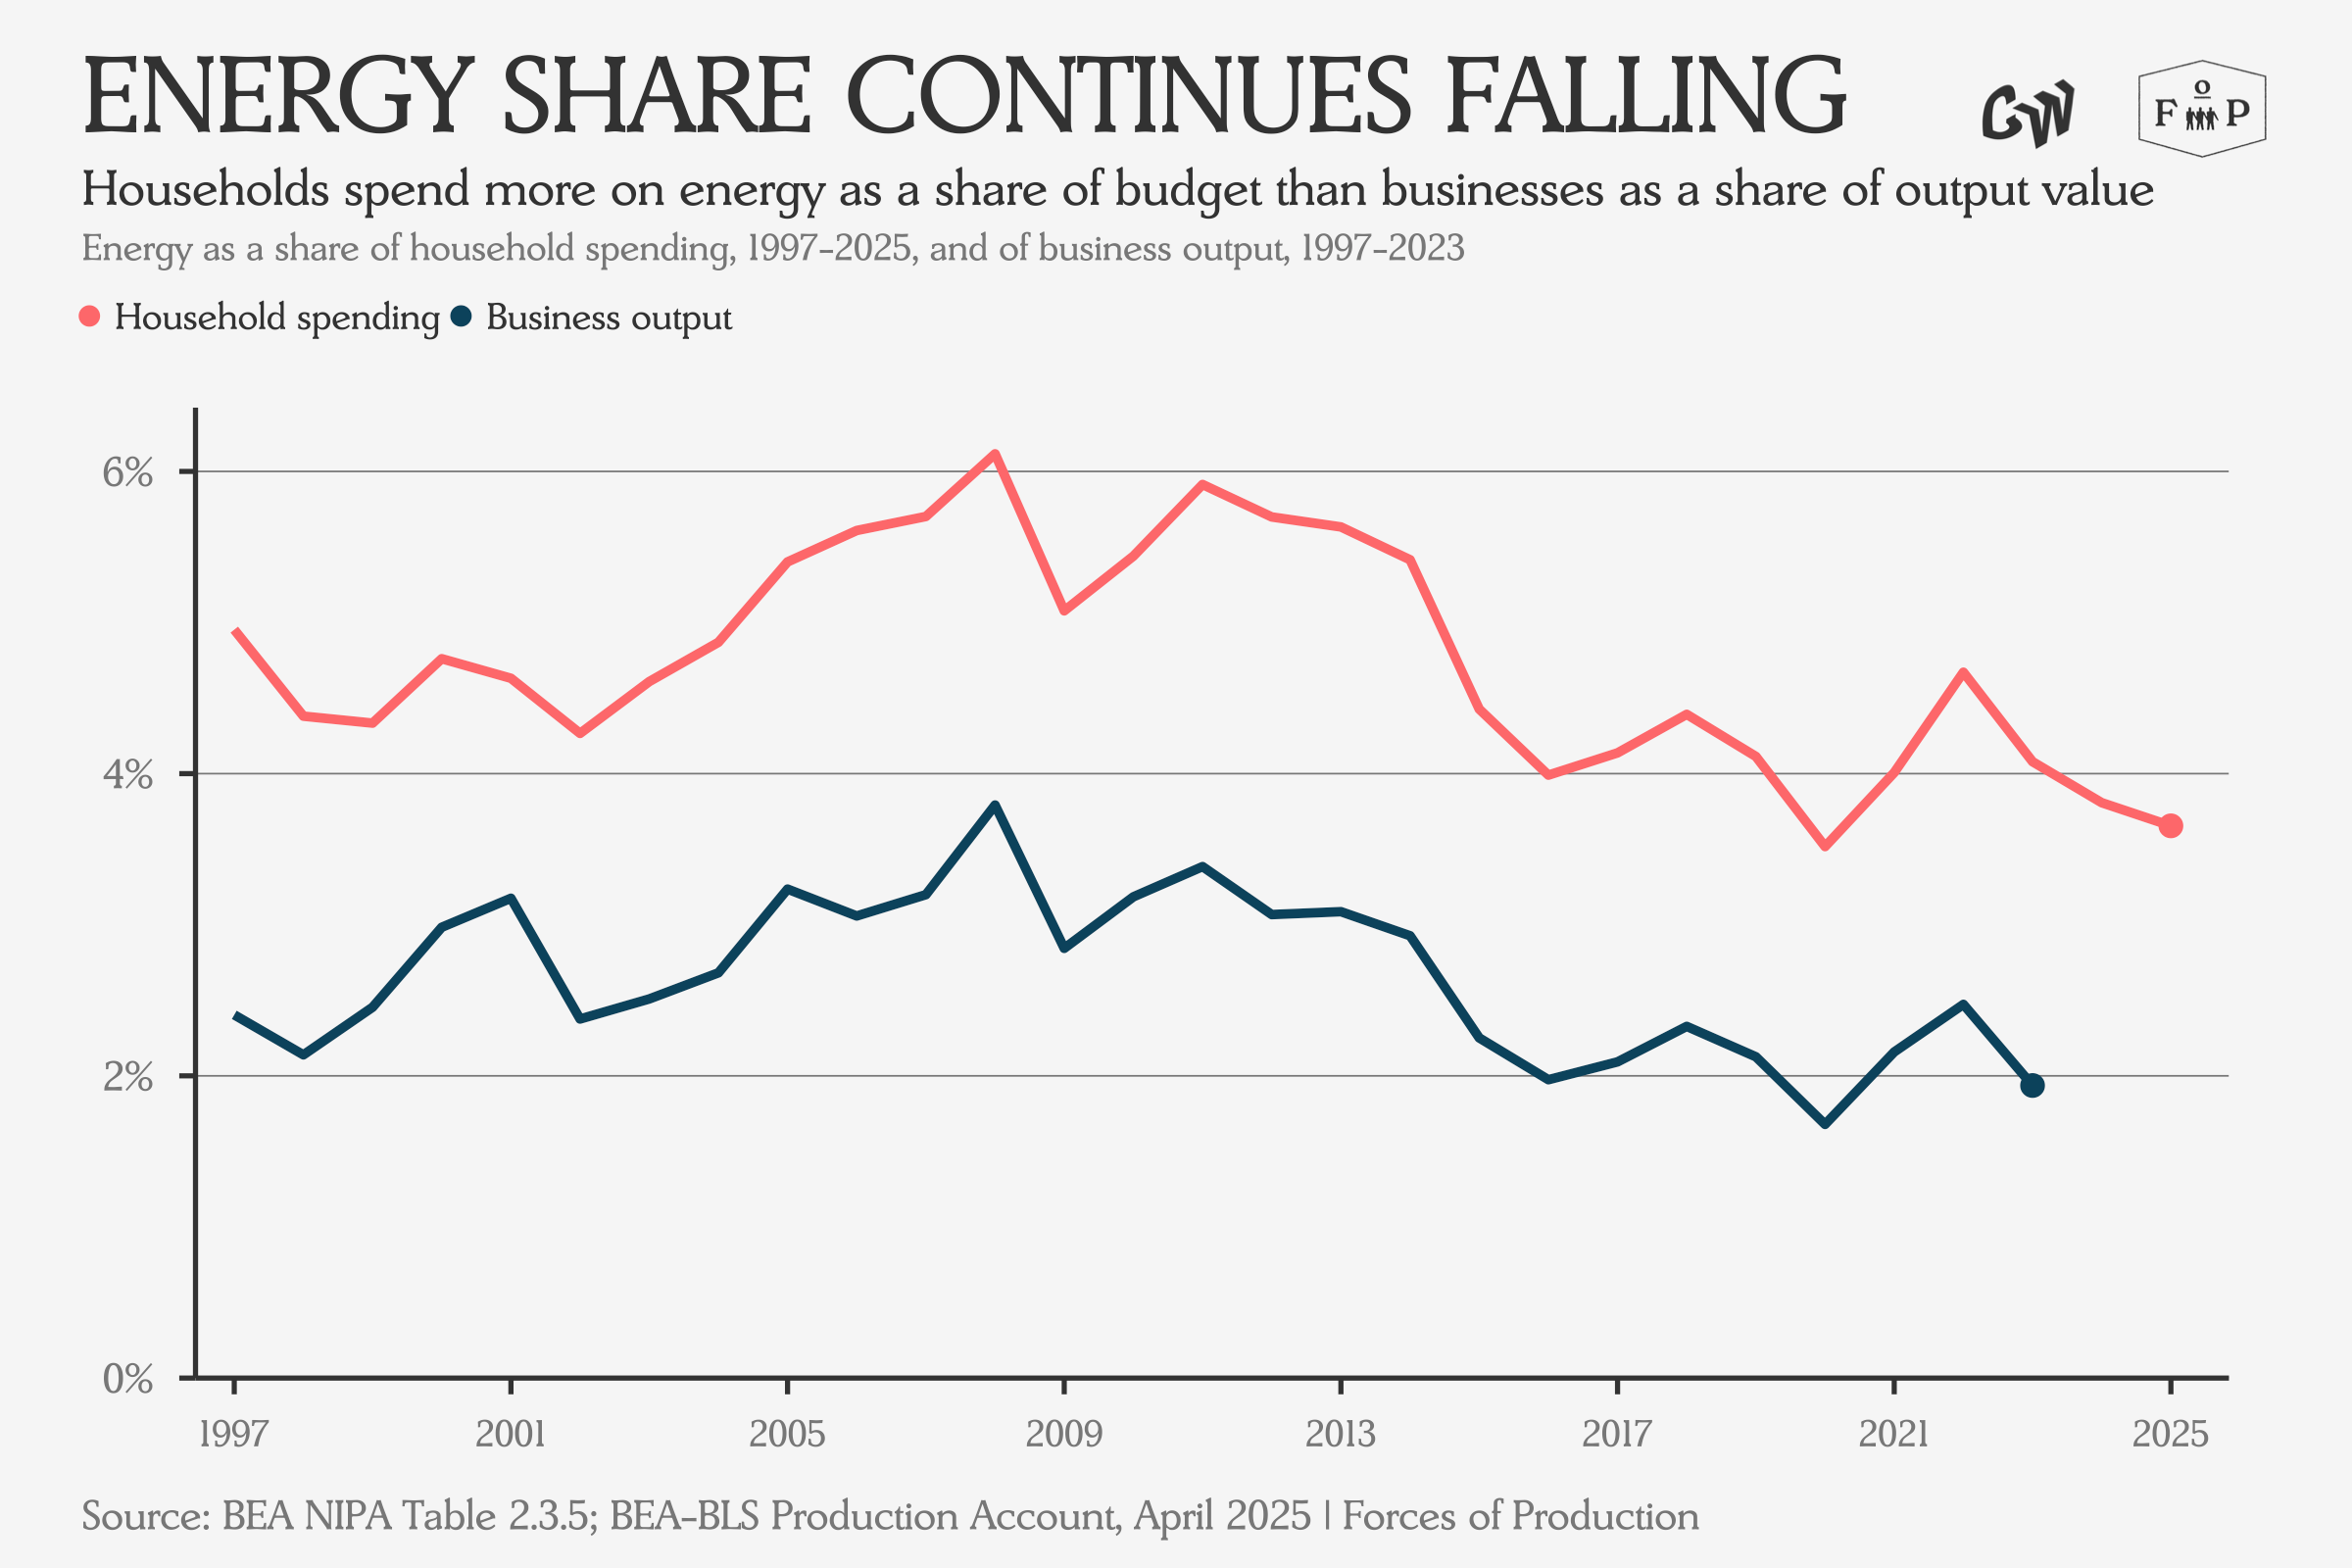
Looking closer at the supply side, this low aggregate number hides a handful of industries that are major users, but the amount these industries spend on energy — as a share of their output — has largely come down from earlier highs.
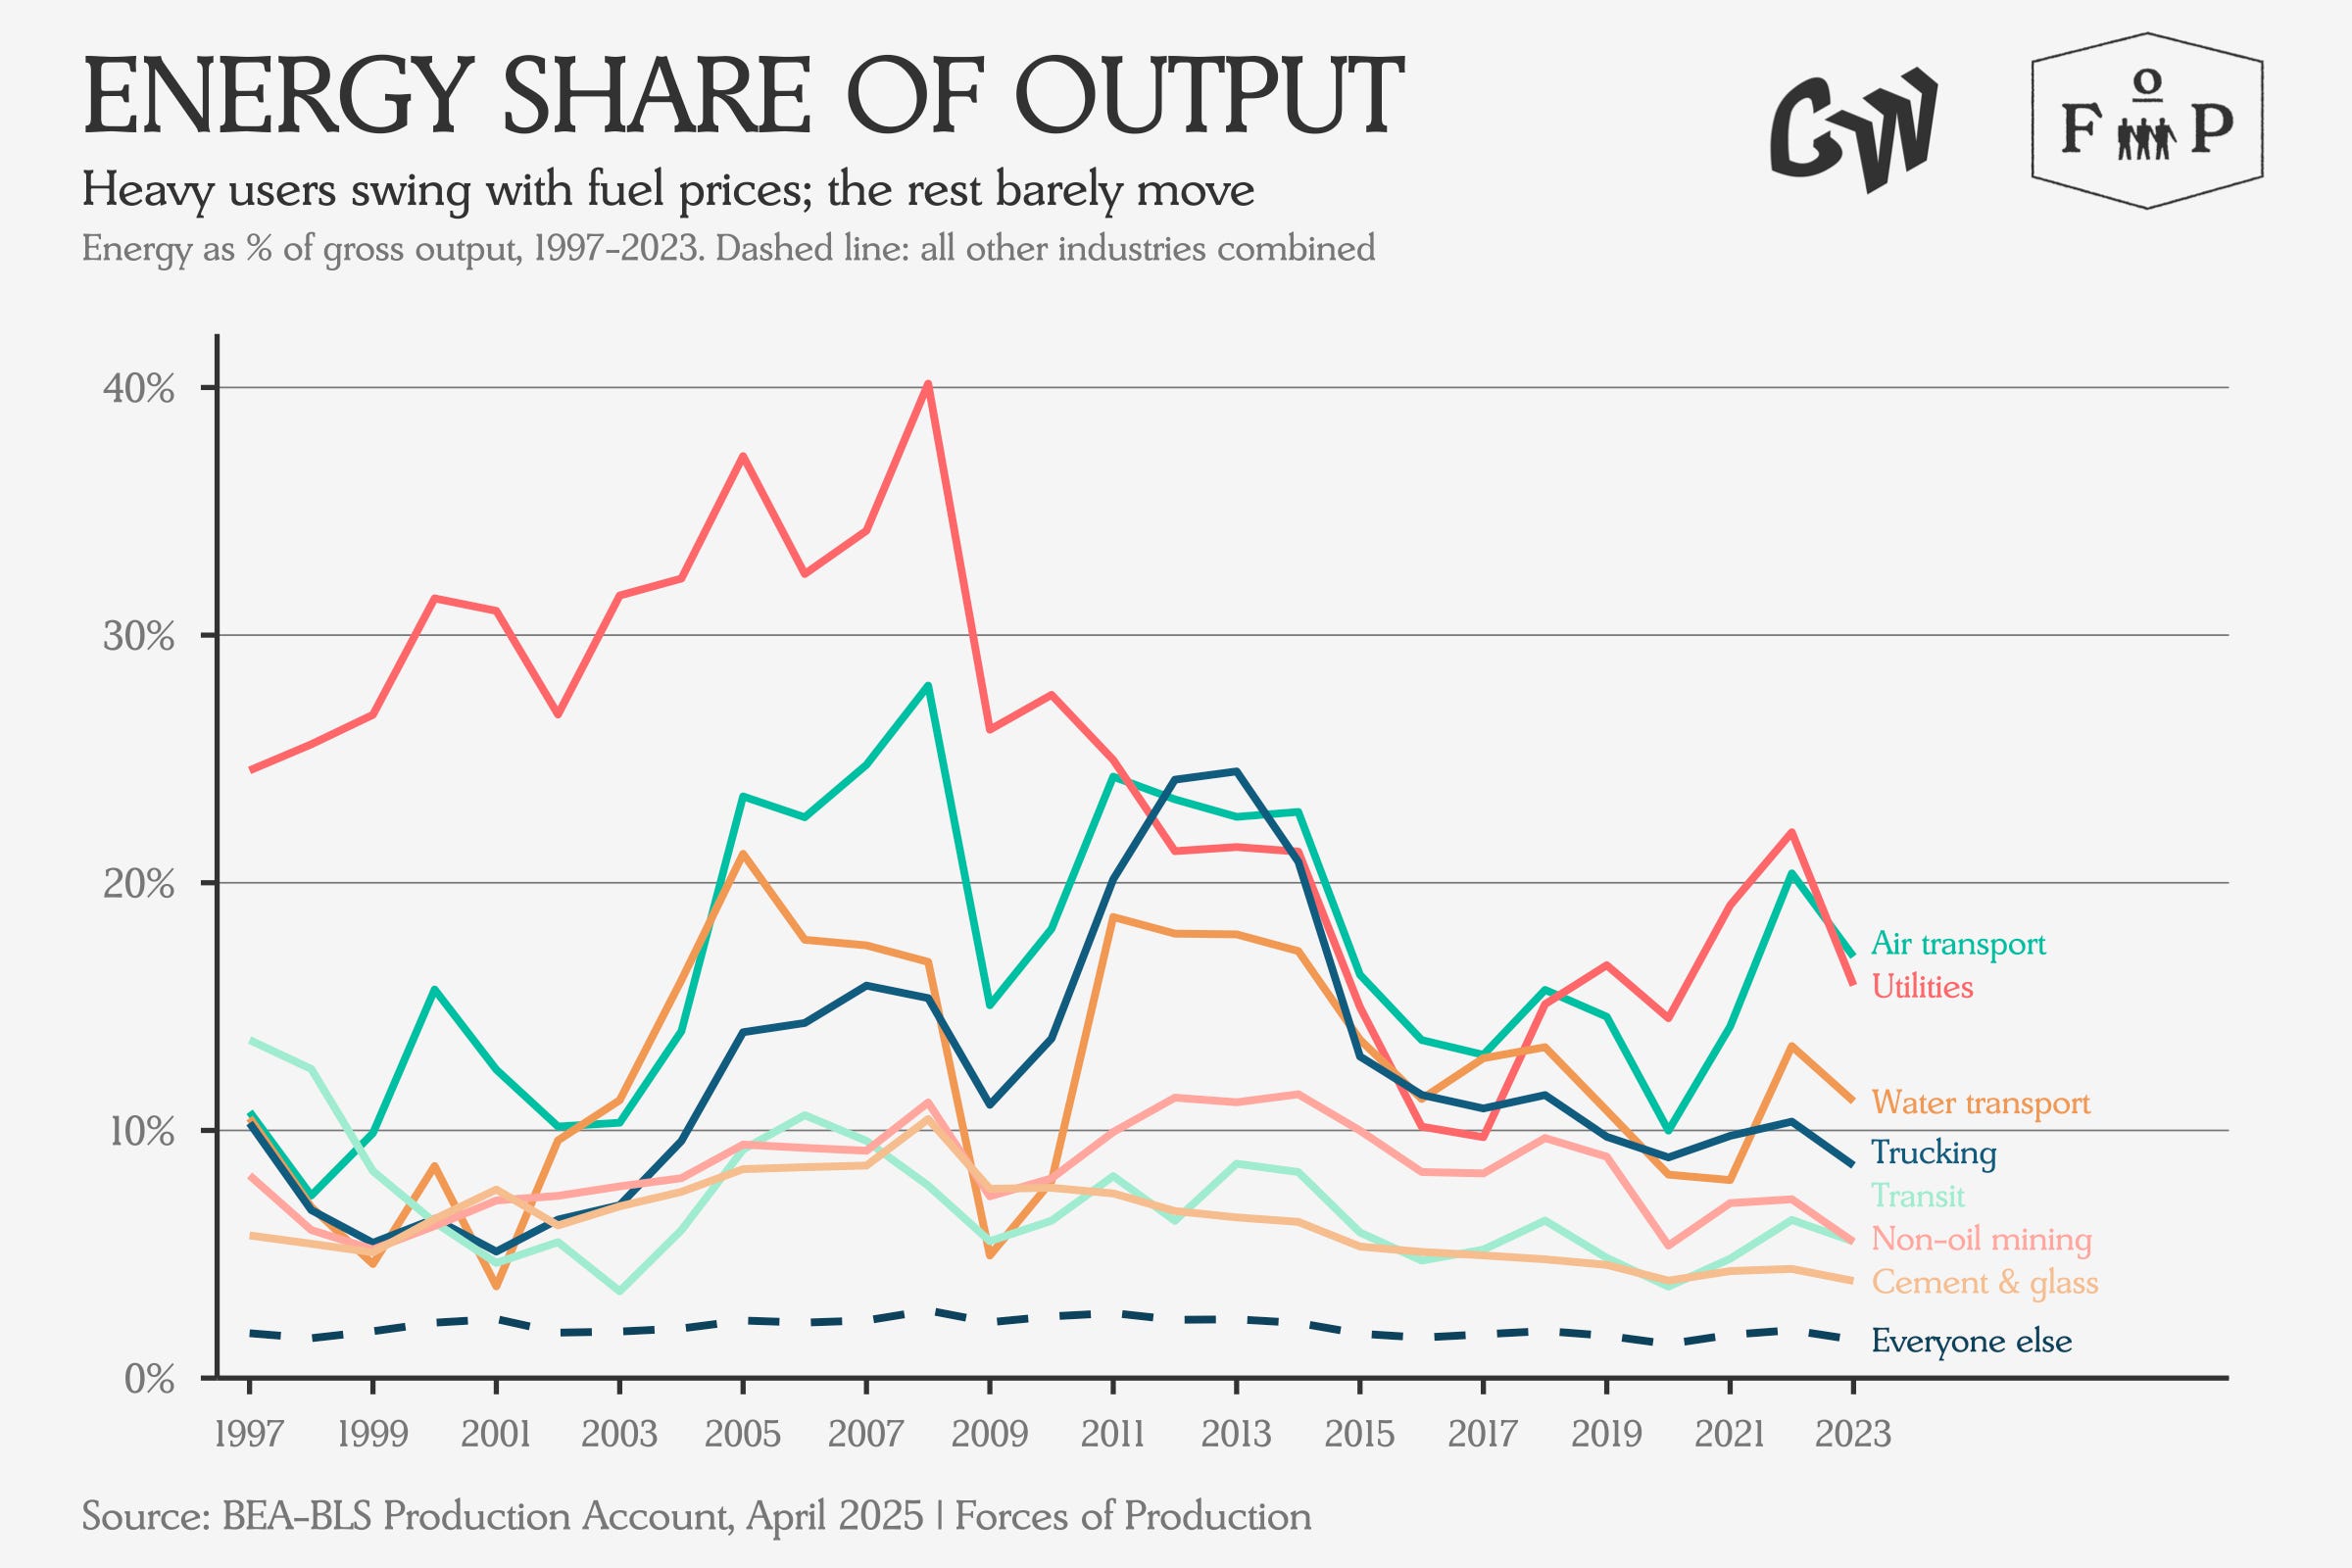
Let’s dig in on these energy-heavy industries. Our goal today is to add some sectoral detail to where on the supply side has felt stress from Republican energy policy, rather than just tariff policy. We break sectors out into Heavy Users and Big Spenders based on the share and absolute value of energy spending by the sector. The data that let us do this are the critical and underutilized production accounts, which decompose sector-level output into its inputs: Capital, Labor, Energy, Materials and Services (KLEMS).
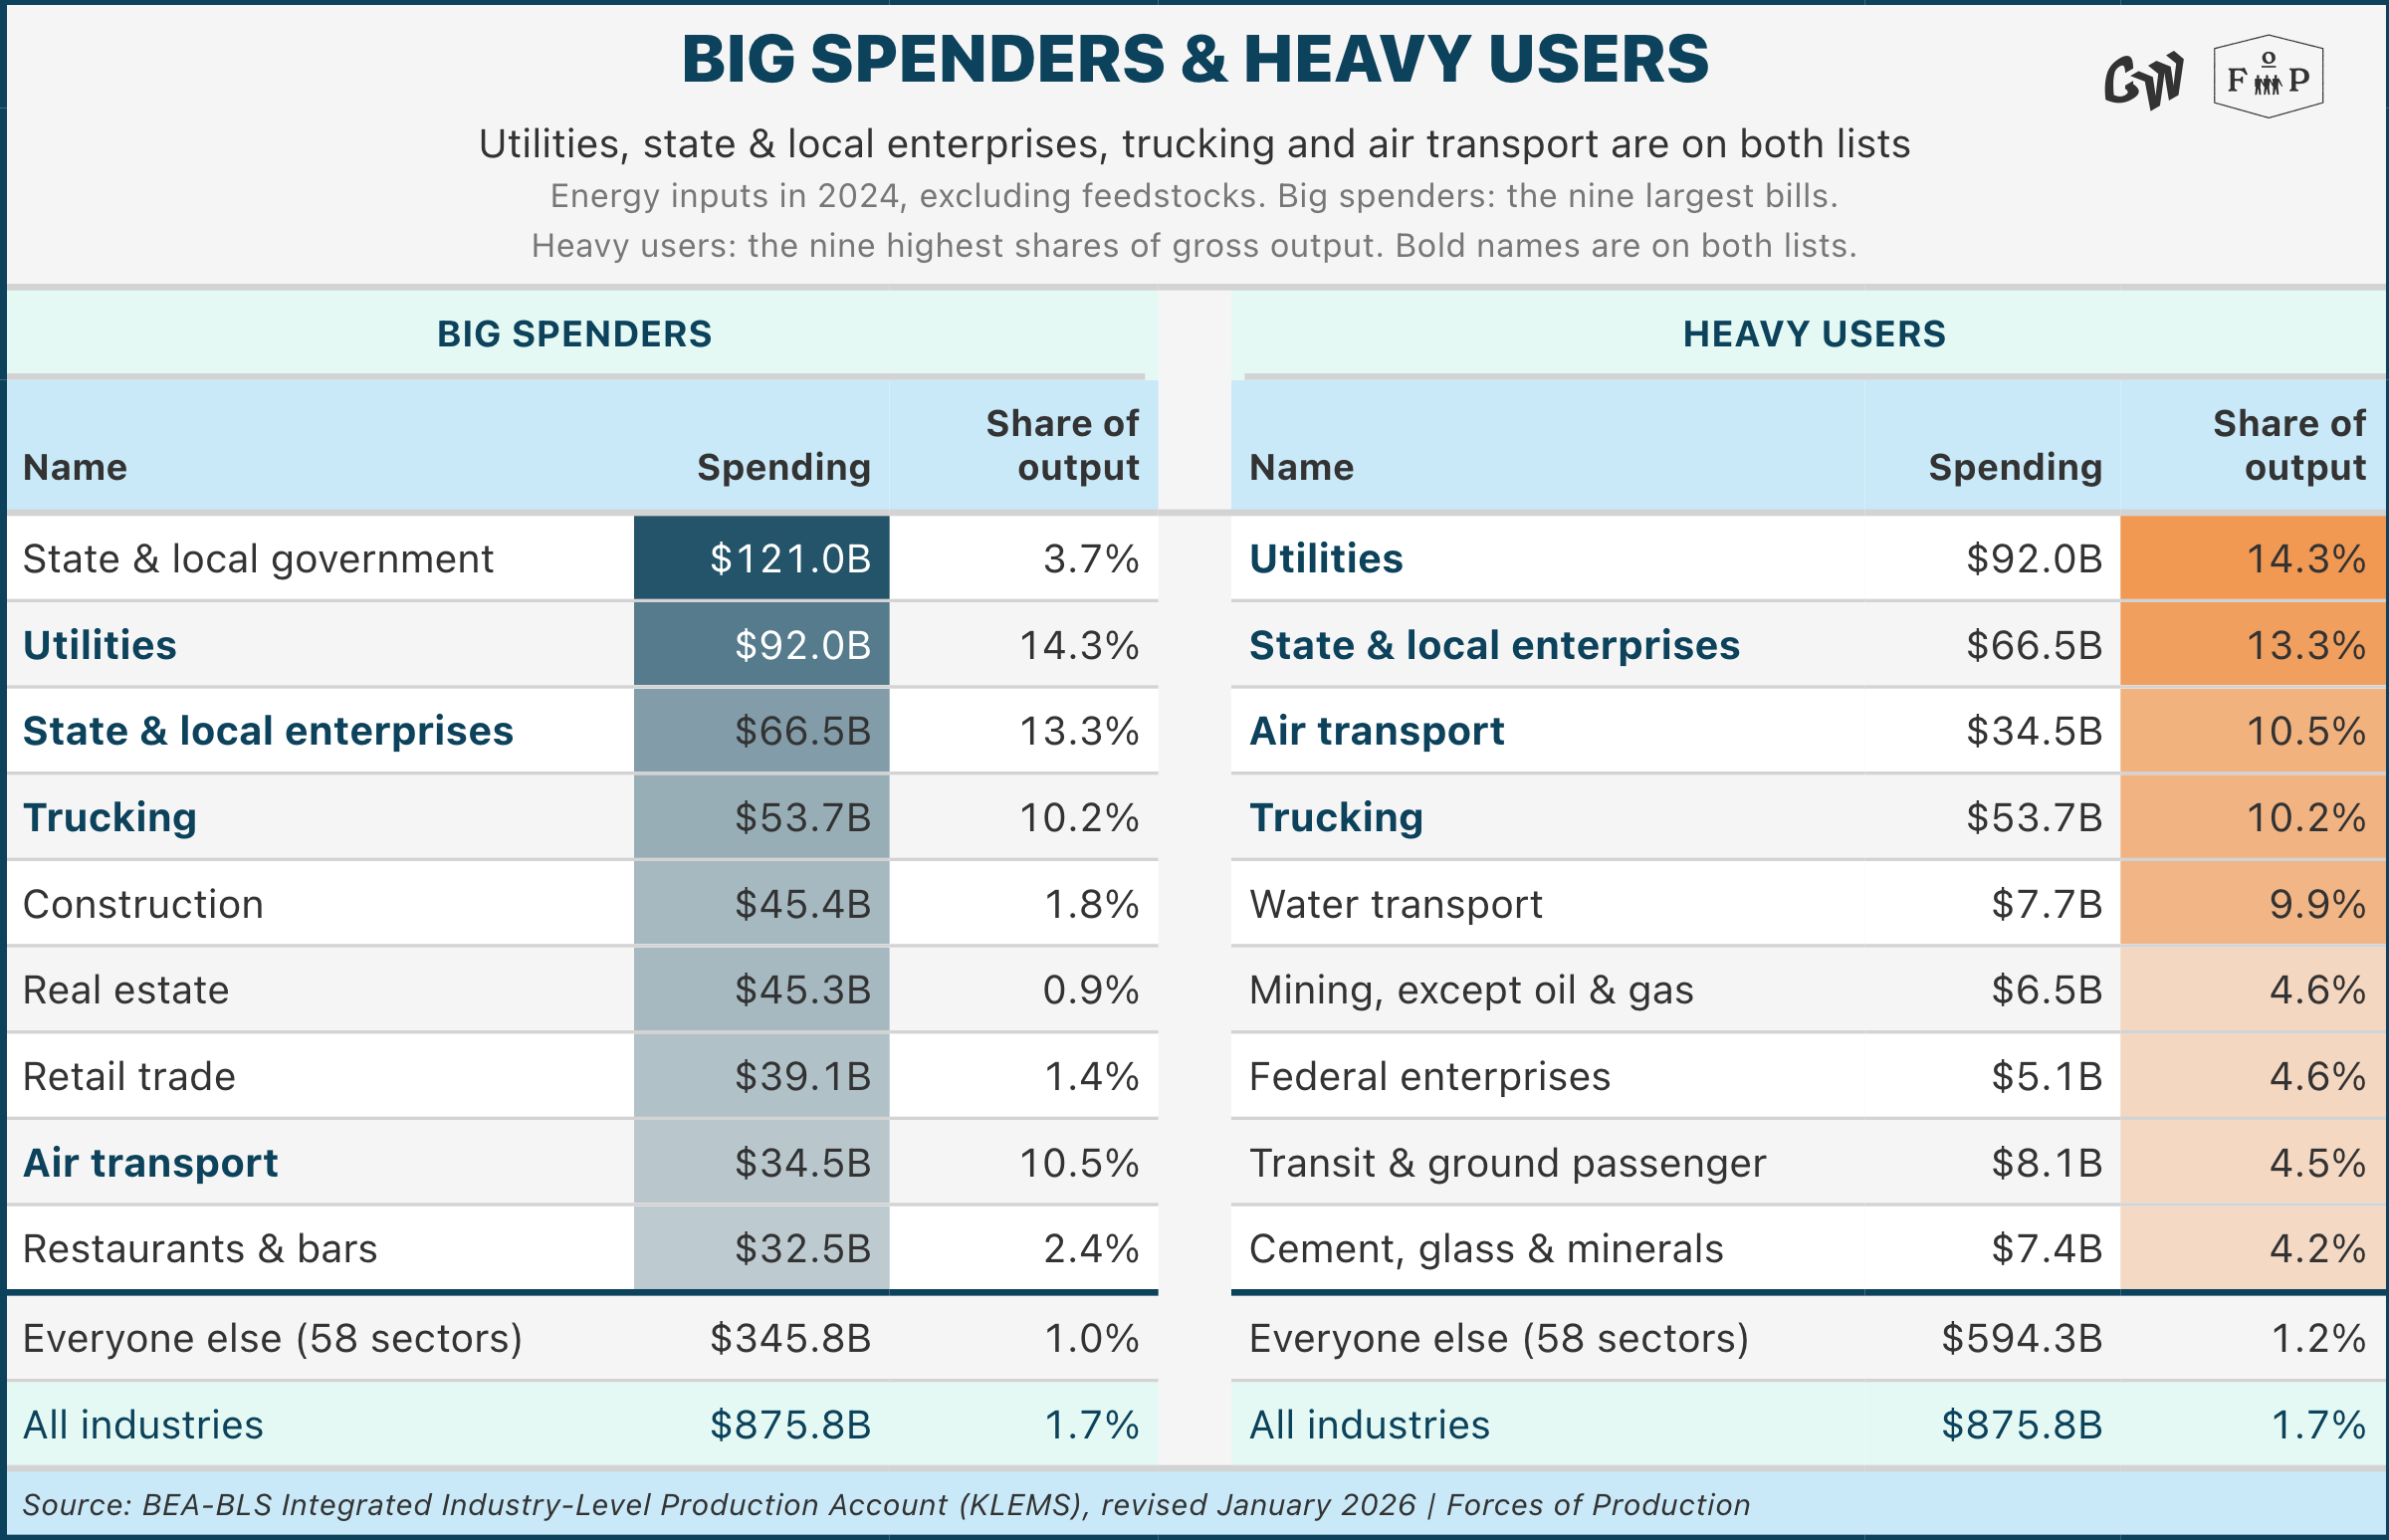
We see some interesting overlap and differences between the two measures: half of the top nine sectors, which represent almost 60 percent of supply-side energy spending, repeat between both and are accordingly bolded.
State and Local Government is particularly interesting, but the figure there includes all fuel purchases for State and Local Education, Transportation and more. As a major consumer of refined products, federal energy policy pursued via the Iran war will register as a massive surcharge to state and local governments and school districts across the country. State and Local Enterprises are, in significant part, publicly owned power companies.
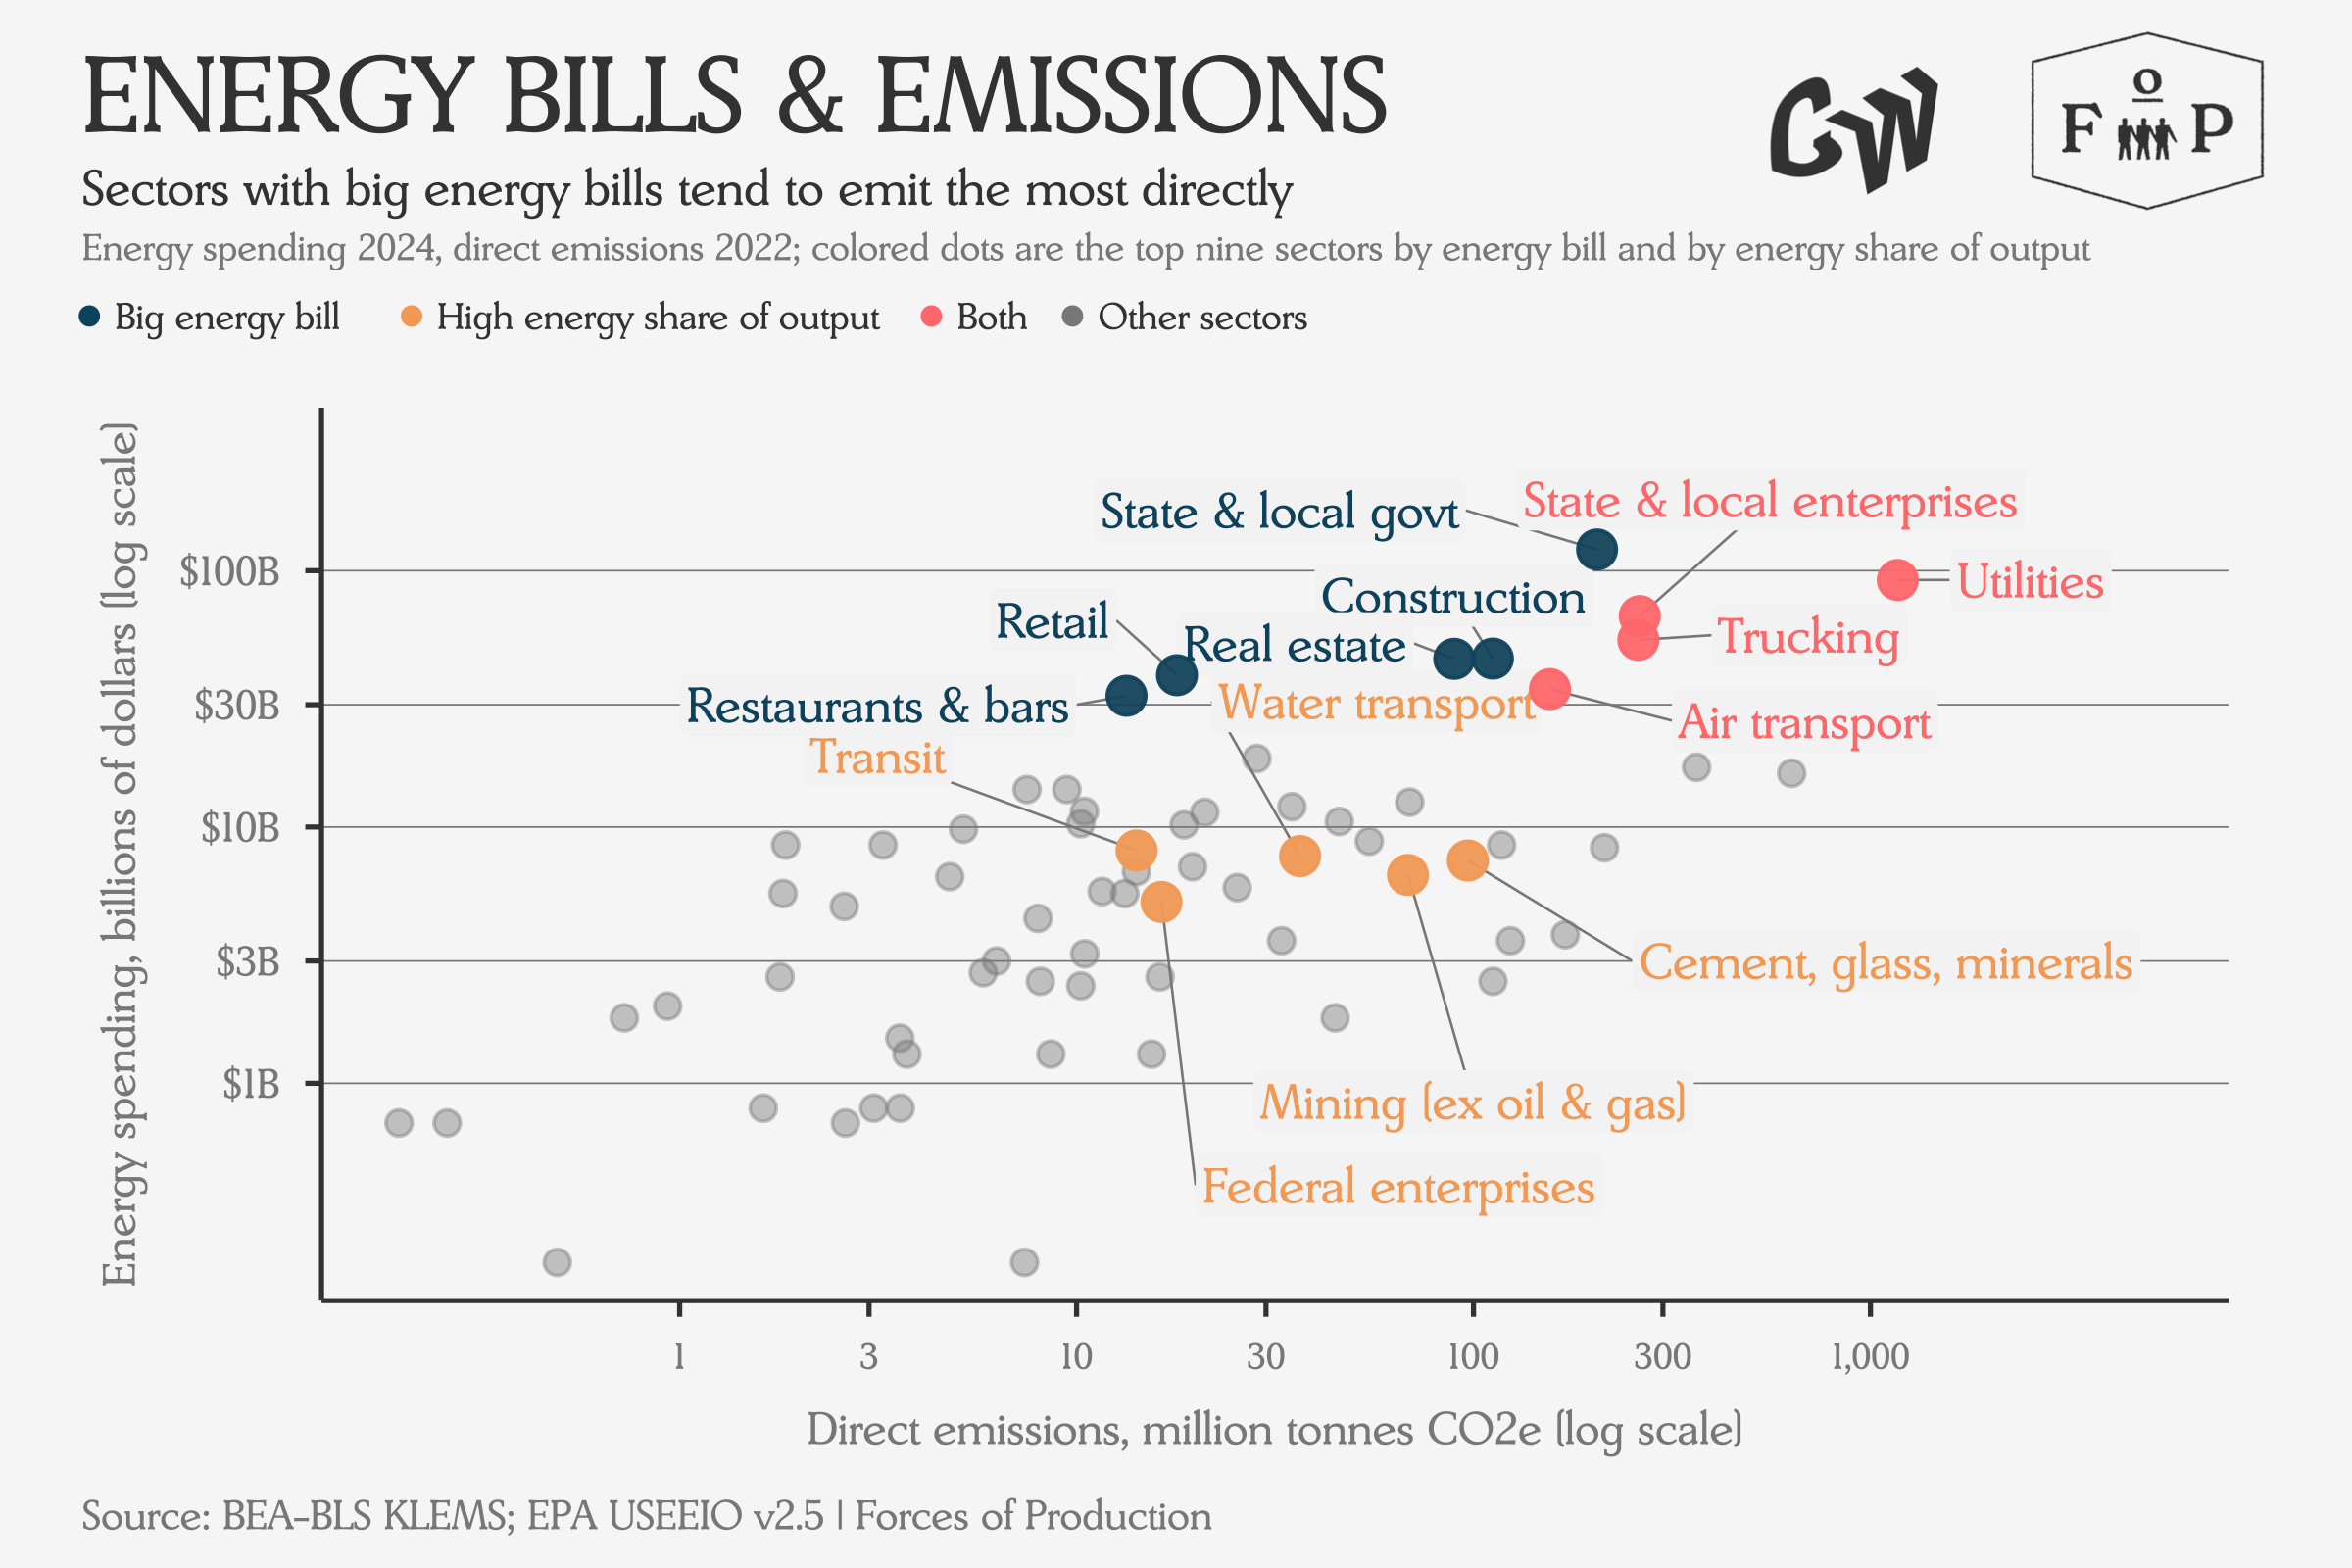
We can also see that the sectors with the highest energy bills — especially those that mostly buy fossil energy — contribute more direct emissions than the most energy-intensive sectors.
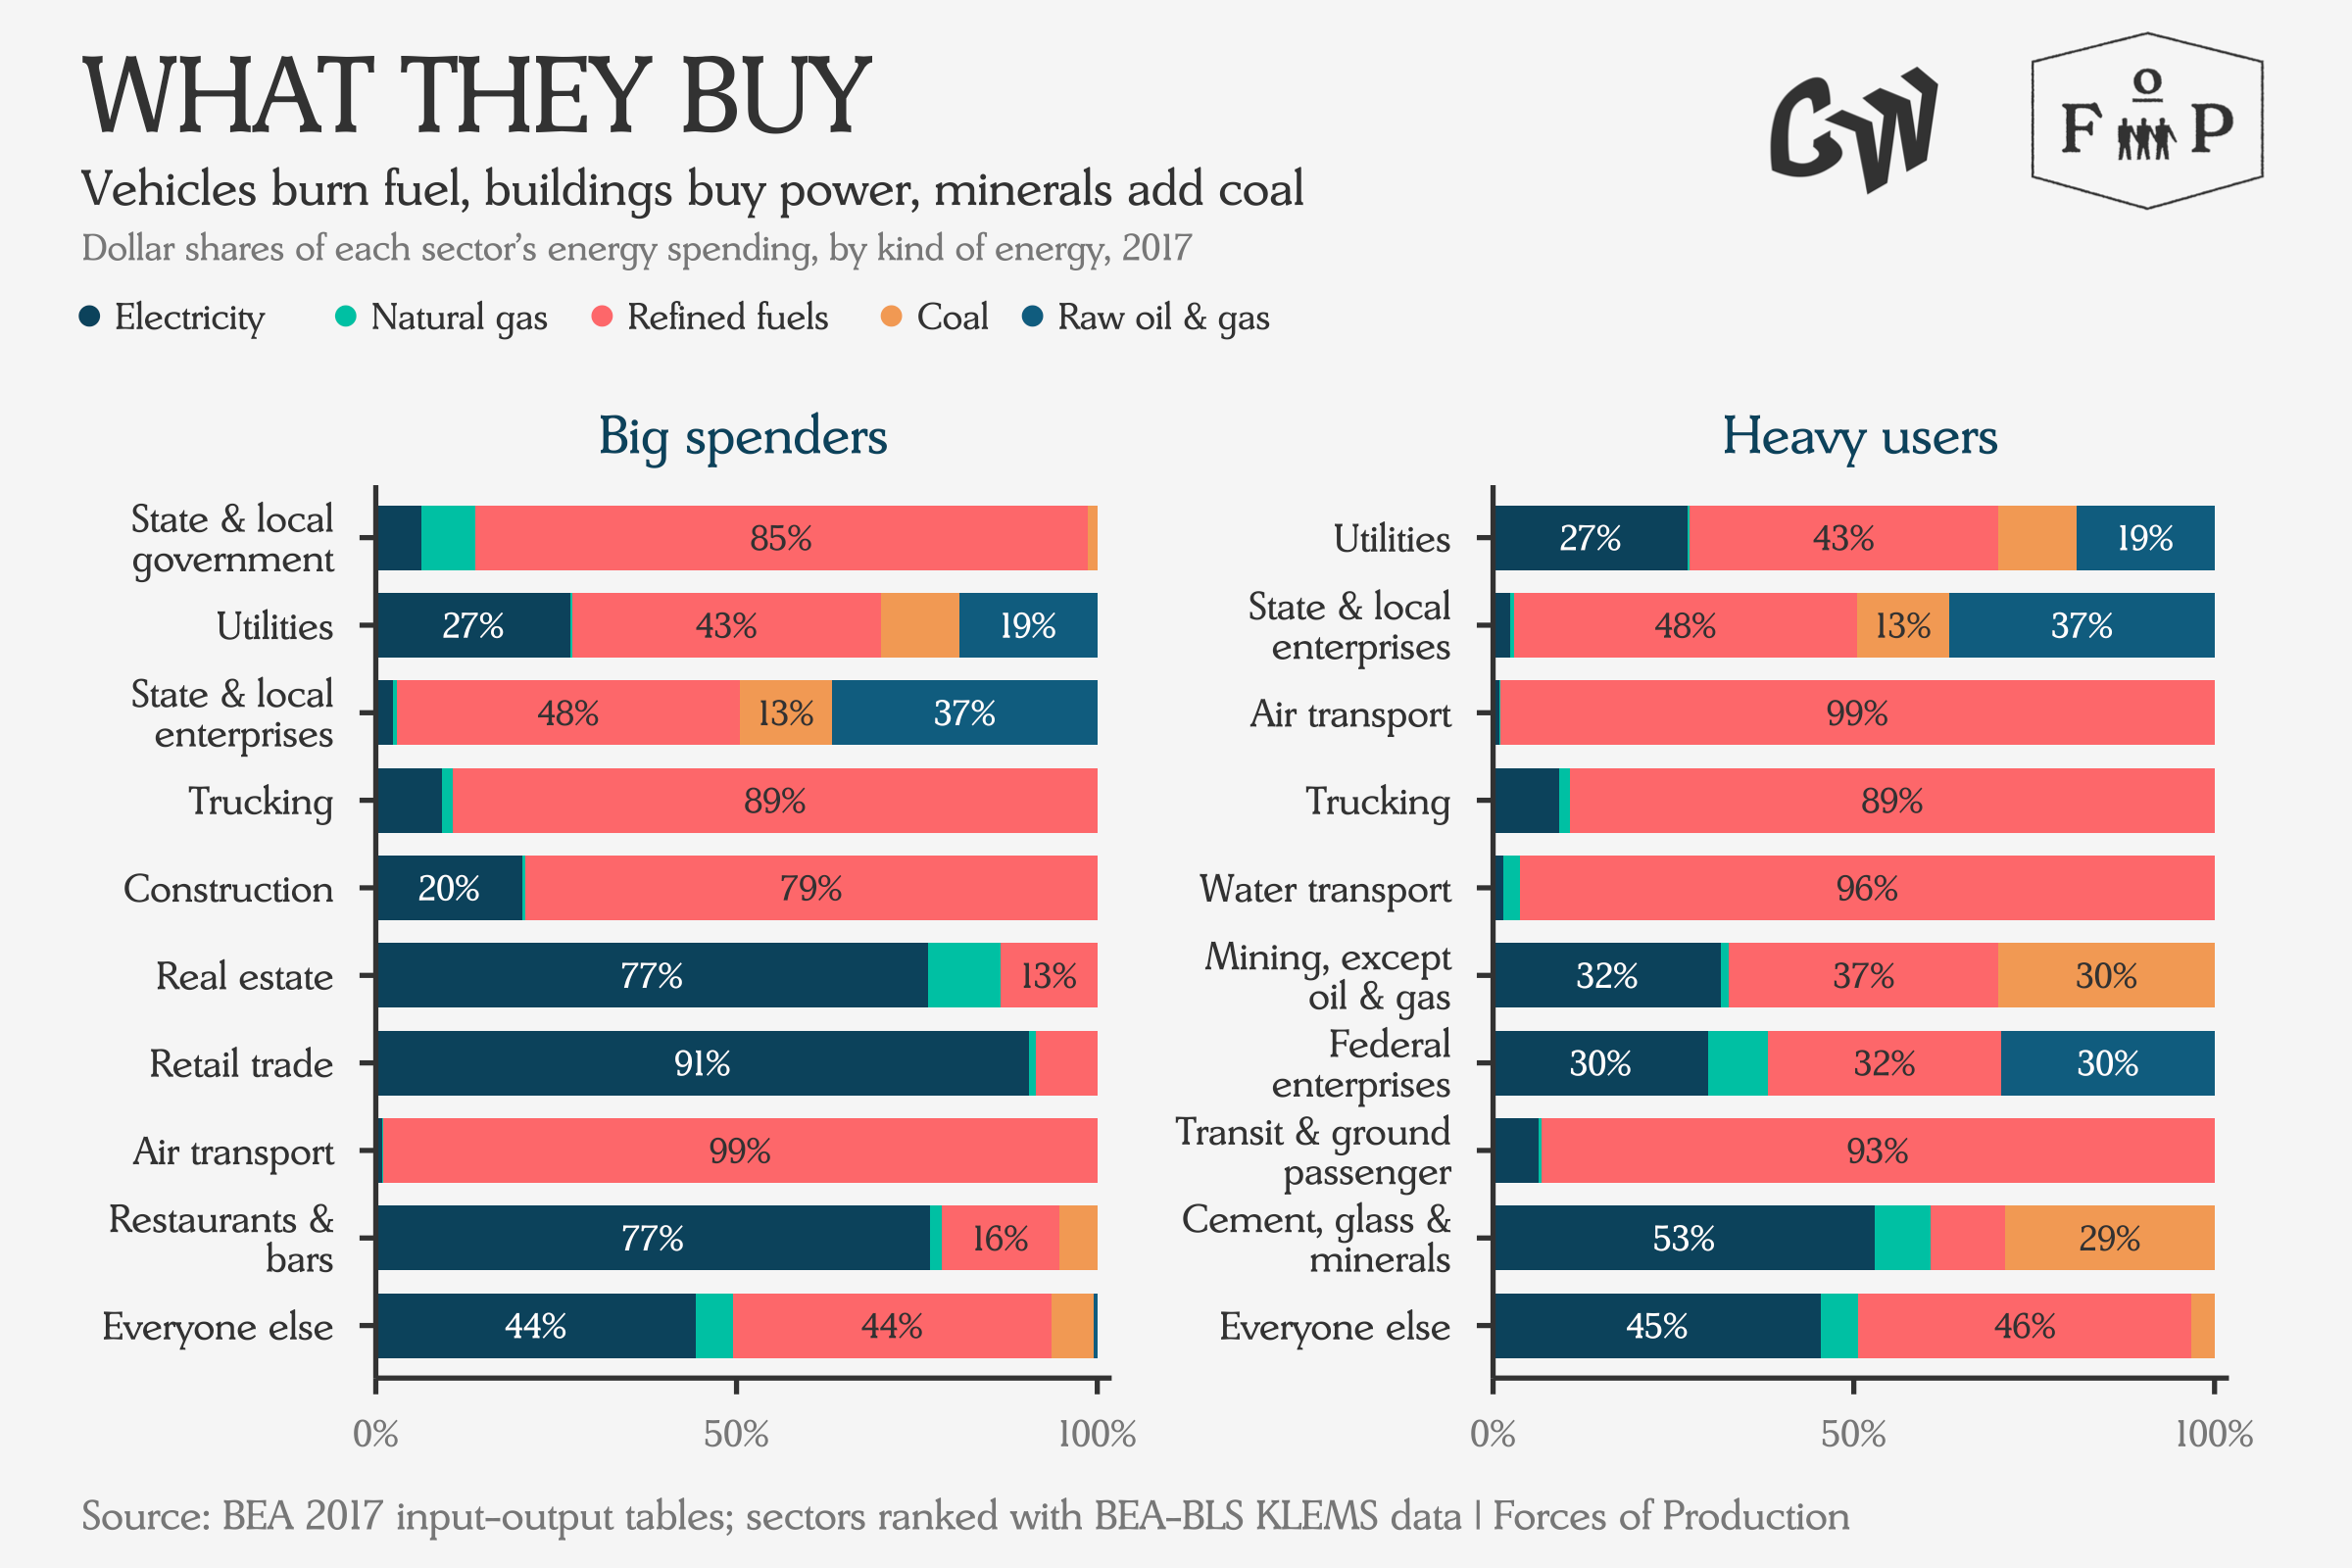
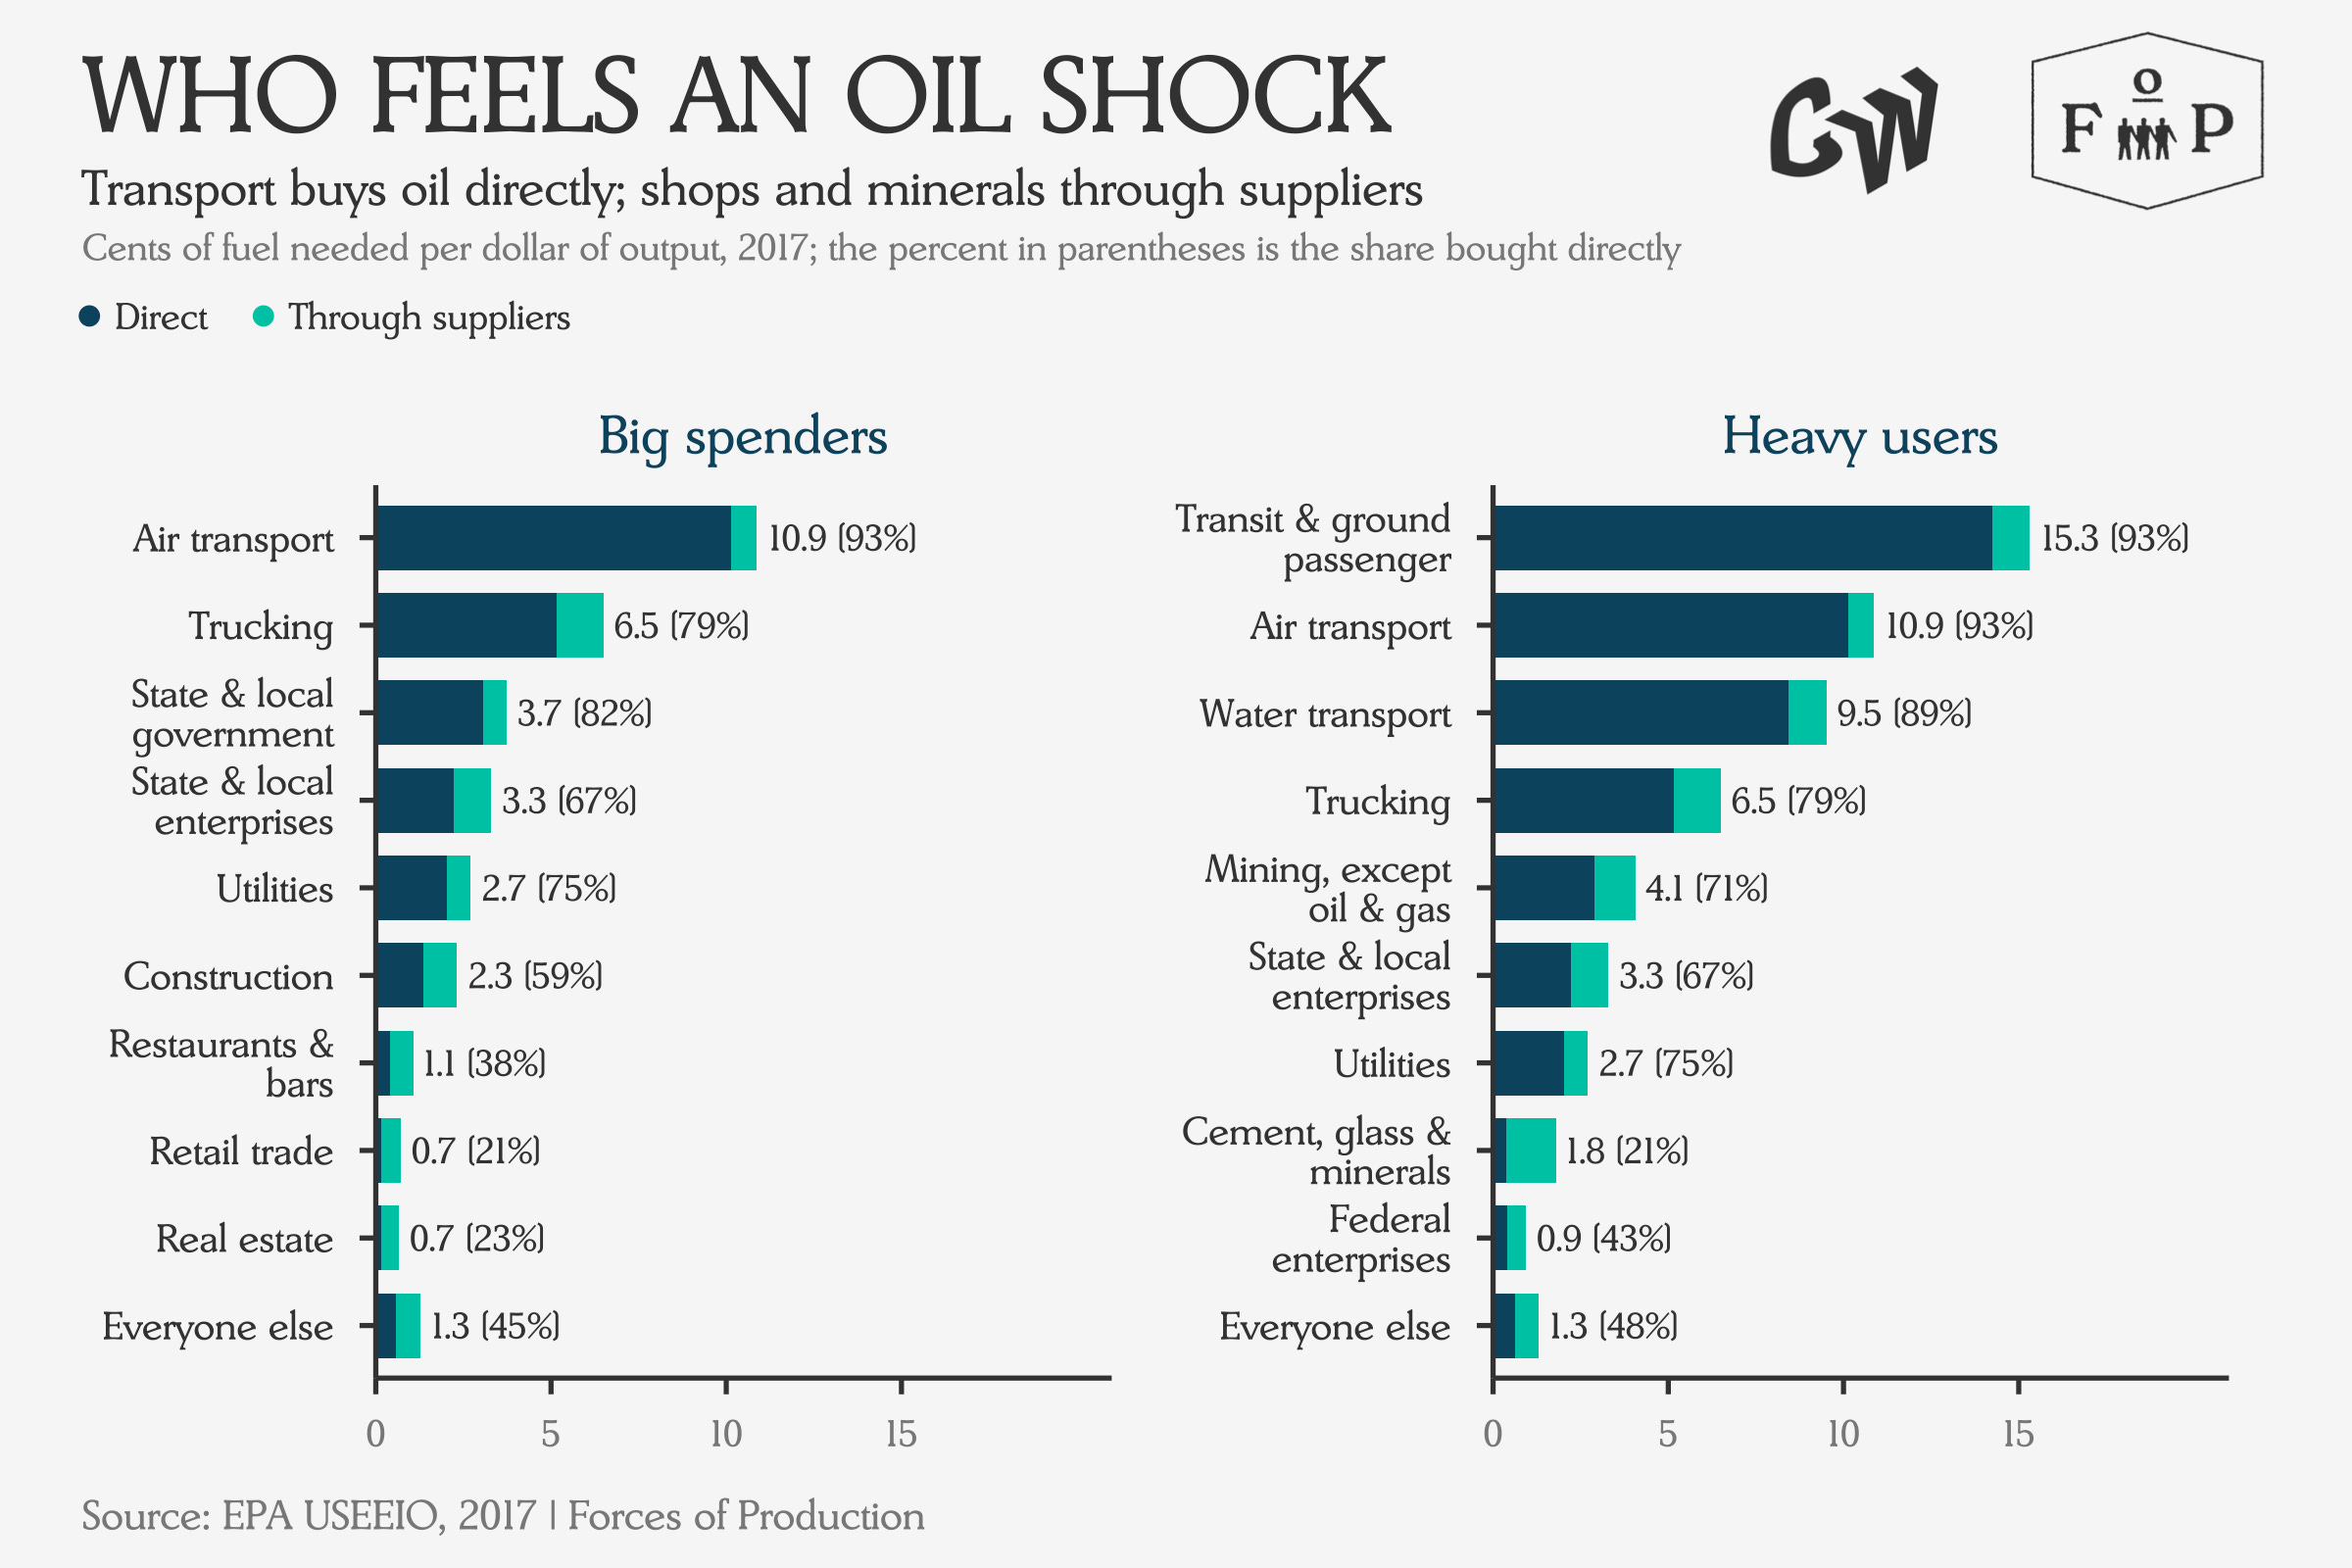
We can also see that while the economy at large has a balanced exposure to electricity and refined products as energy sources, the Big Spenders tend to use more electricity, while the Heavy Users depend more on refined products. This difference shows up clearly when we look at who we would expect to be affected by a shock to refined product prices.
One interesting thing that the EPA I-O emissions data lets us do is track energy flows between sectors at a more granular level than the BLS and BEA make available. For example, Cement and Glass is a Heavy User of energy.
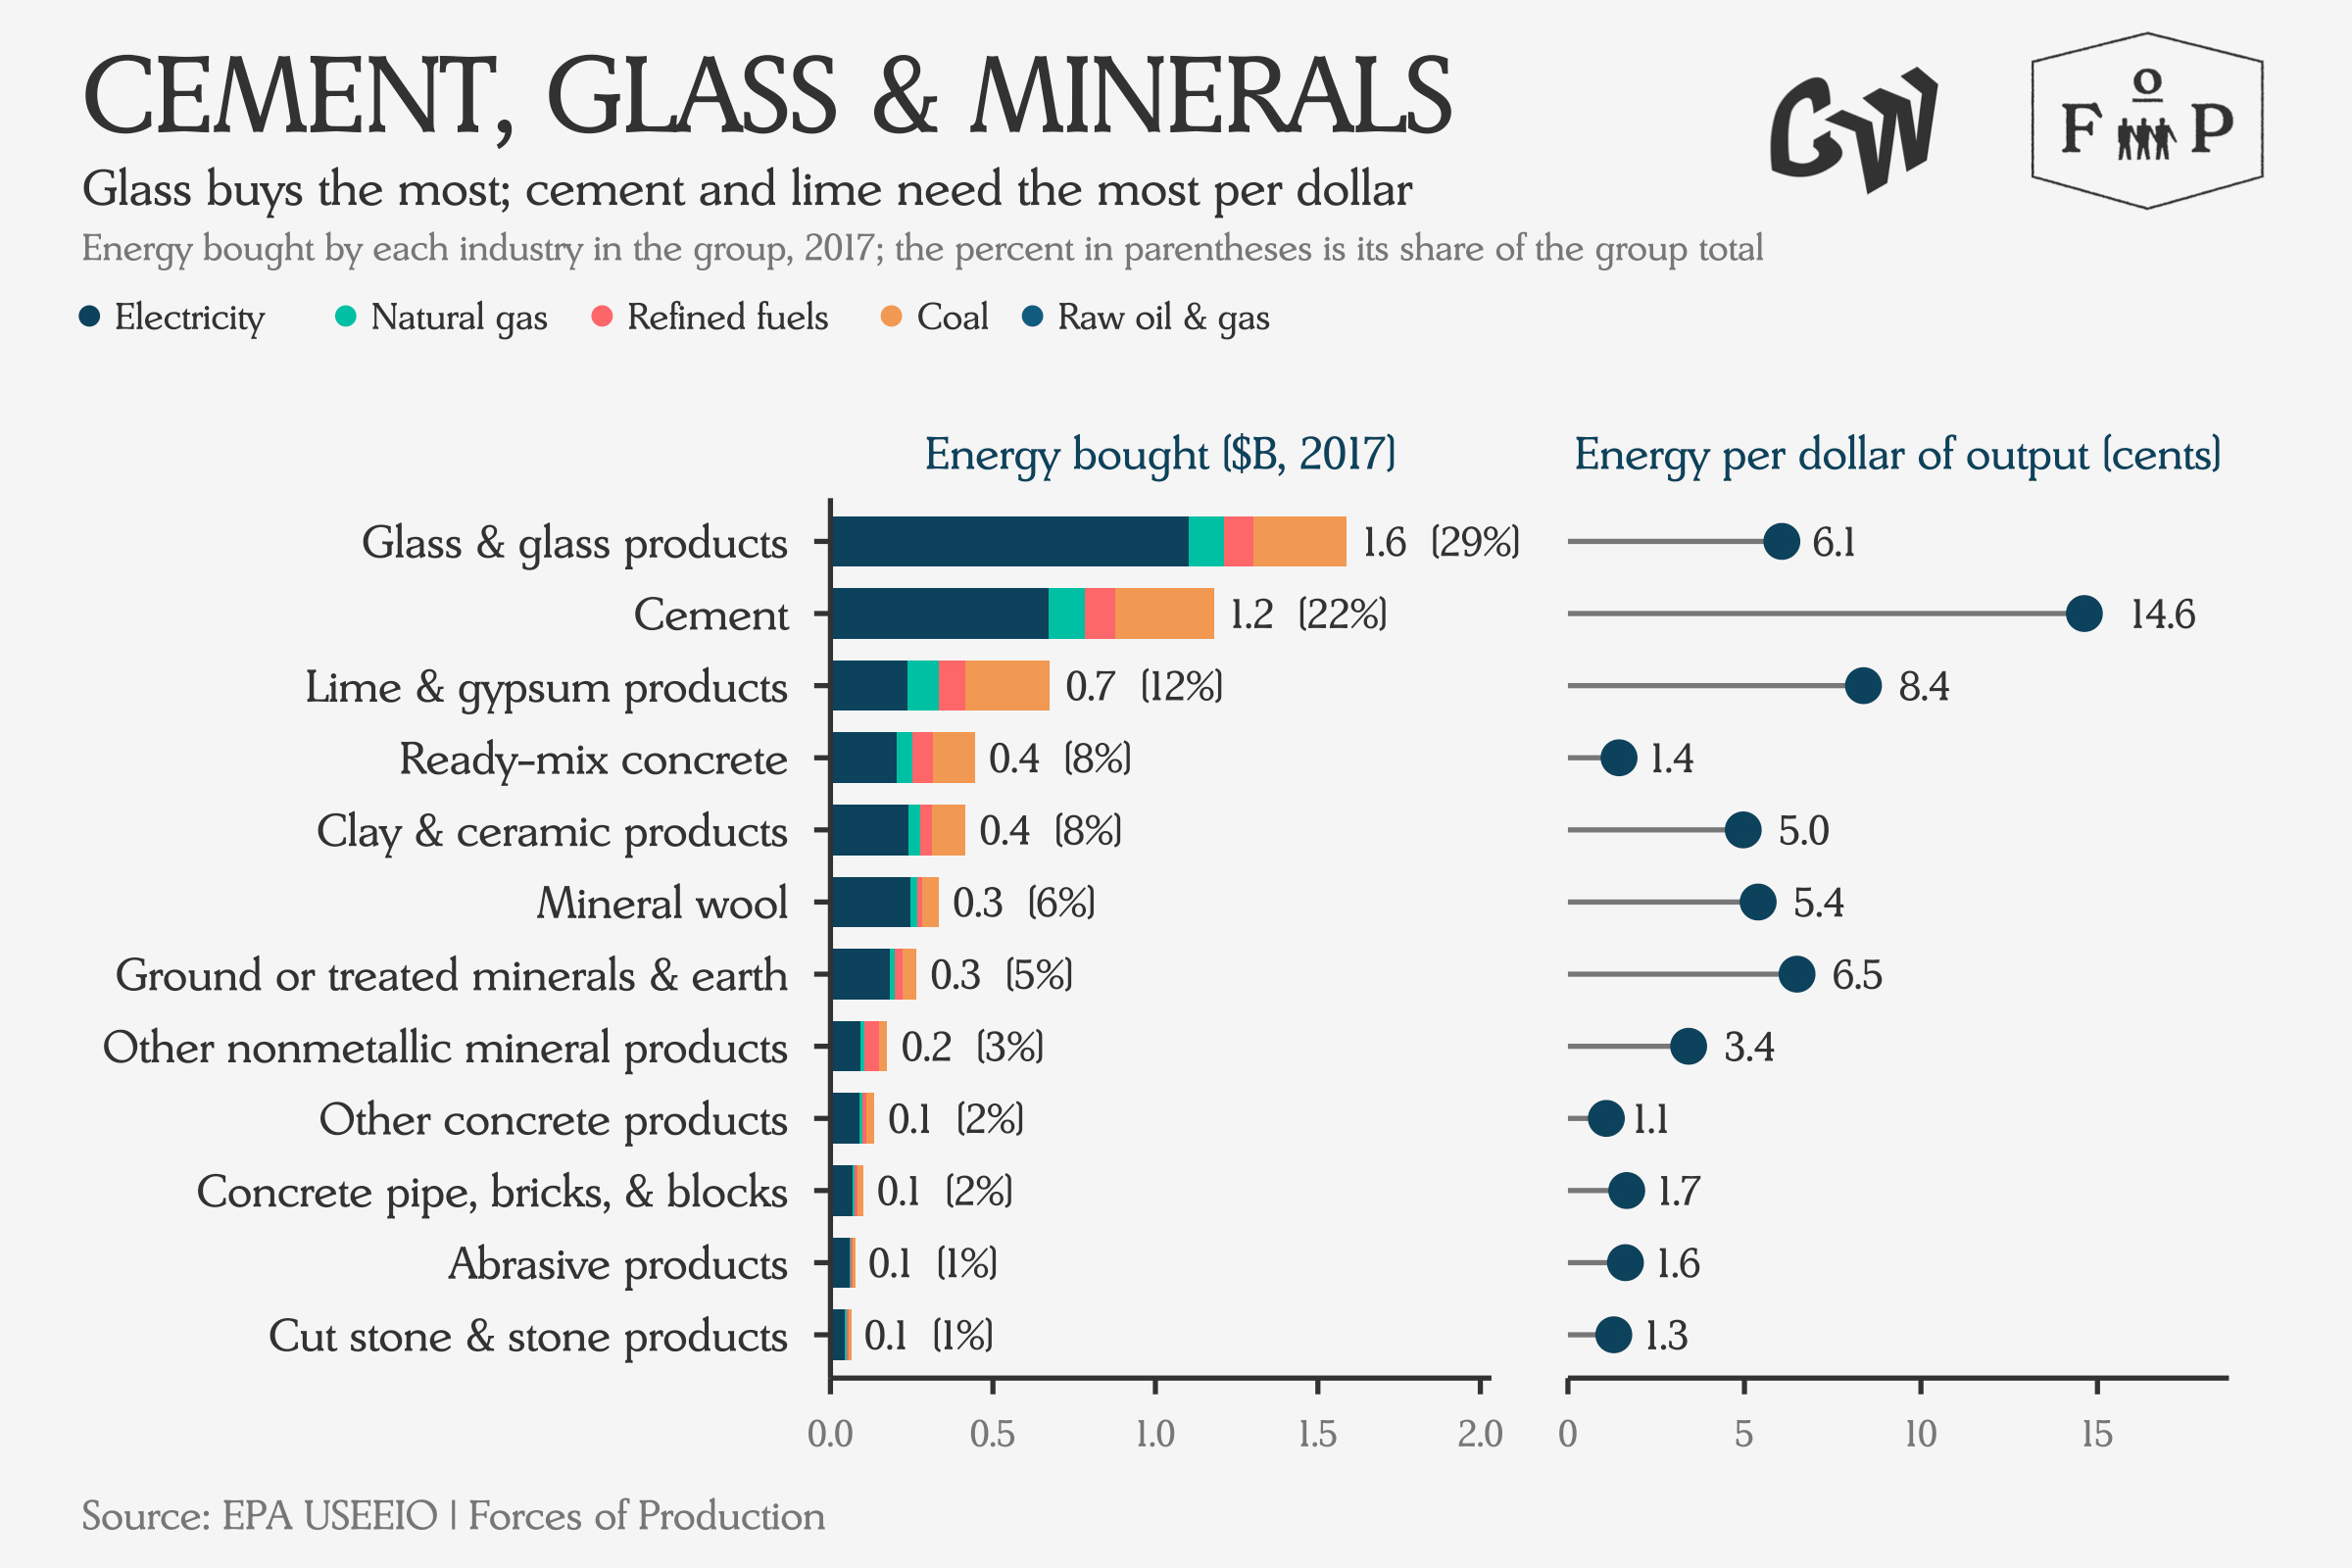
Yet when we break out its subsectors, a few important things jump out. The top three subsectors, Glass, Cement and Lime & Gypsum, amount to over 60 percent of the energy spending in the sector. Coal remains a significant energy source for each of these subsectors. A higher share of cement industry output is spent on energy than in the Air Transport industry.
Energy policy is critical to get right because it affects households directly, has a significant impact on costs for state and local governments, and strongly impacts a handful of key intermediary sectors, driving costs up across the supply side in the process. Abandoning renewable has proven to be a major mistake by the GOP trifecta government, especially while pursuing a foreign policy of actively instigating disruption in global energy markets.
The high emissions and fossil energy spend of state and local governments also offer an important angle for making State and Local Government budgets less exposed to global price swings by electrifying public and educational transportation. Reining in rising energy prices through a commitment to massively deploy renewable energy while building out a public grid should play a central role in the next Congress as well.
This Month’s Data
This month we are looking at the September supply side data, observing the economy in the run-up to this month’s midterm results. On the whole, the supply side continued to see a deceleration in employment growth, a surge in prices, growth in the trade deficit on rising imports and a surprising increase in industrial production. The Hormuz Crisis and the end of Biden-era fiscal supports continue to be the major thematics on the supply side.
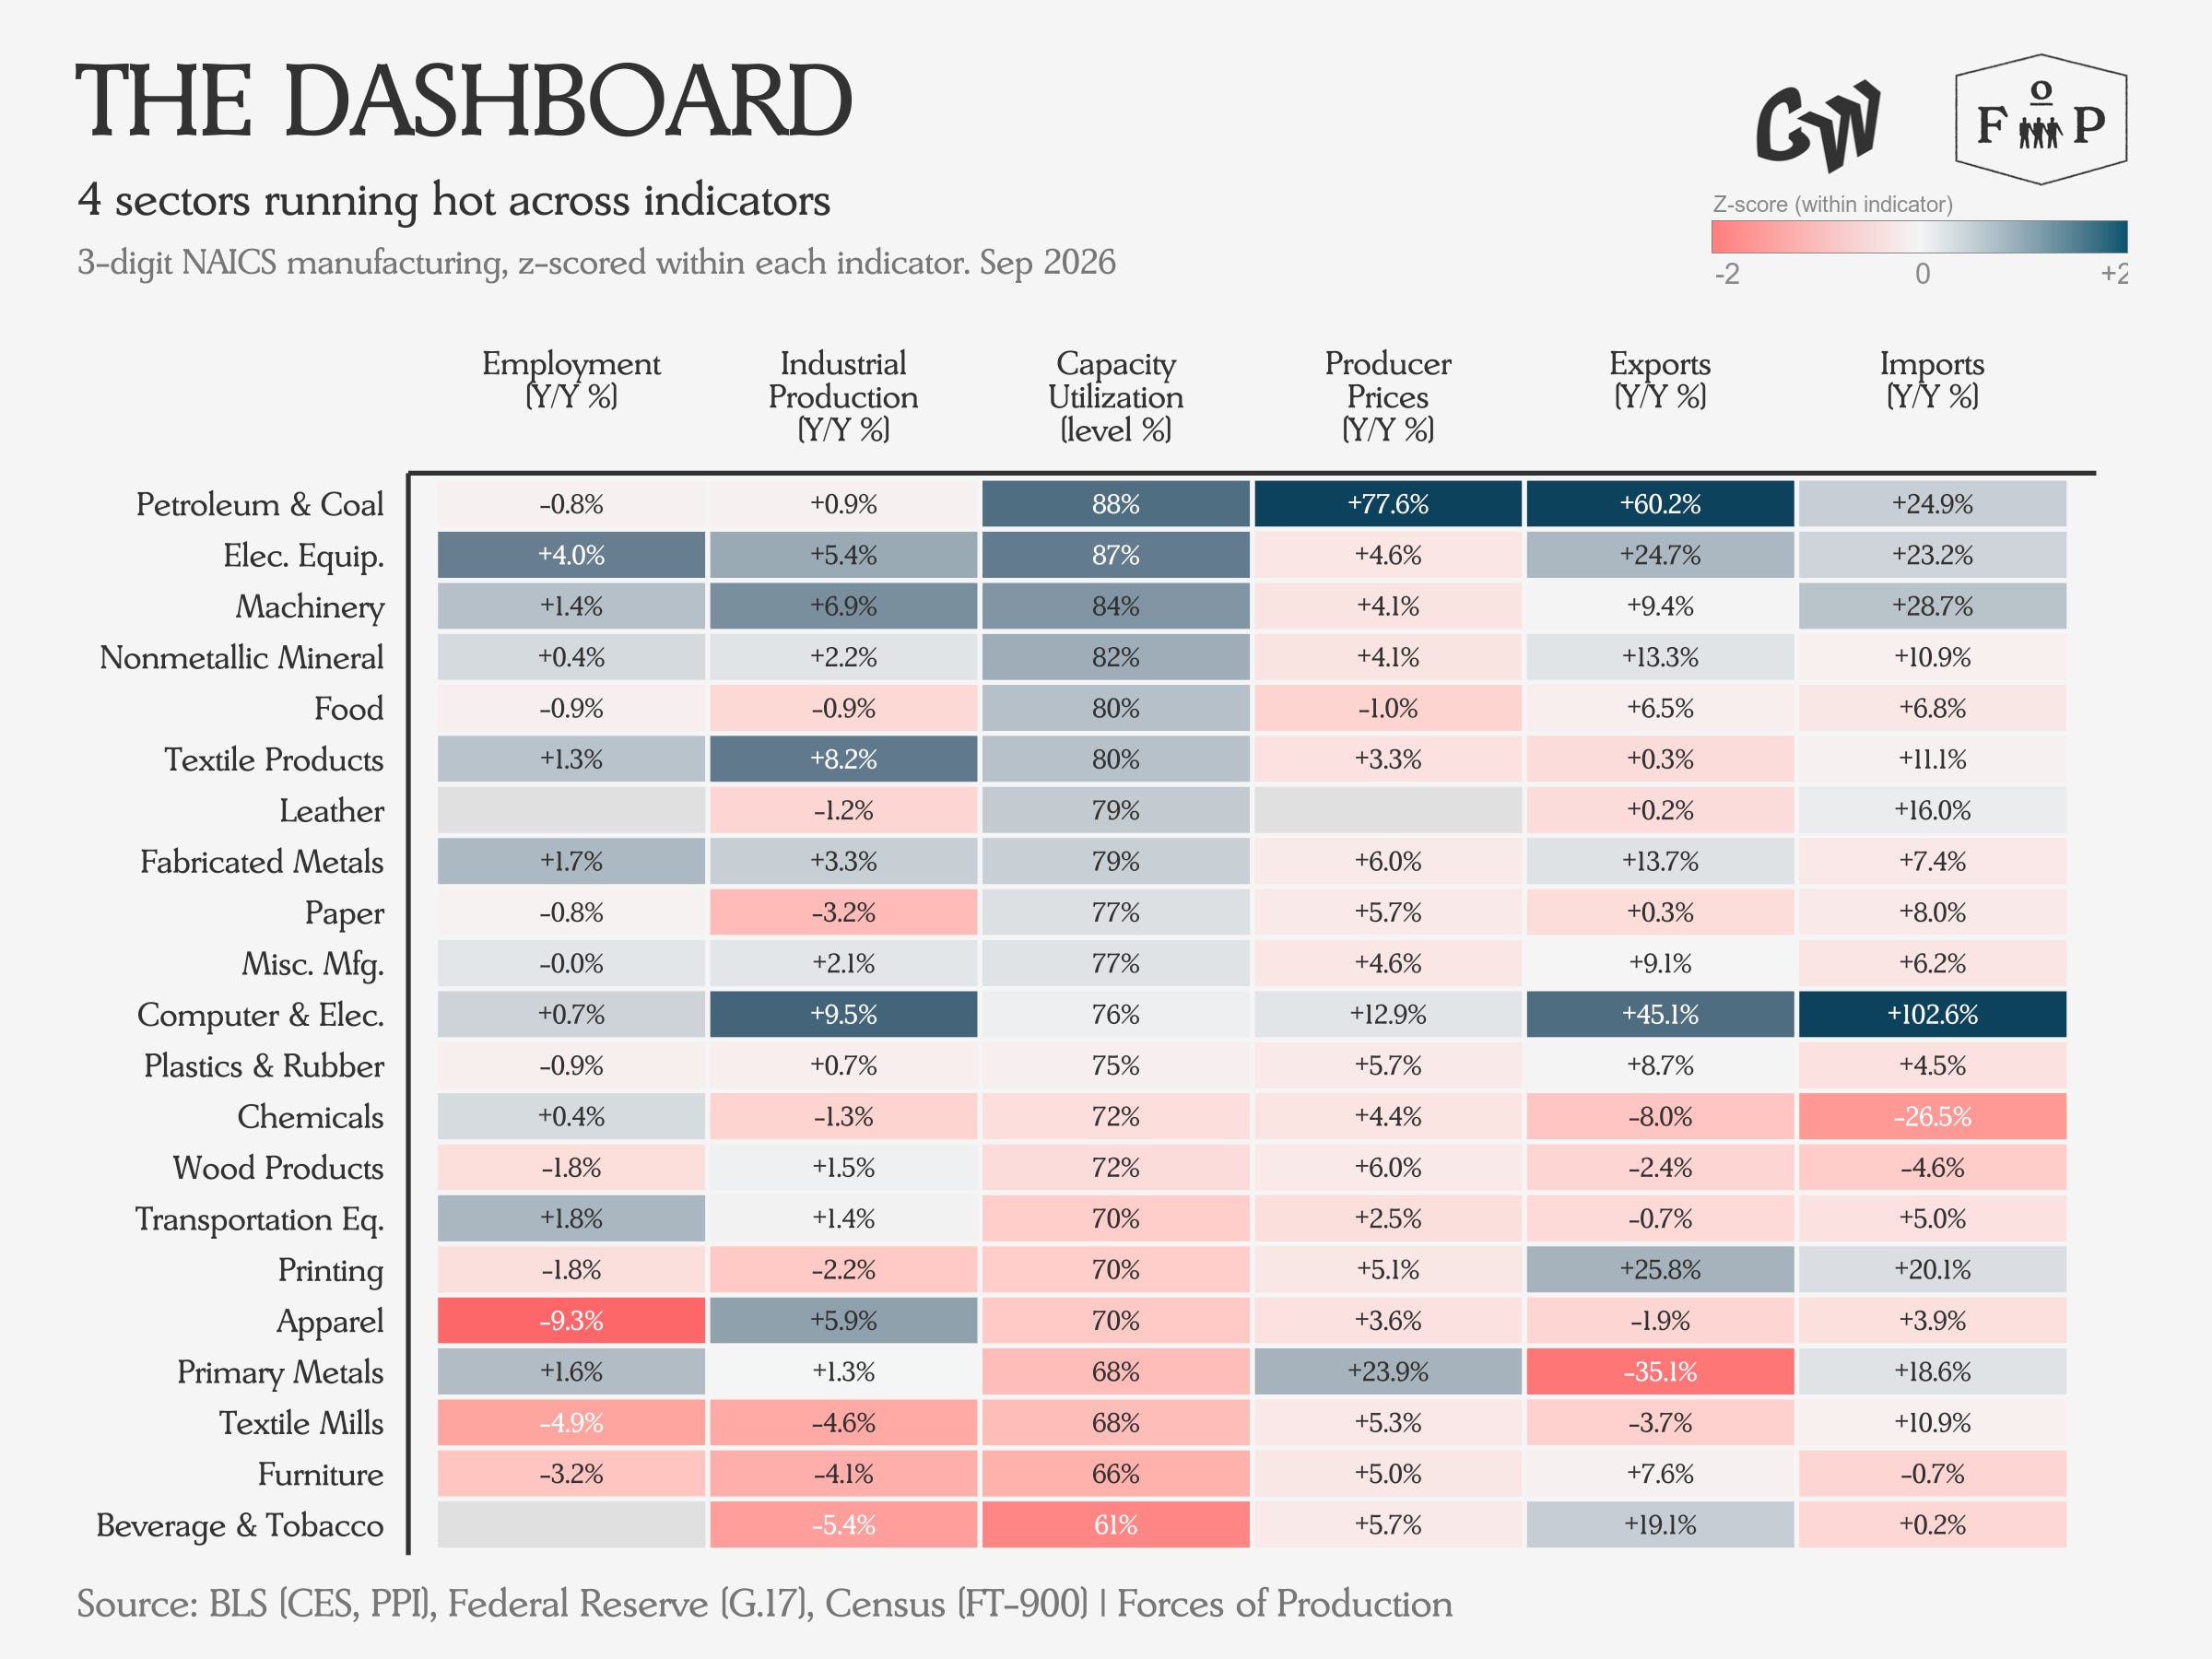
Employment
The unemployment rate rose to 4.2 percent in the September data, as the no-hire no-fire labor market continues to gradually lose momentum.
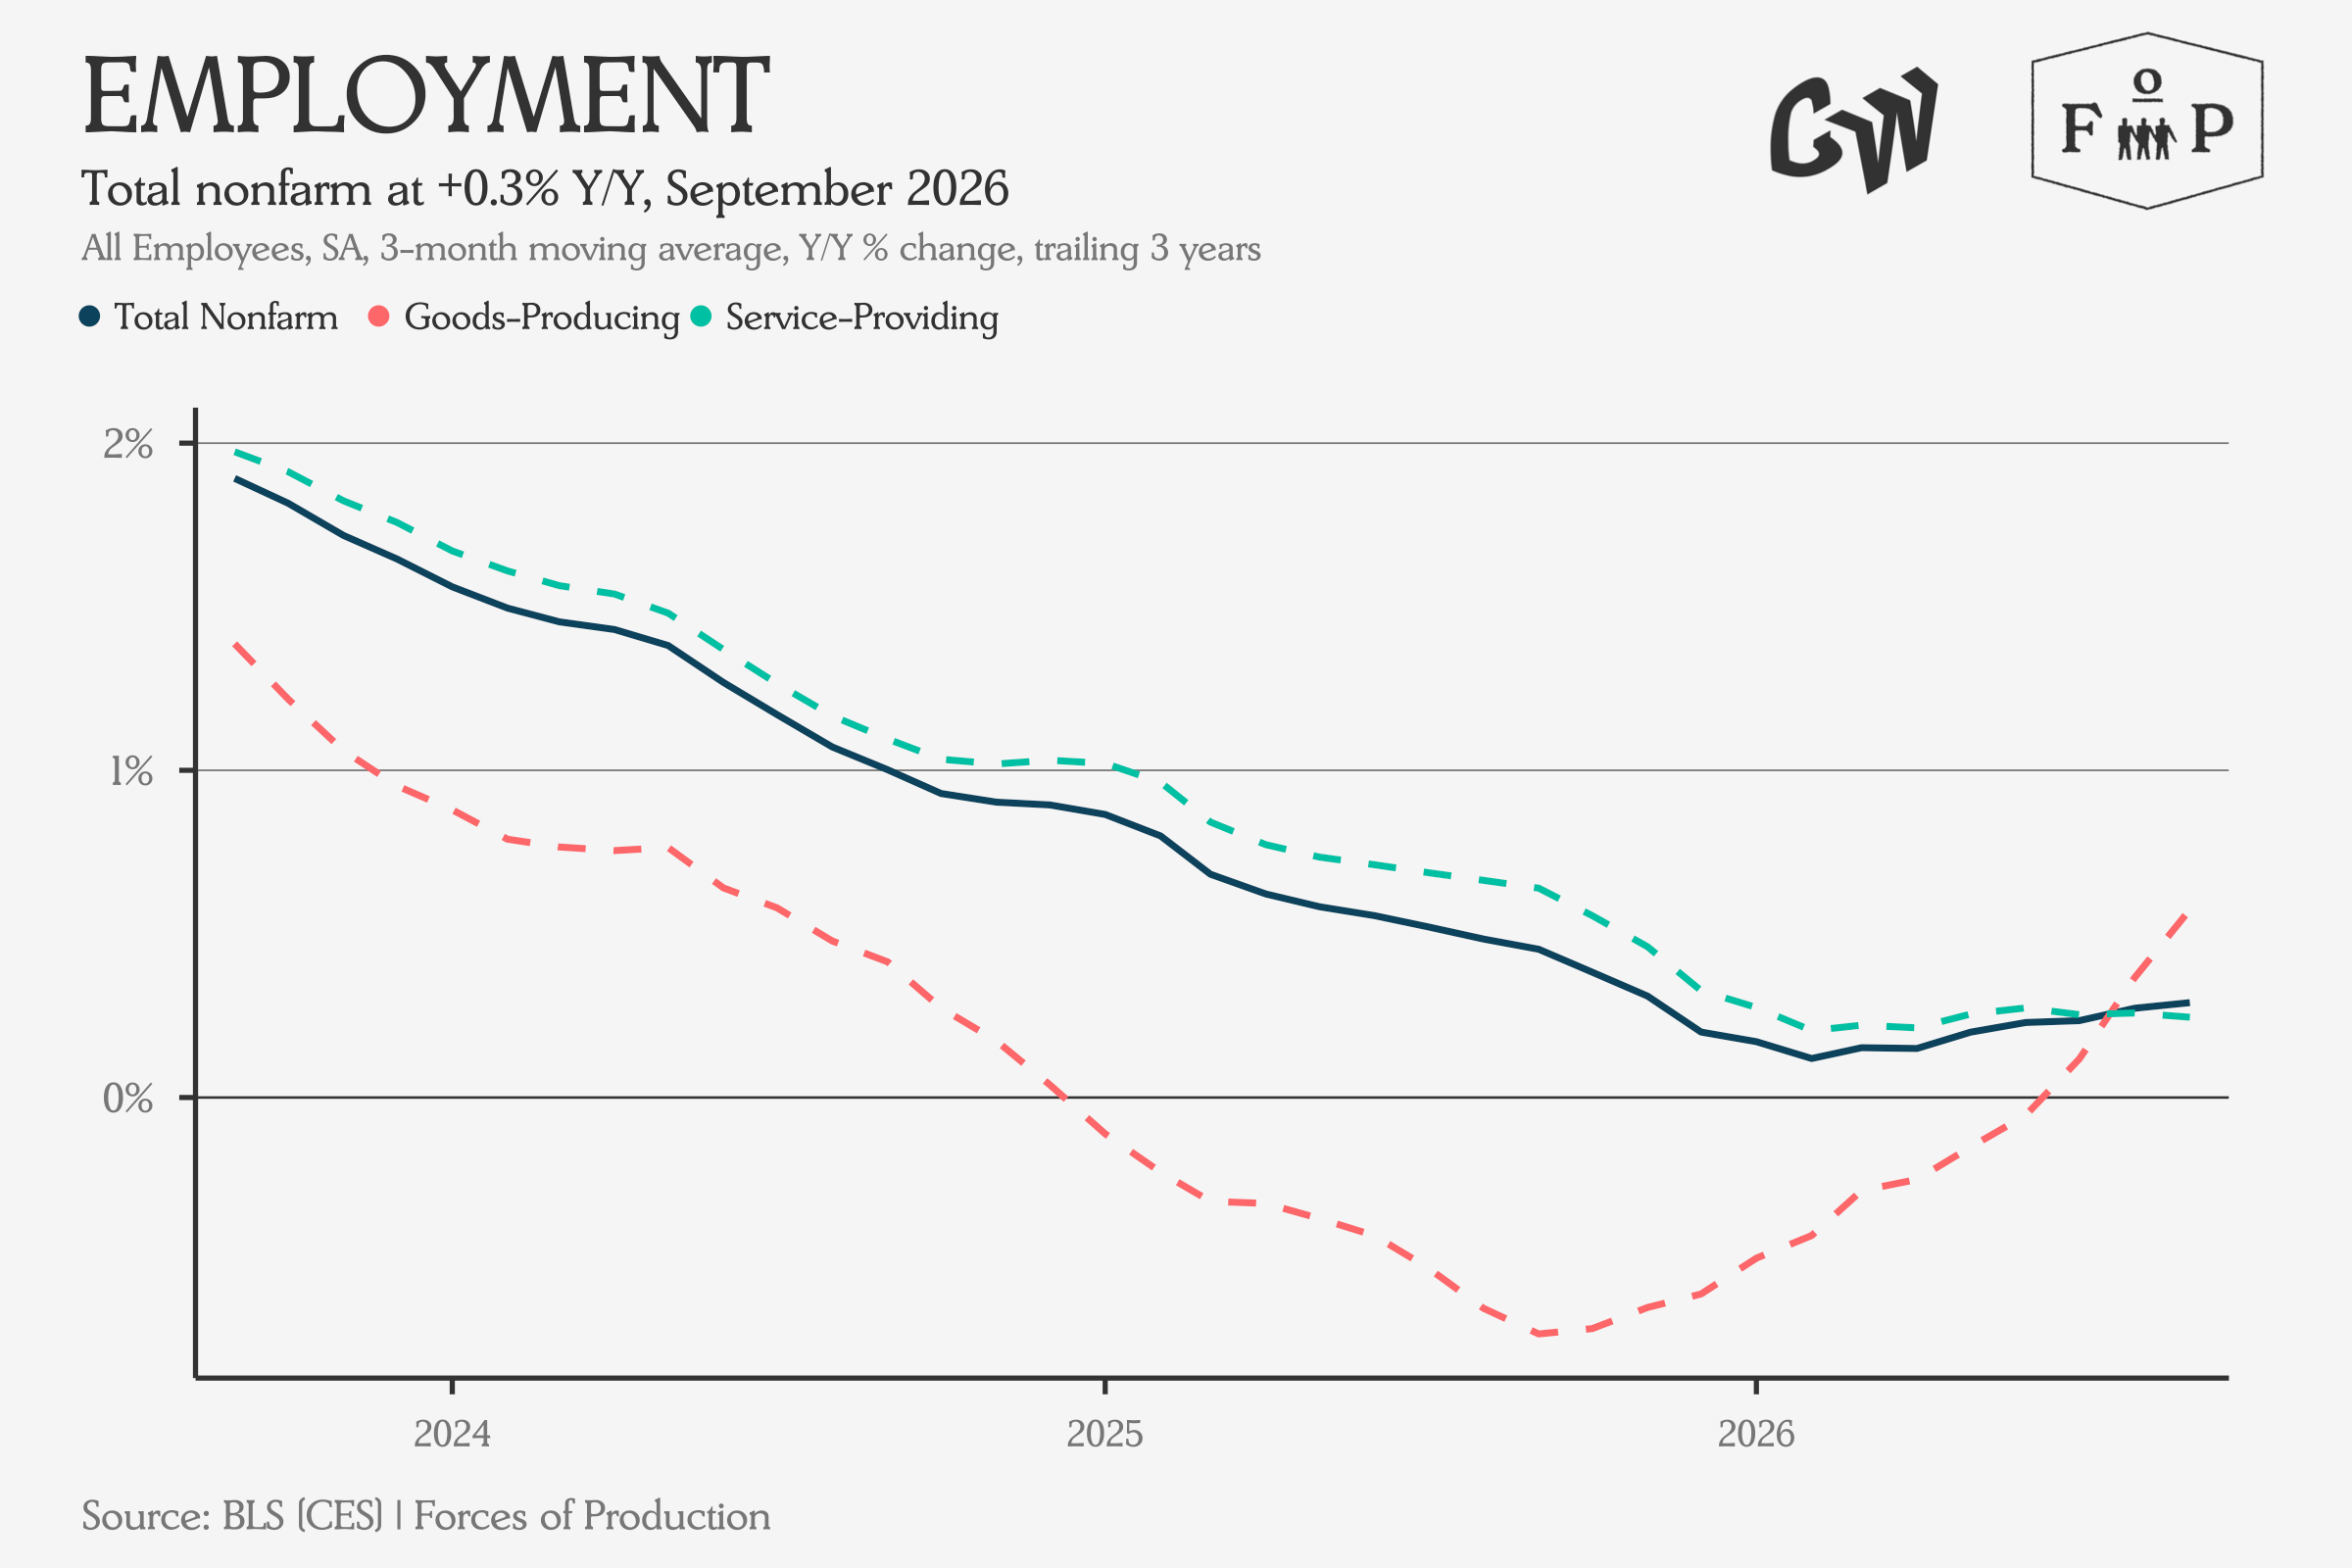
Goods sector employment continues to rebound, posting faster year-over-year growth than services employment in the September data, after total goods employment has slowly turned around after troughing over the last eighteen months.
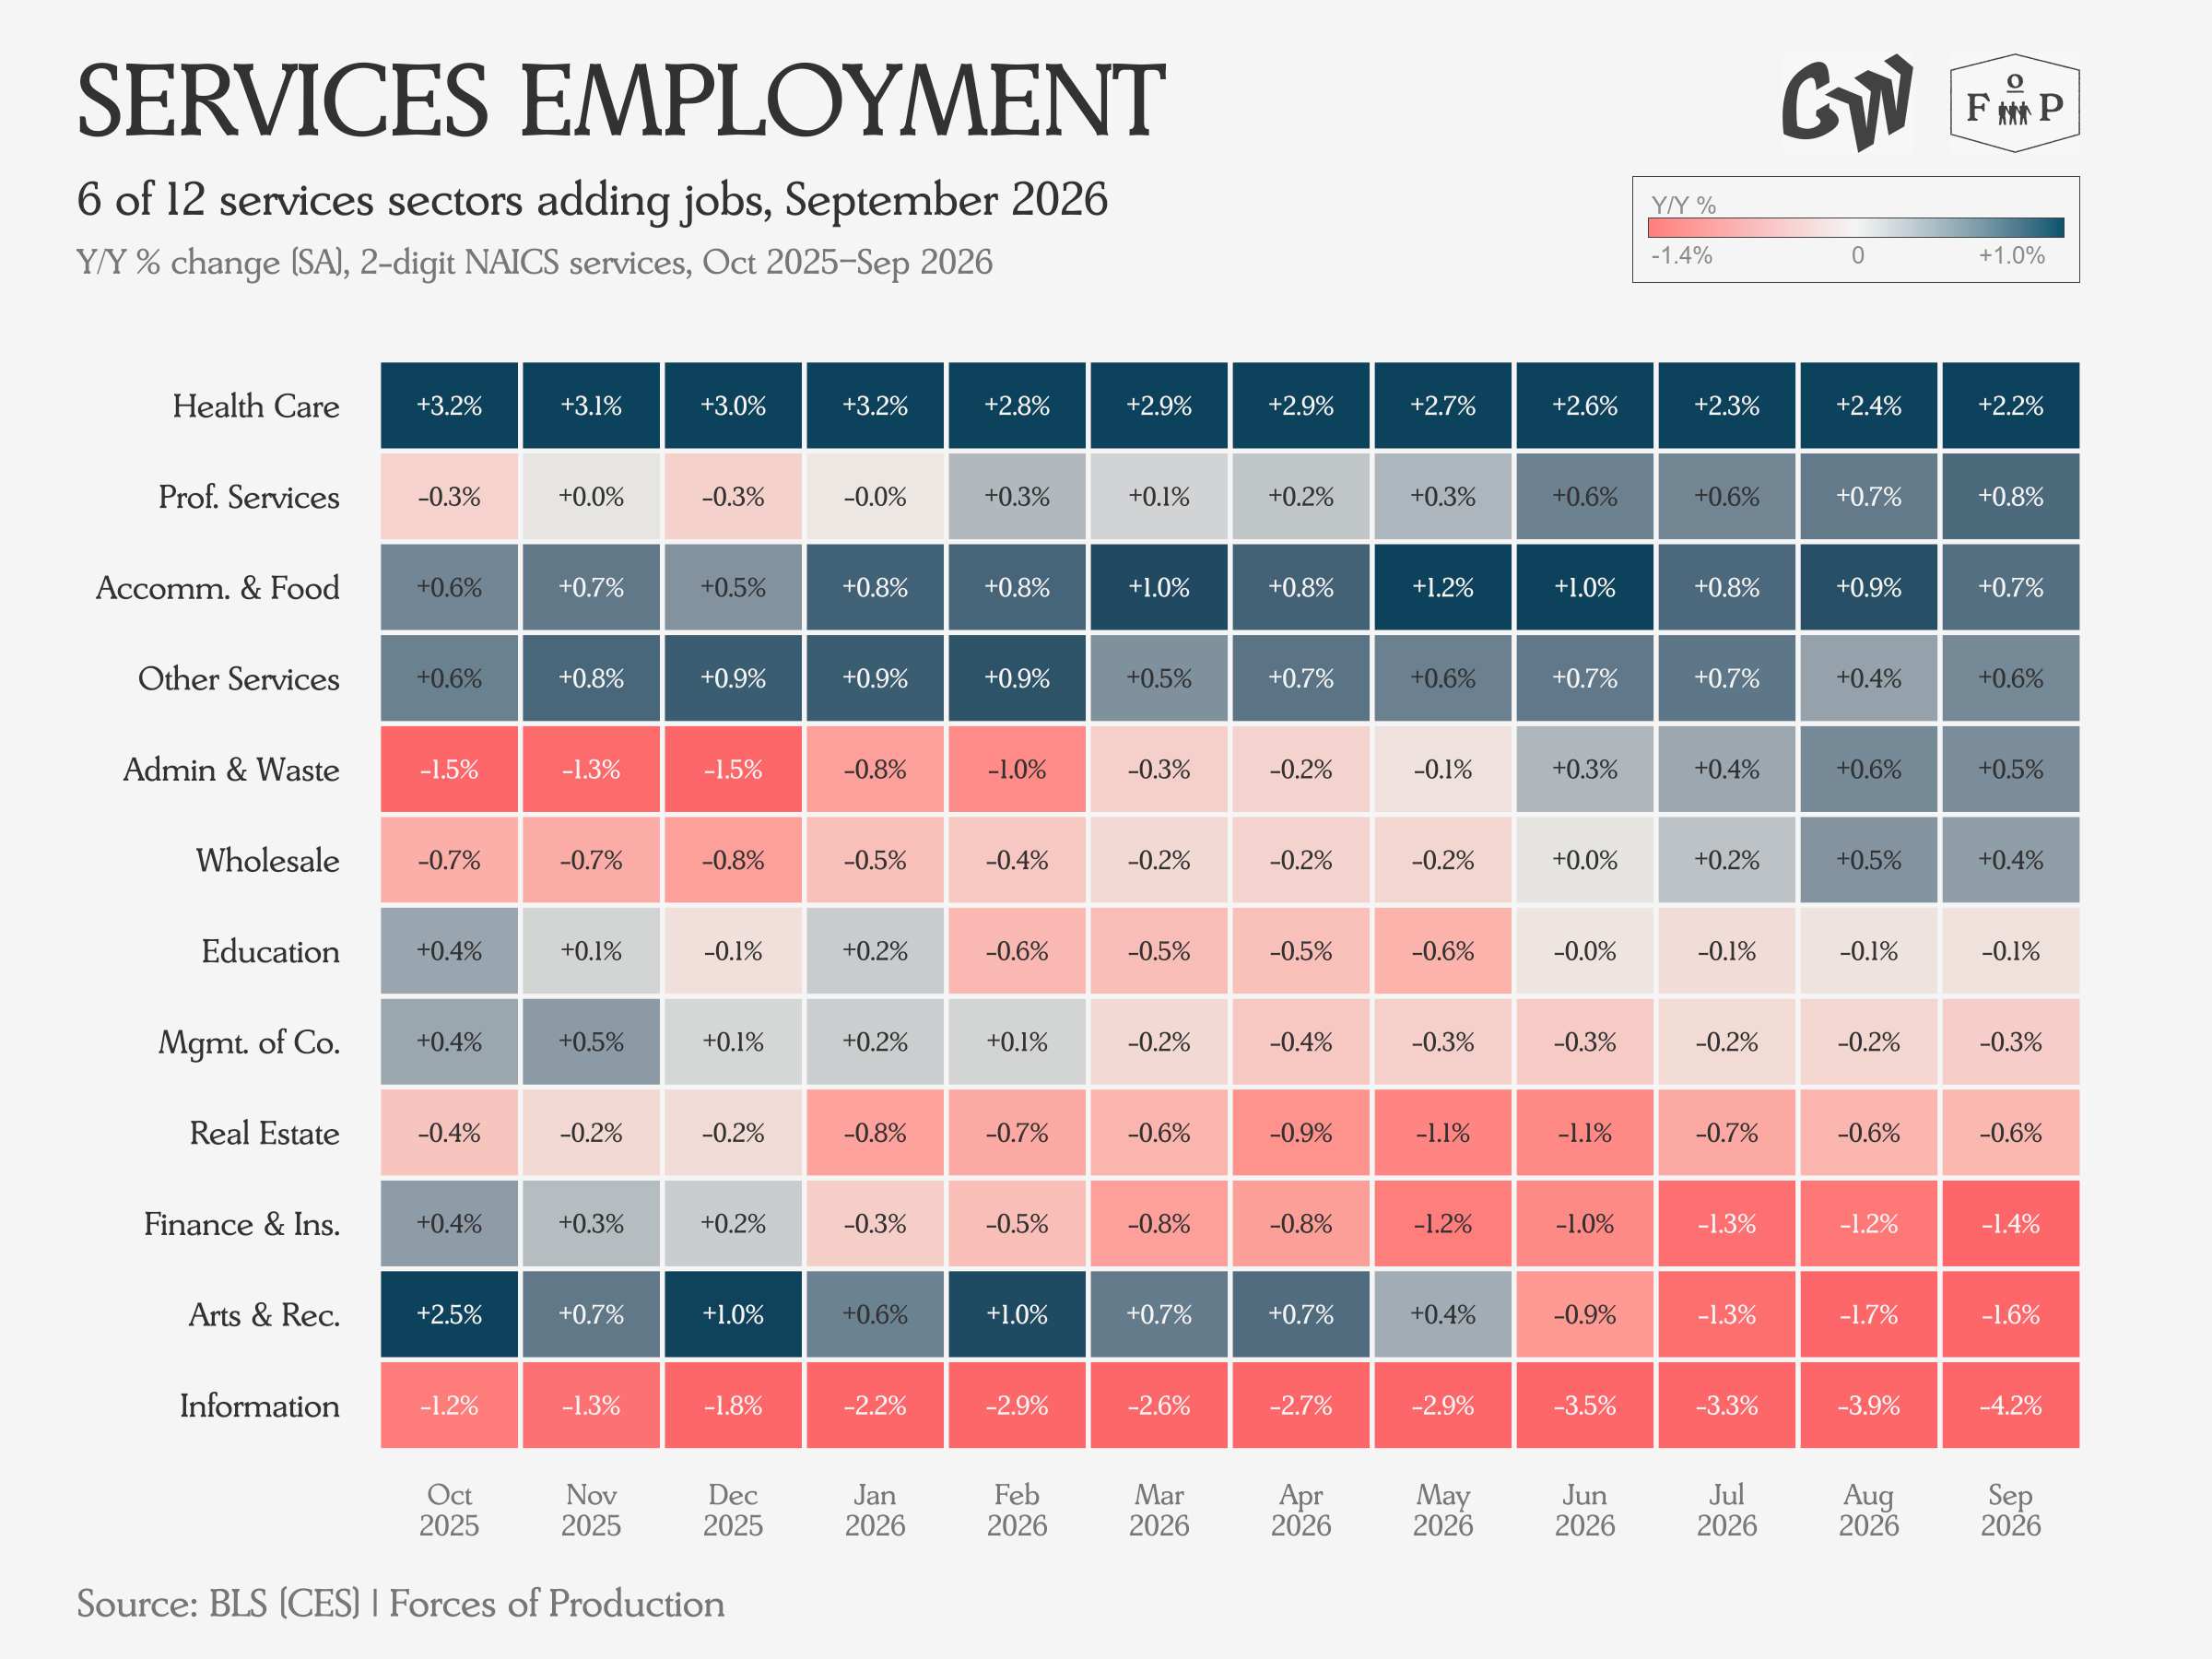
Employment growth continues to broadly decelerate across service sectors, with Information showing a rout of 4.2 percent year-over-year. Even Health Care employment growth is now slowing.
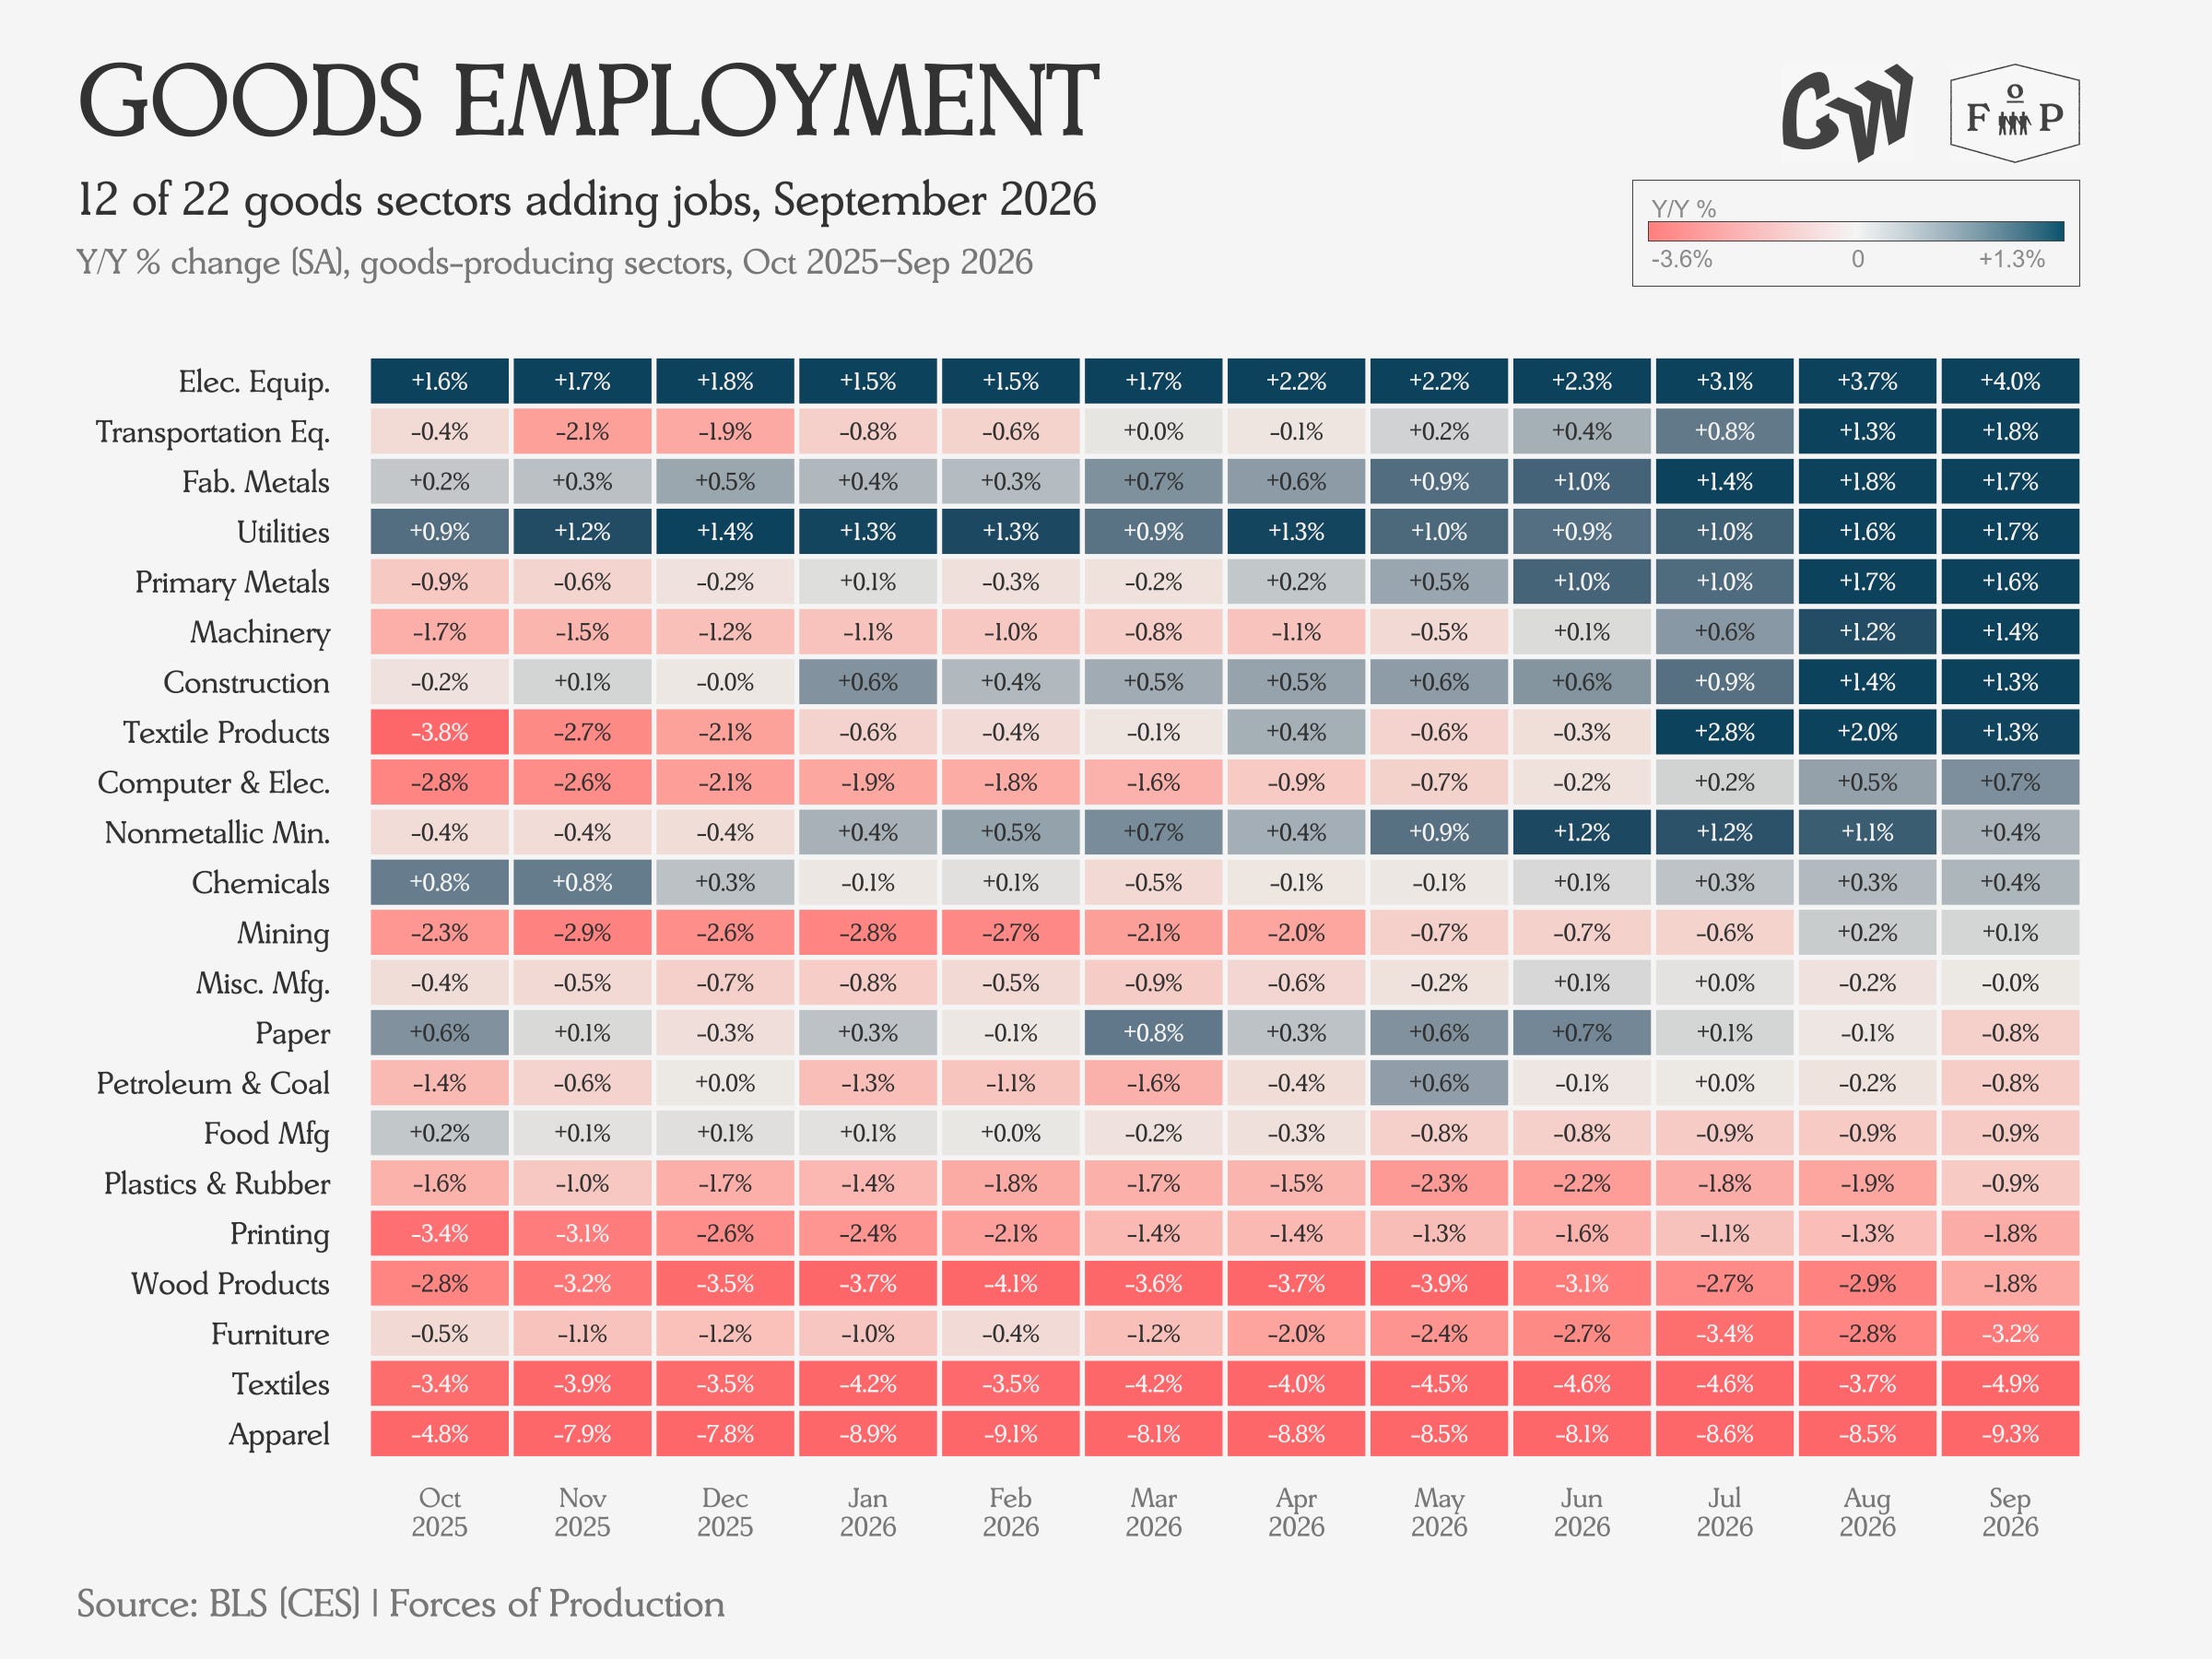
The heavier industry side of the economy is posting accelerating job growth, with metals, machinery and equipment sectors showing gains, and food, textiles, wood and others posting declines.
Prices
Producer prices jumped in the September data, roughly doubling the expectations of a Reuters poll of economists, rising at the fastest pace since 2022.
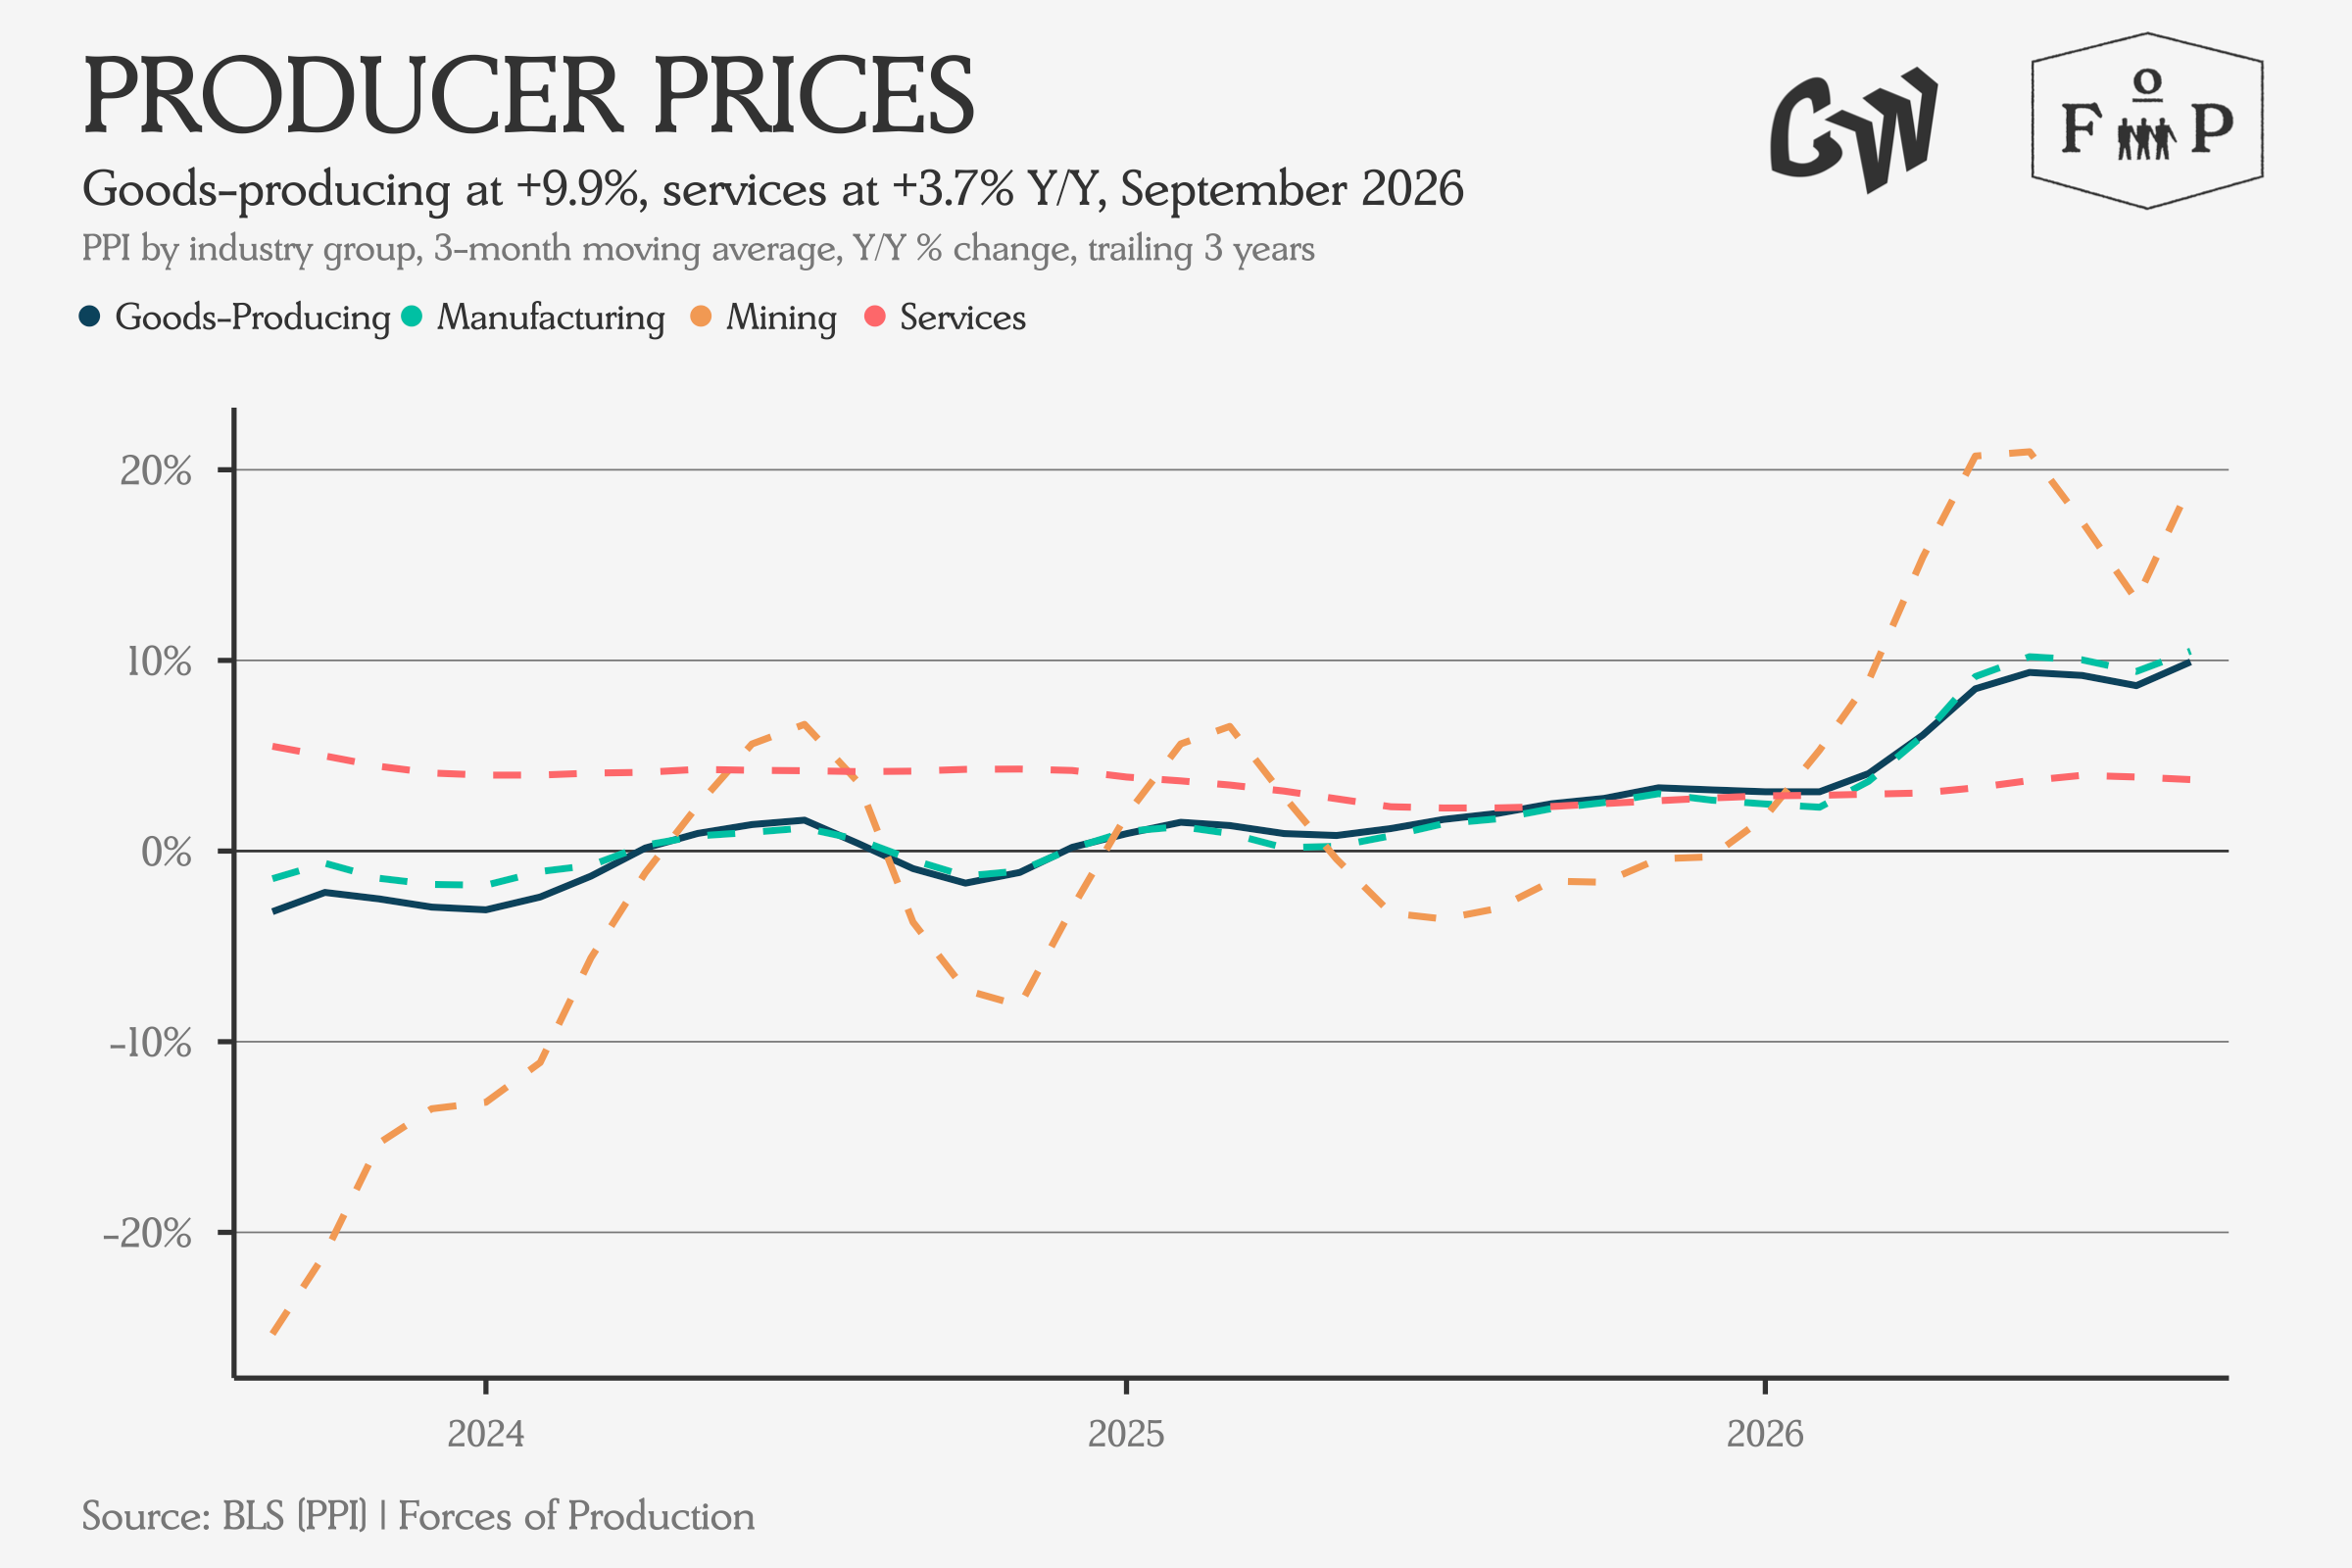
Increases in services prices continue to hold steady while Manufacturing and Goods are providing much of the increased heat in inflation readings.
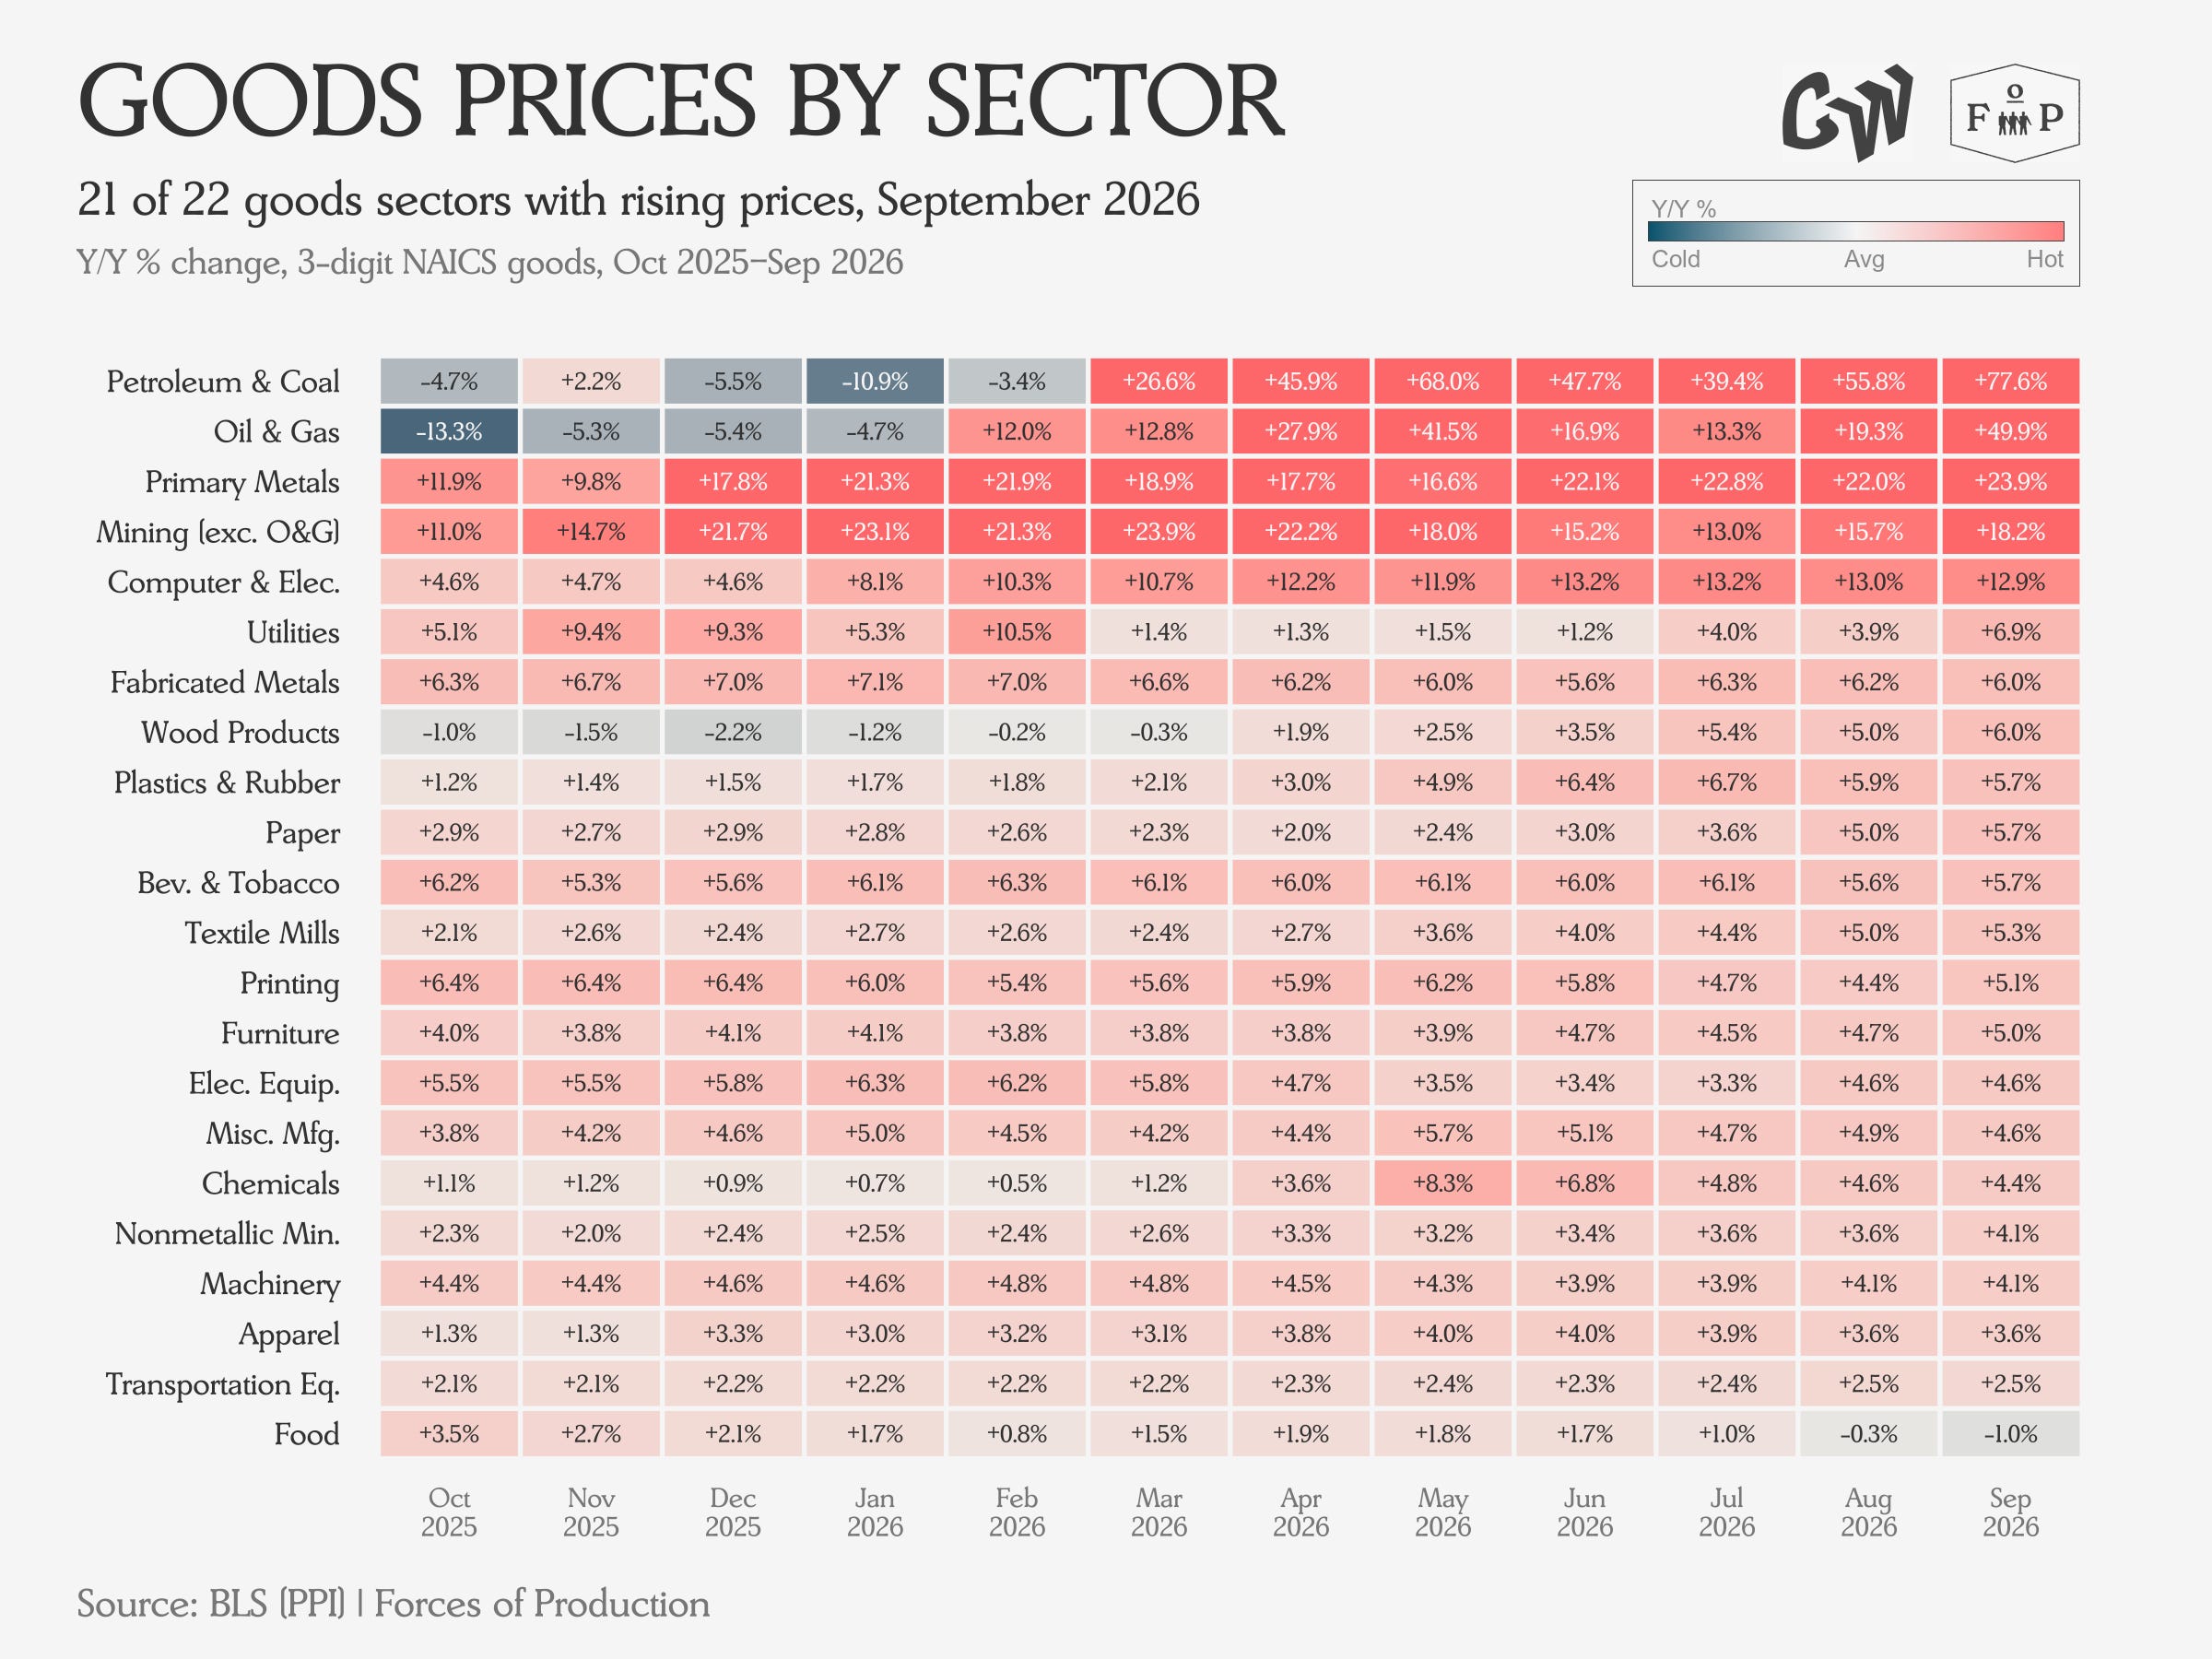
Prices in the fossil fuel complex continued to rocket upwards in the September data, with Food Manufacturing providing the only point of disinflation.
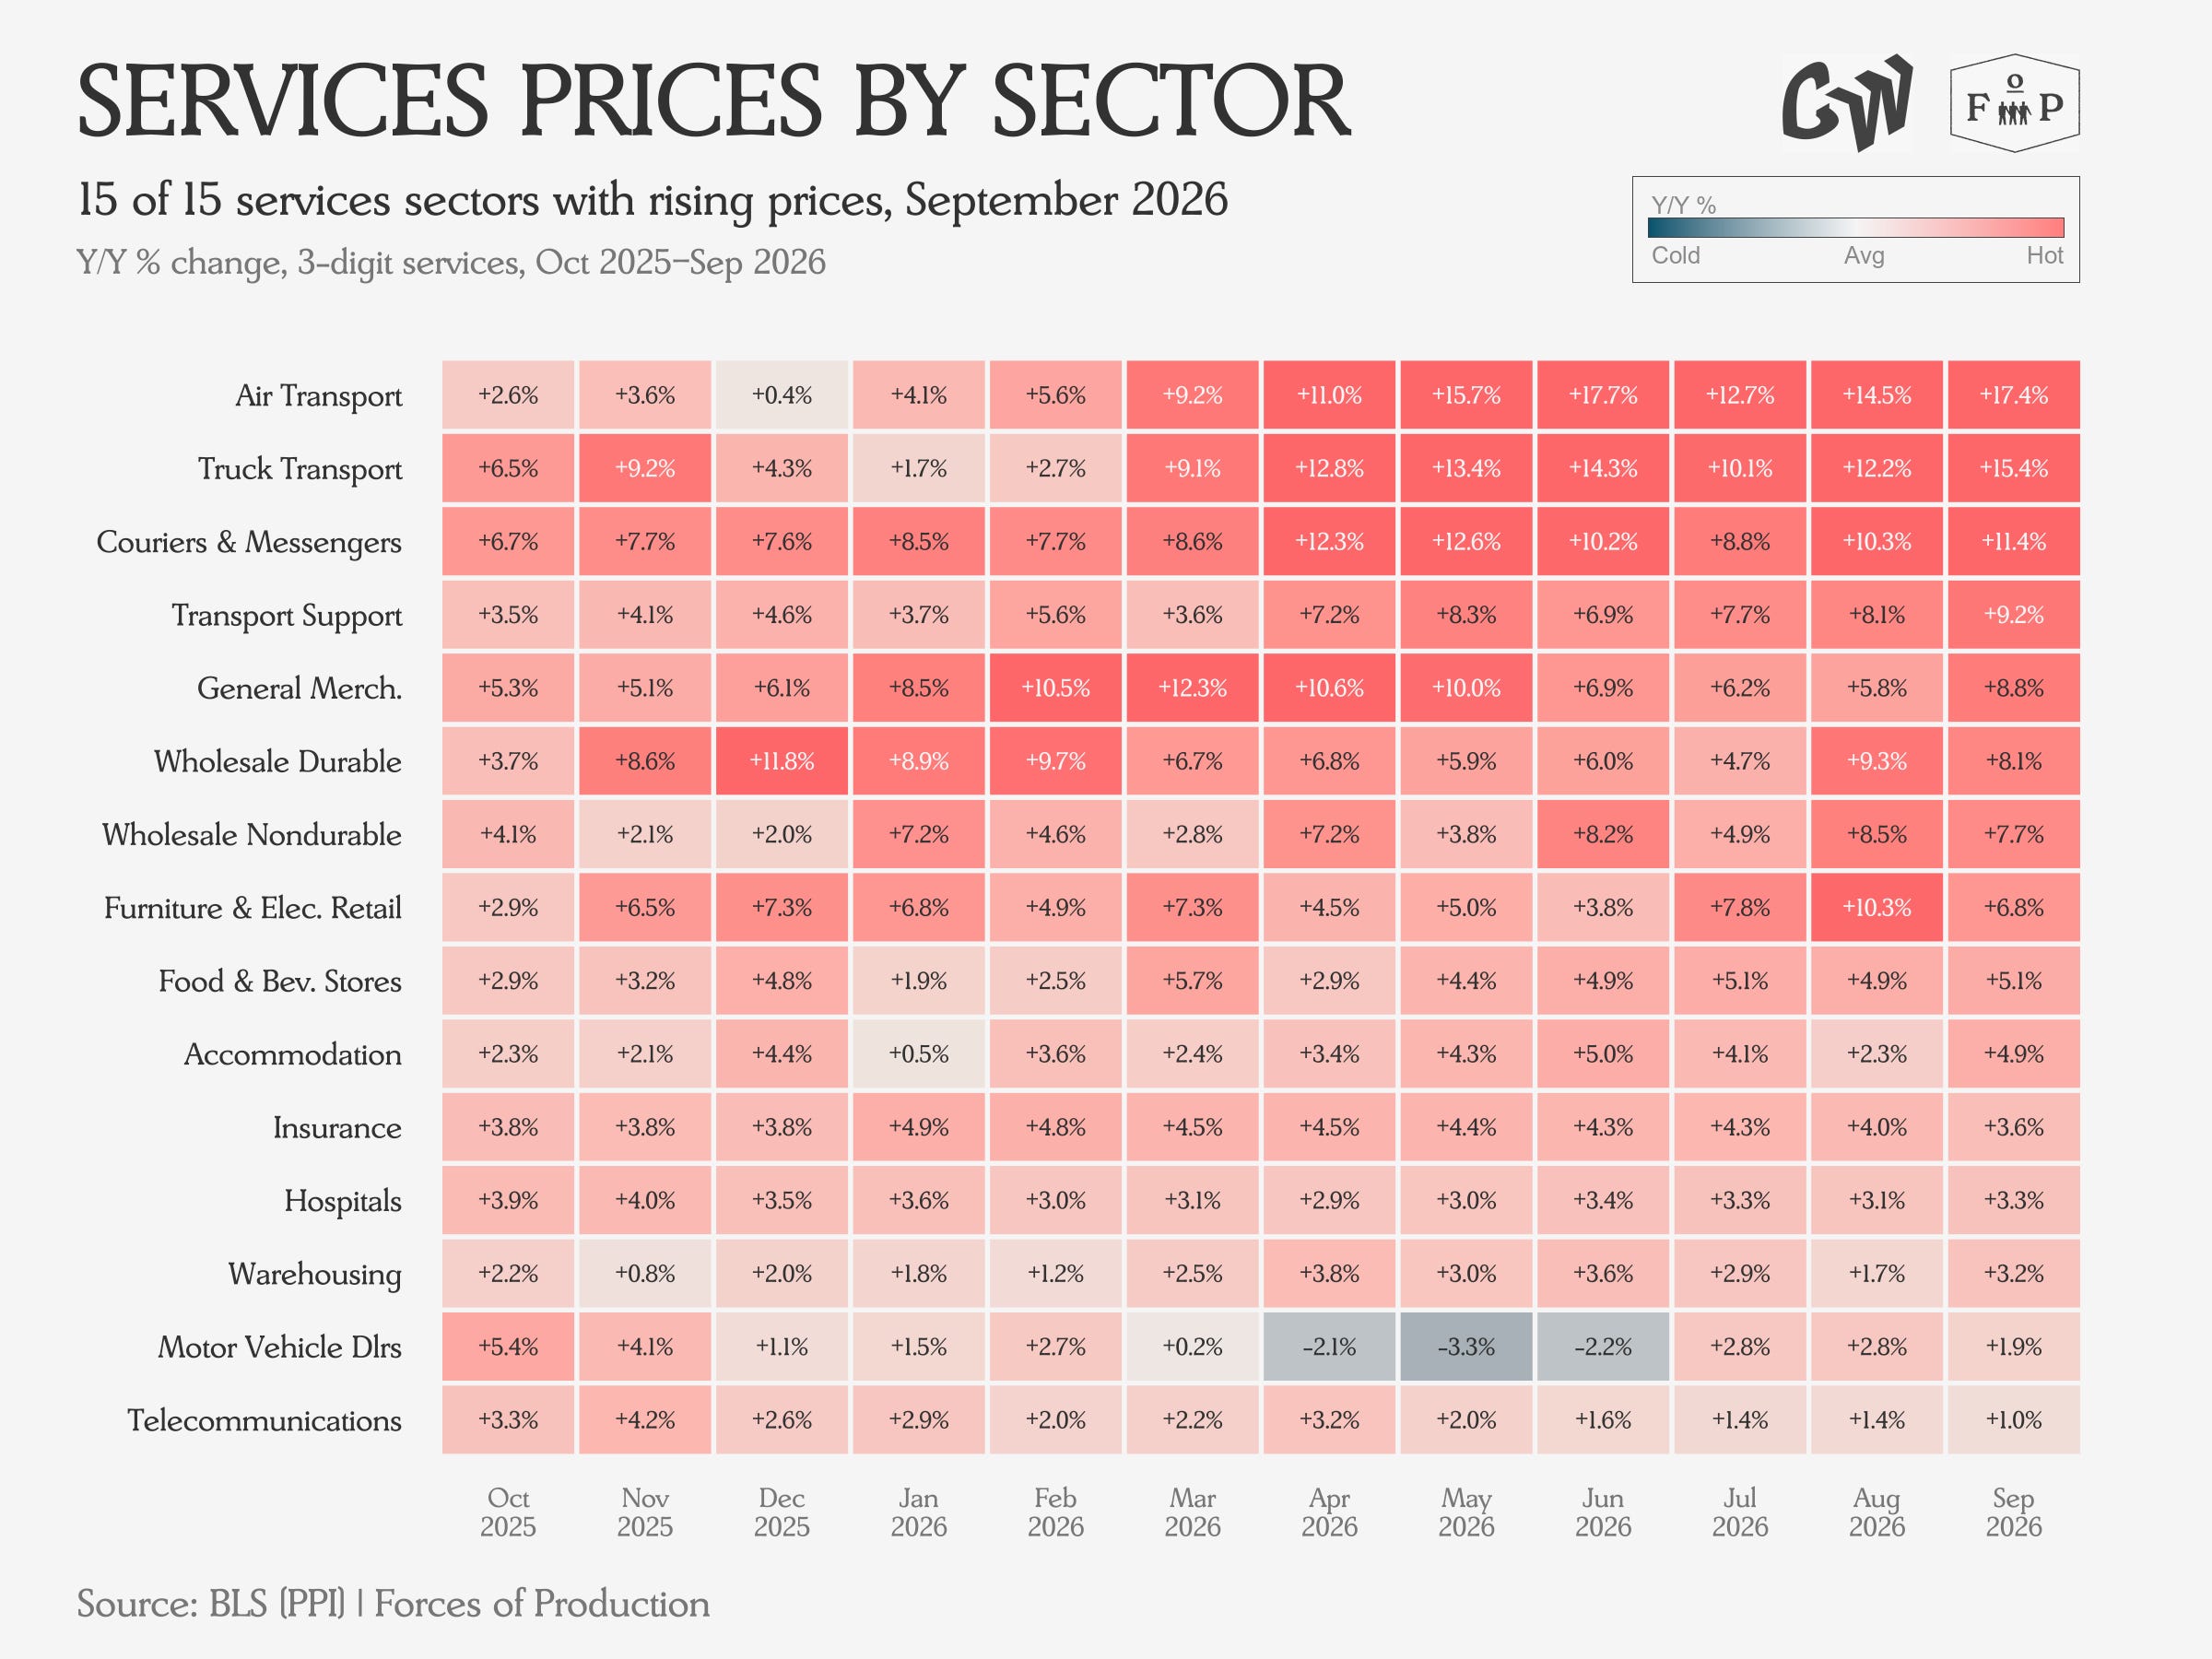
Services provide no point of disinflation, with the fastest price increases in the sectors most exposed to the oil price shock.
Production & Capacity
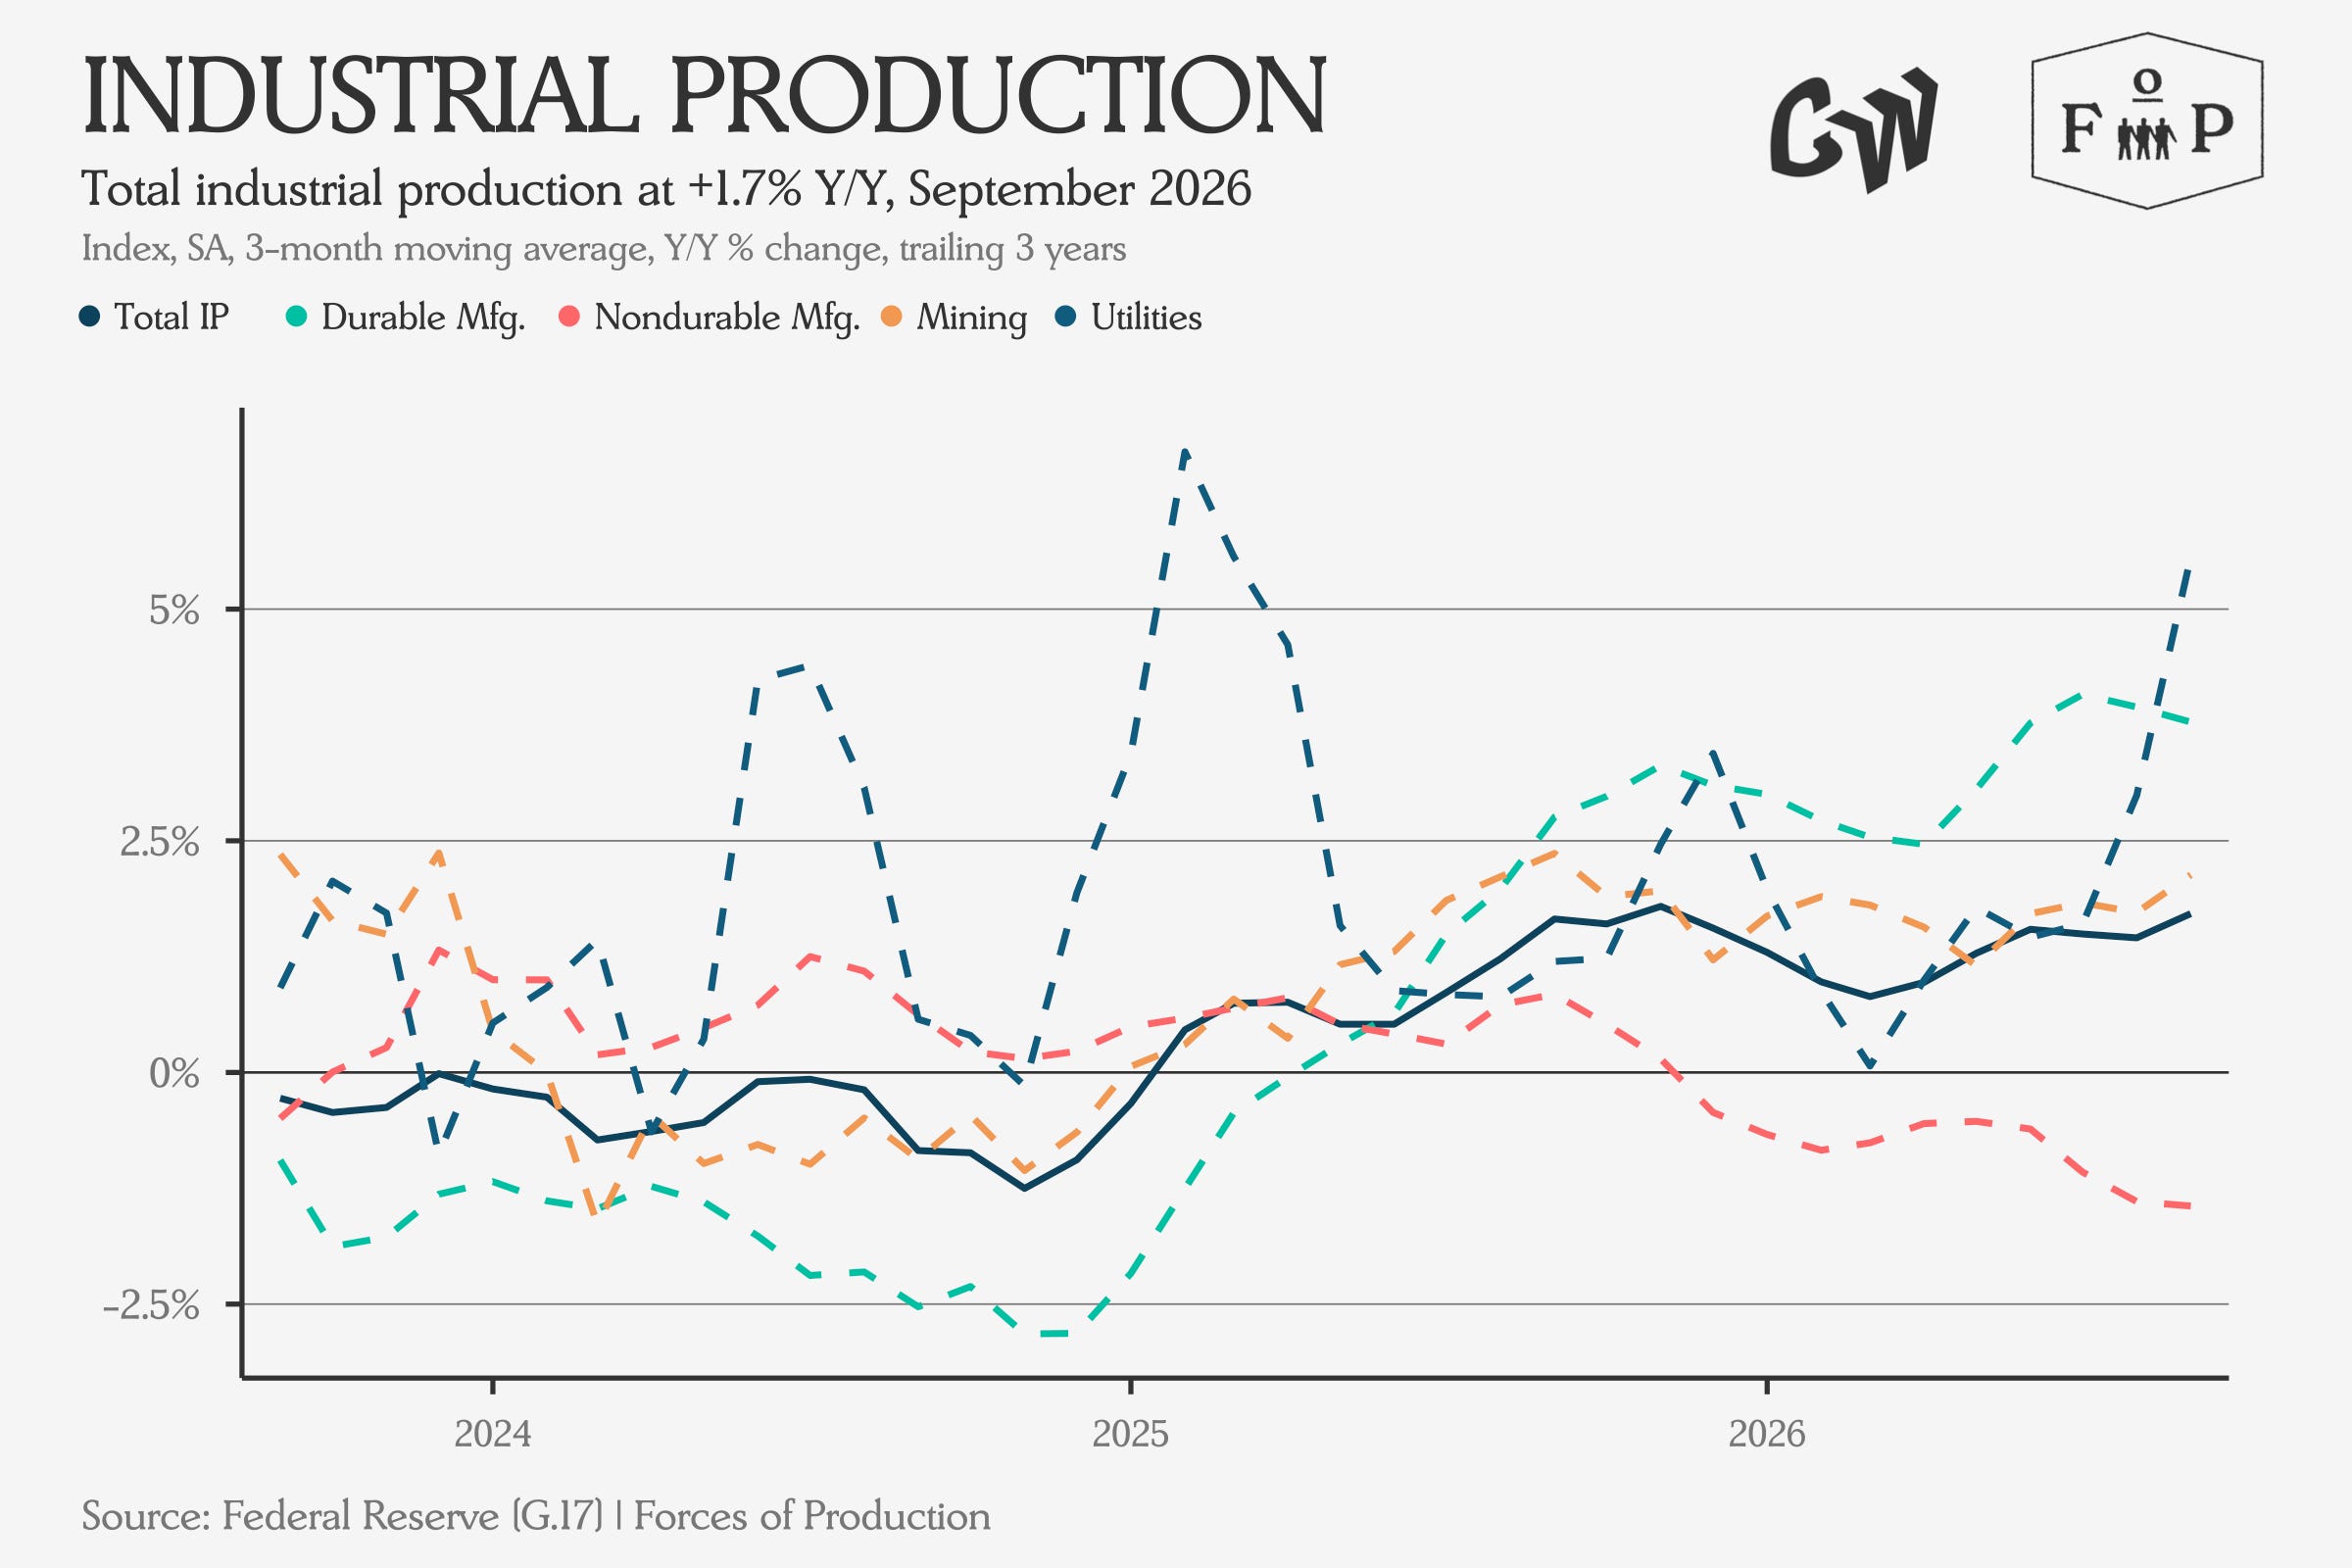
Industrial Production expanded by more than expected in the September data, led by a strong showing from Utilities and Durable Goods Manufacturing.
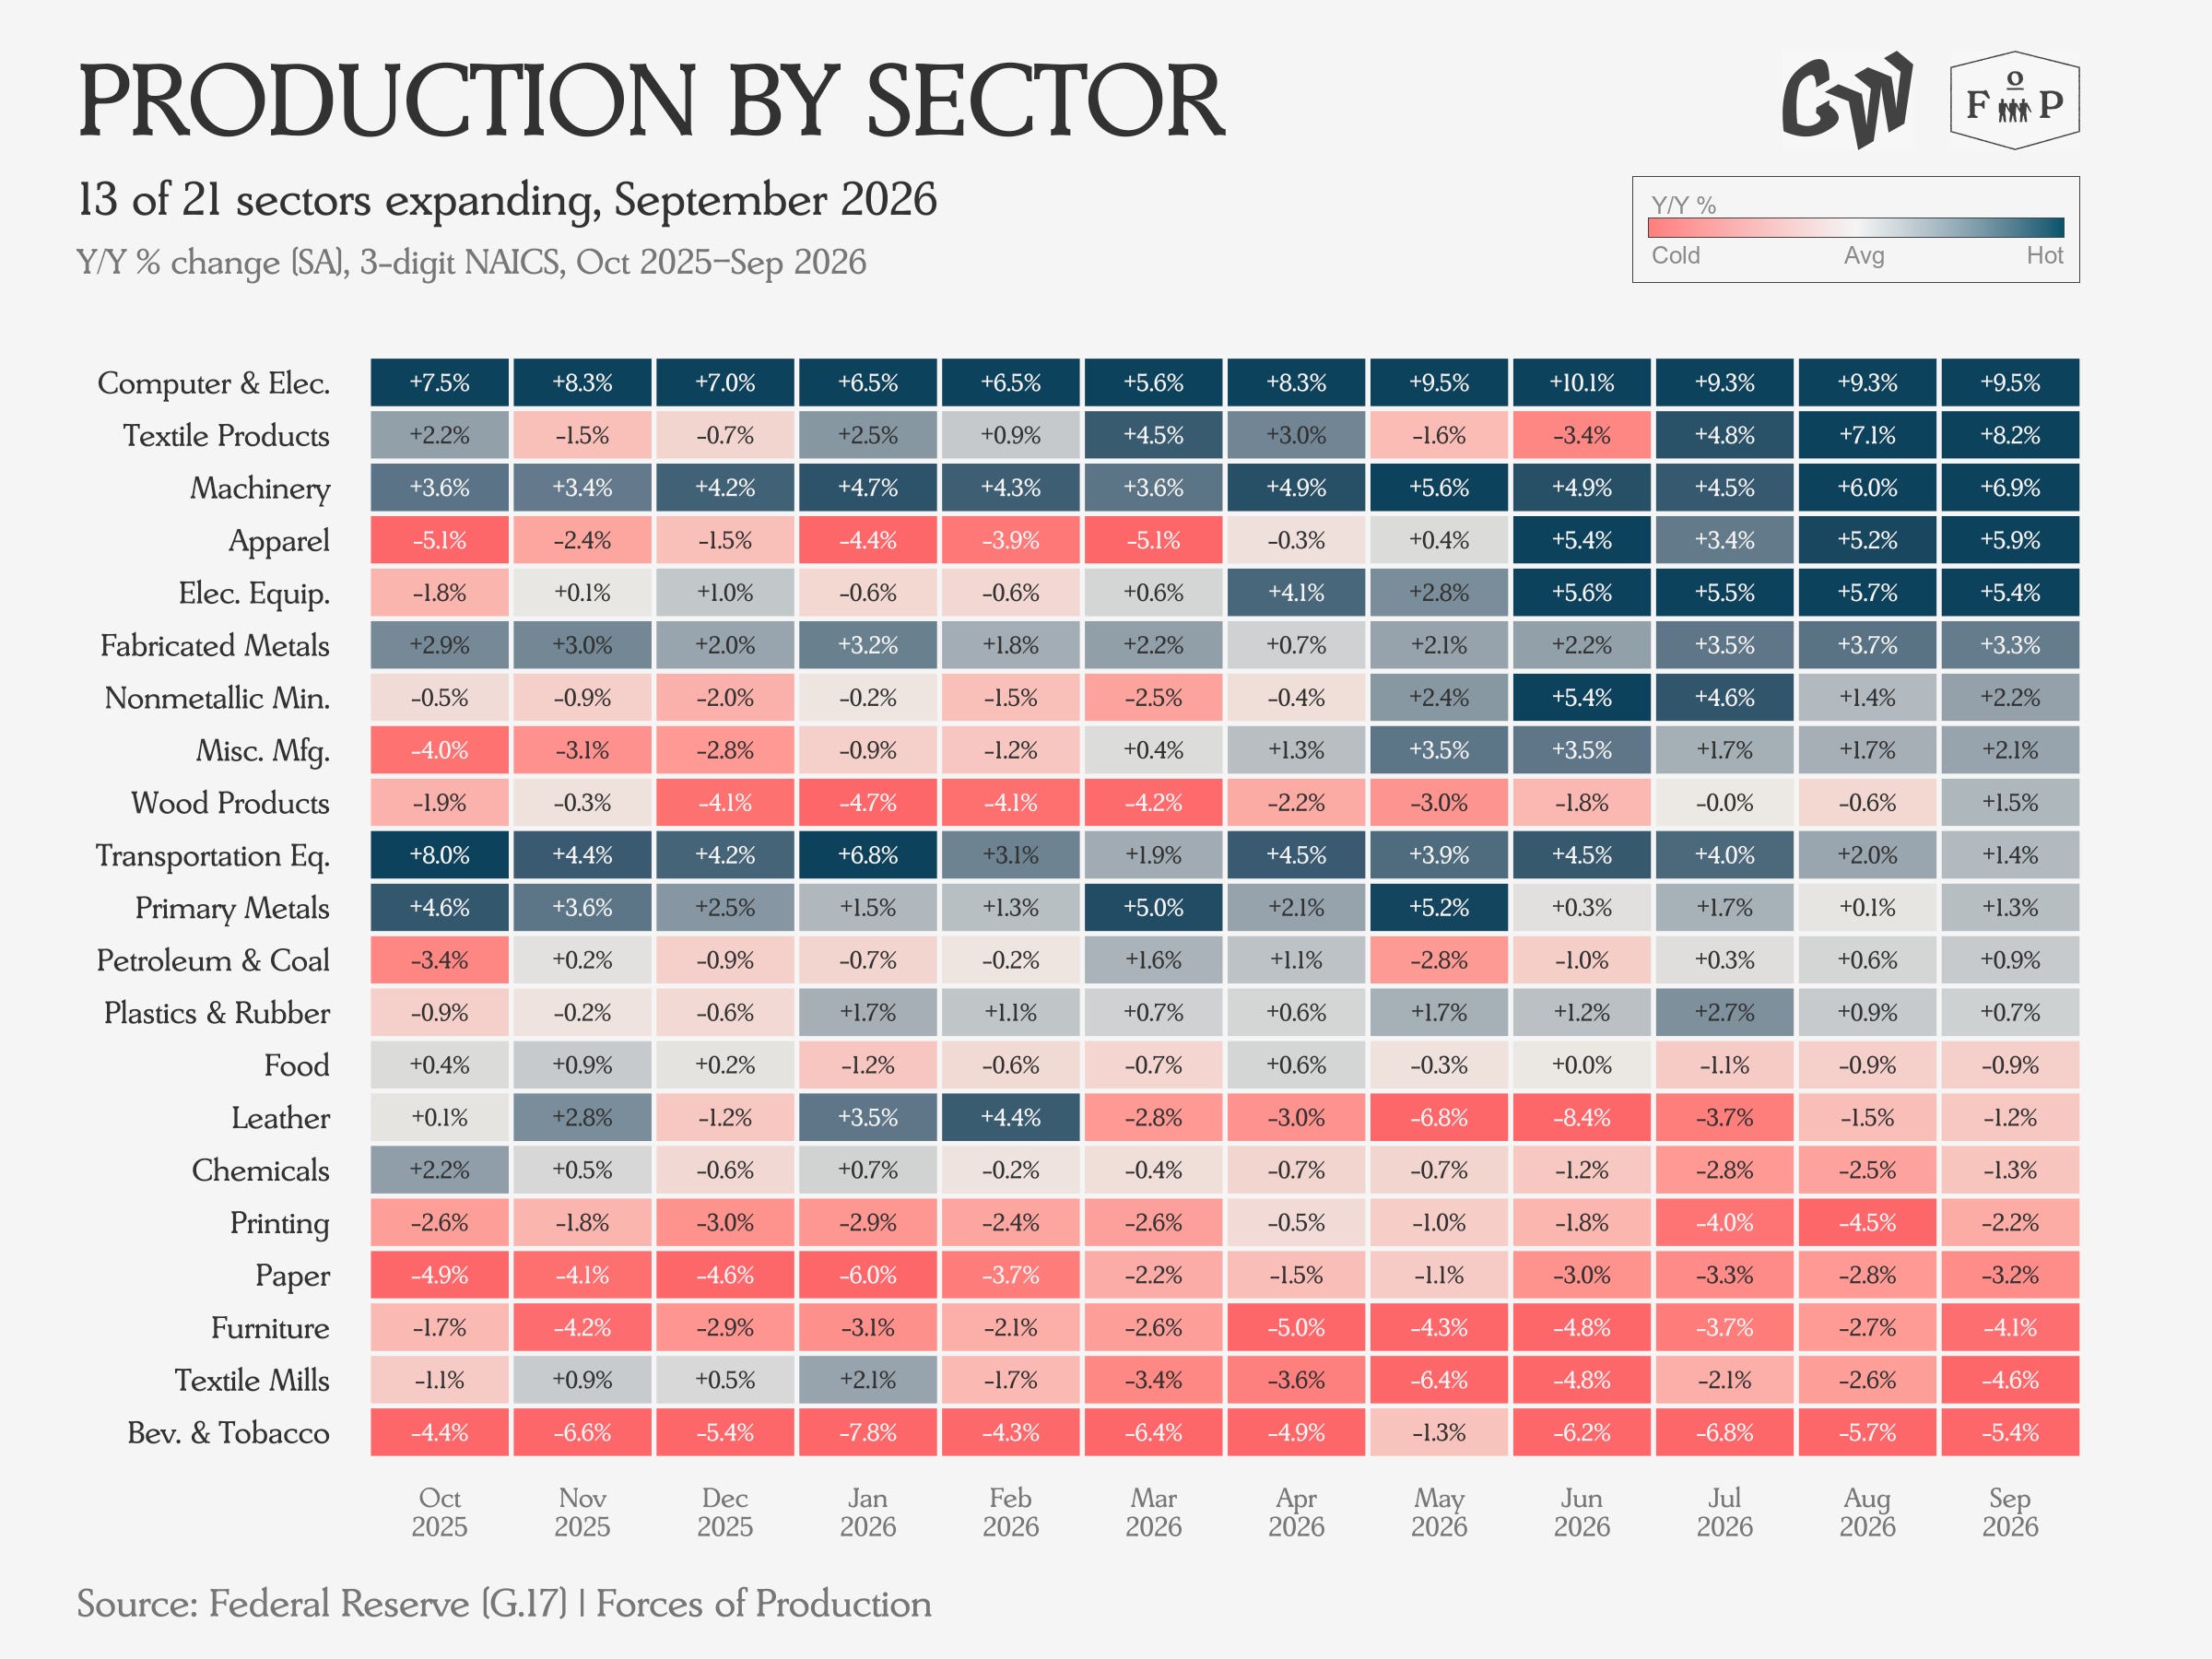
Computer & Electronic Products continues to boom, posting nearly ten percent year-over-year growth for each of the past six months. The biggest falls come from the wood and paper complex, alongside Textiles and Beverage and Tobacco.
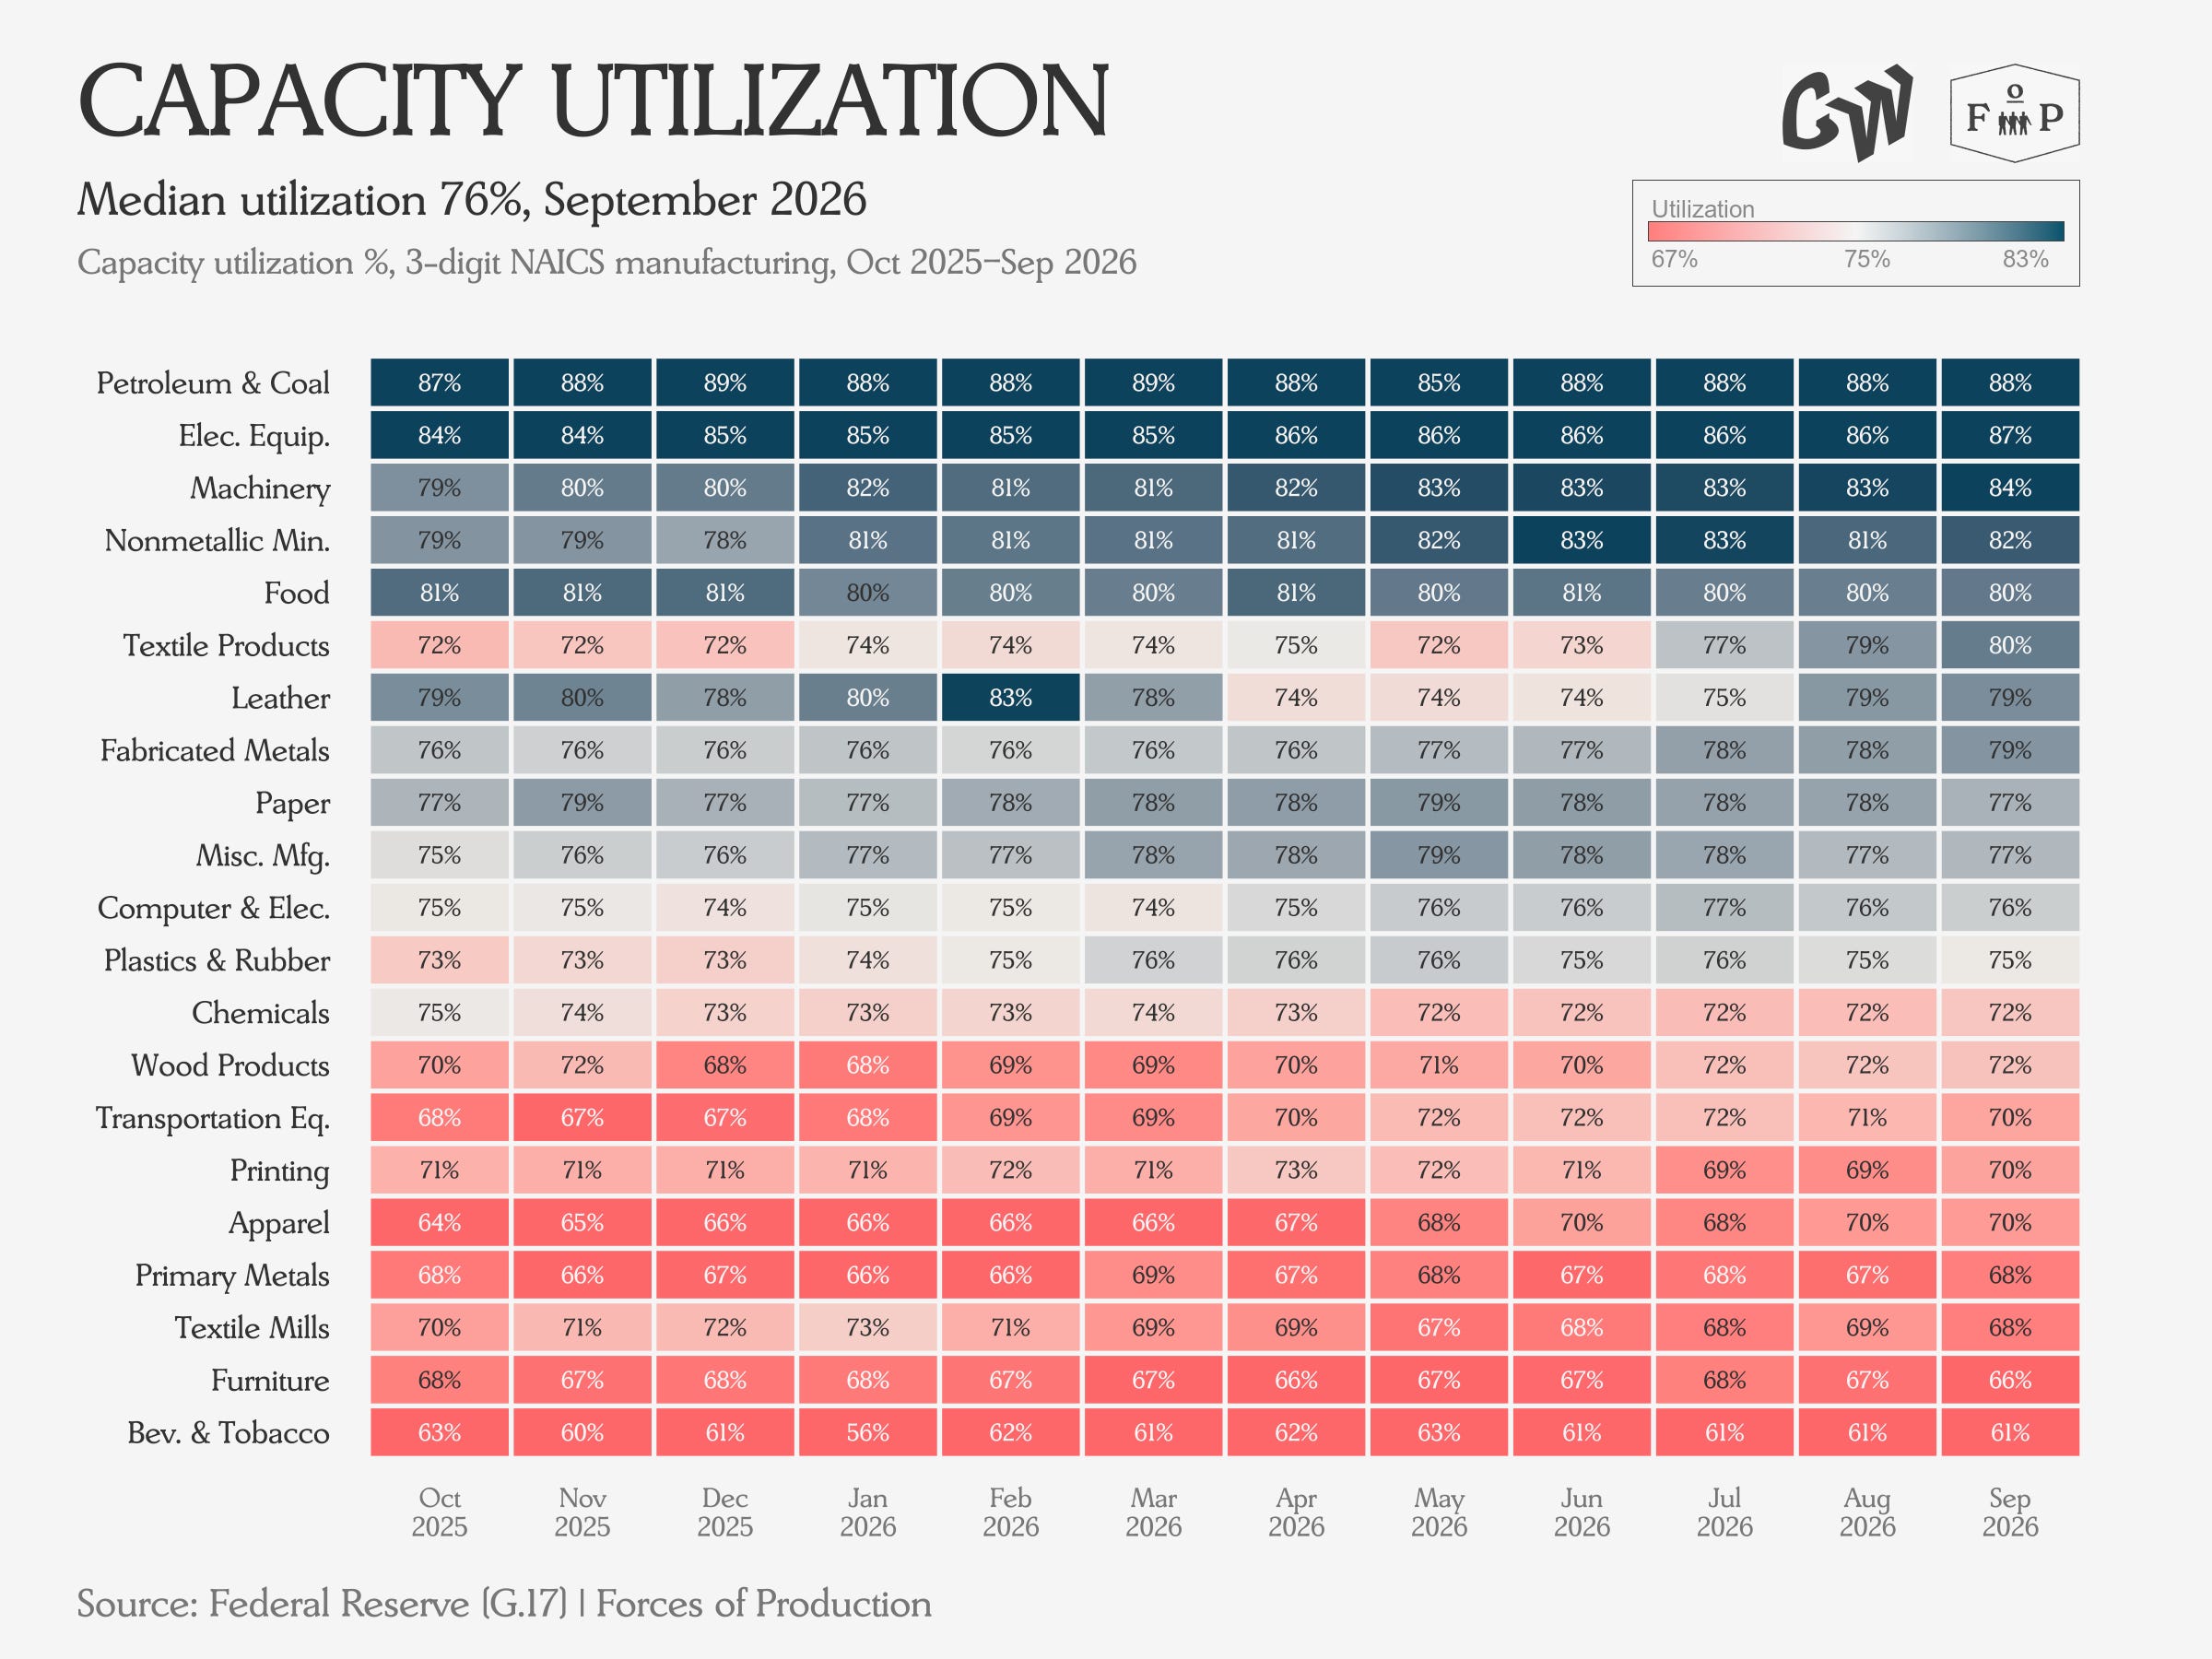
Capacity Utilization remains largely unchanged by sector in the September data, aside from slight upticks from Machinery and Electrical Equipment.
Trade
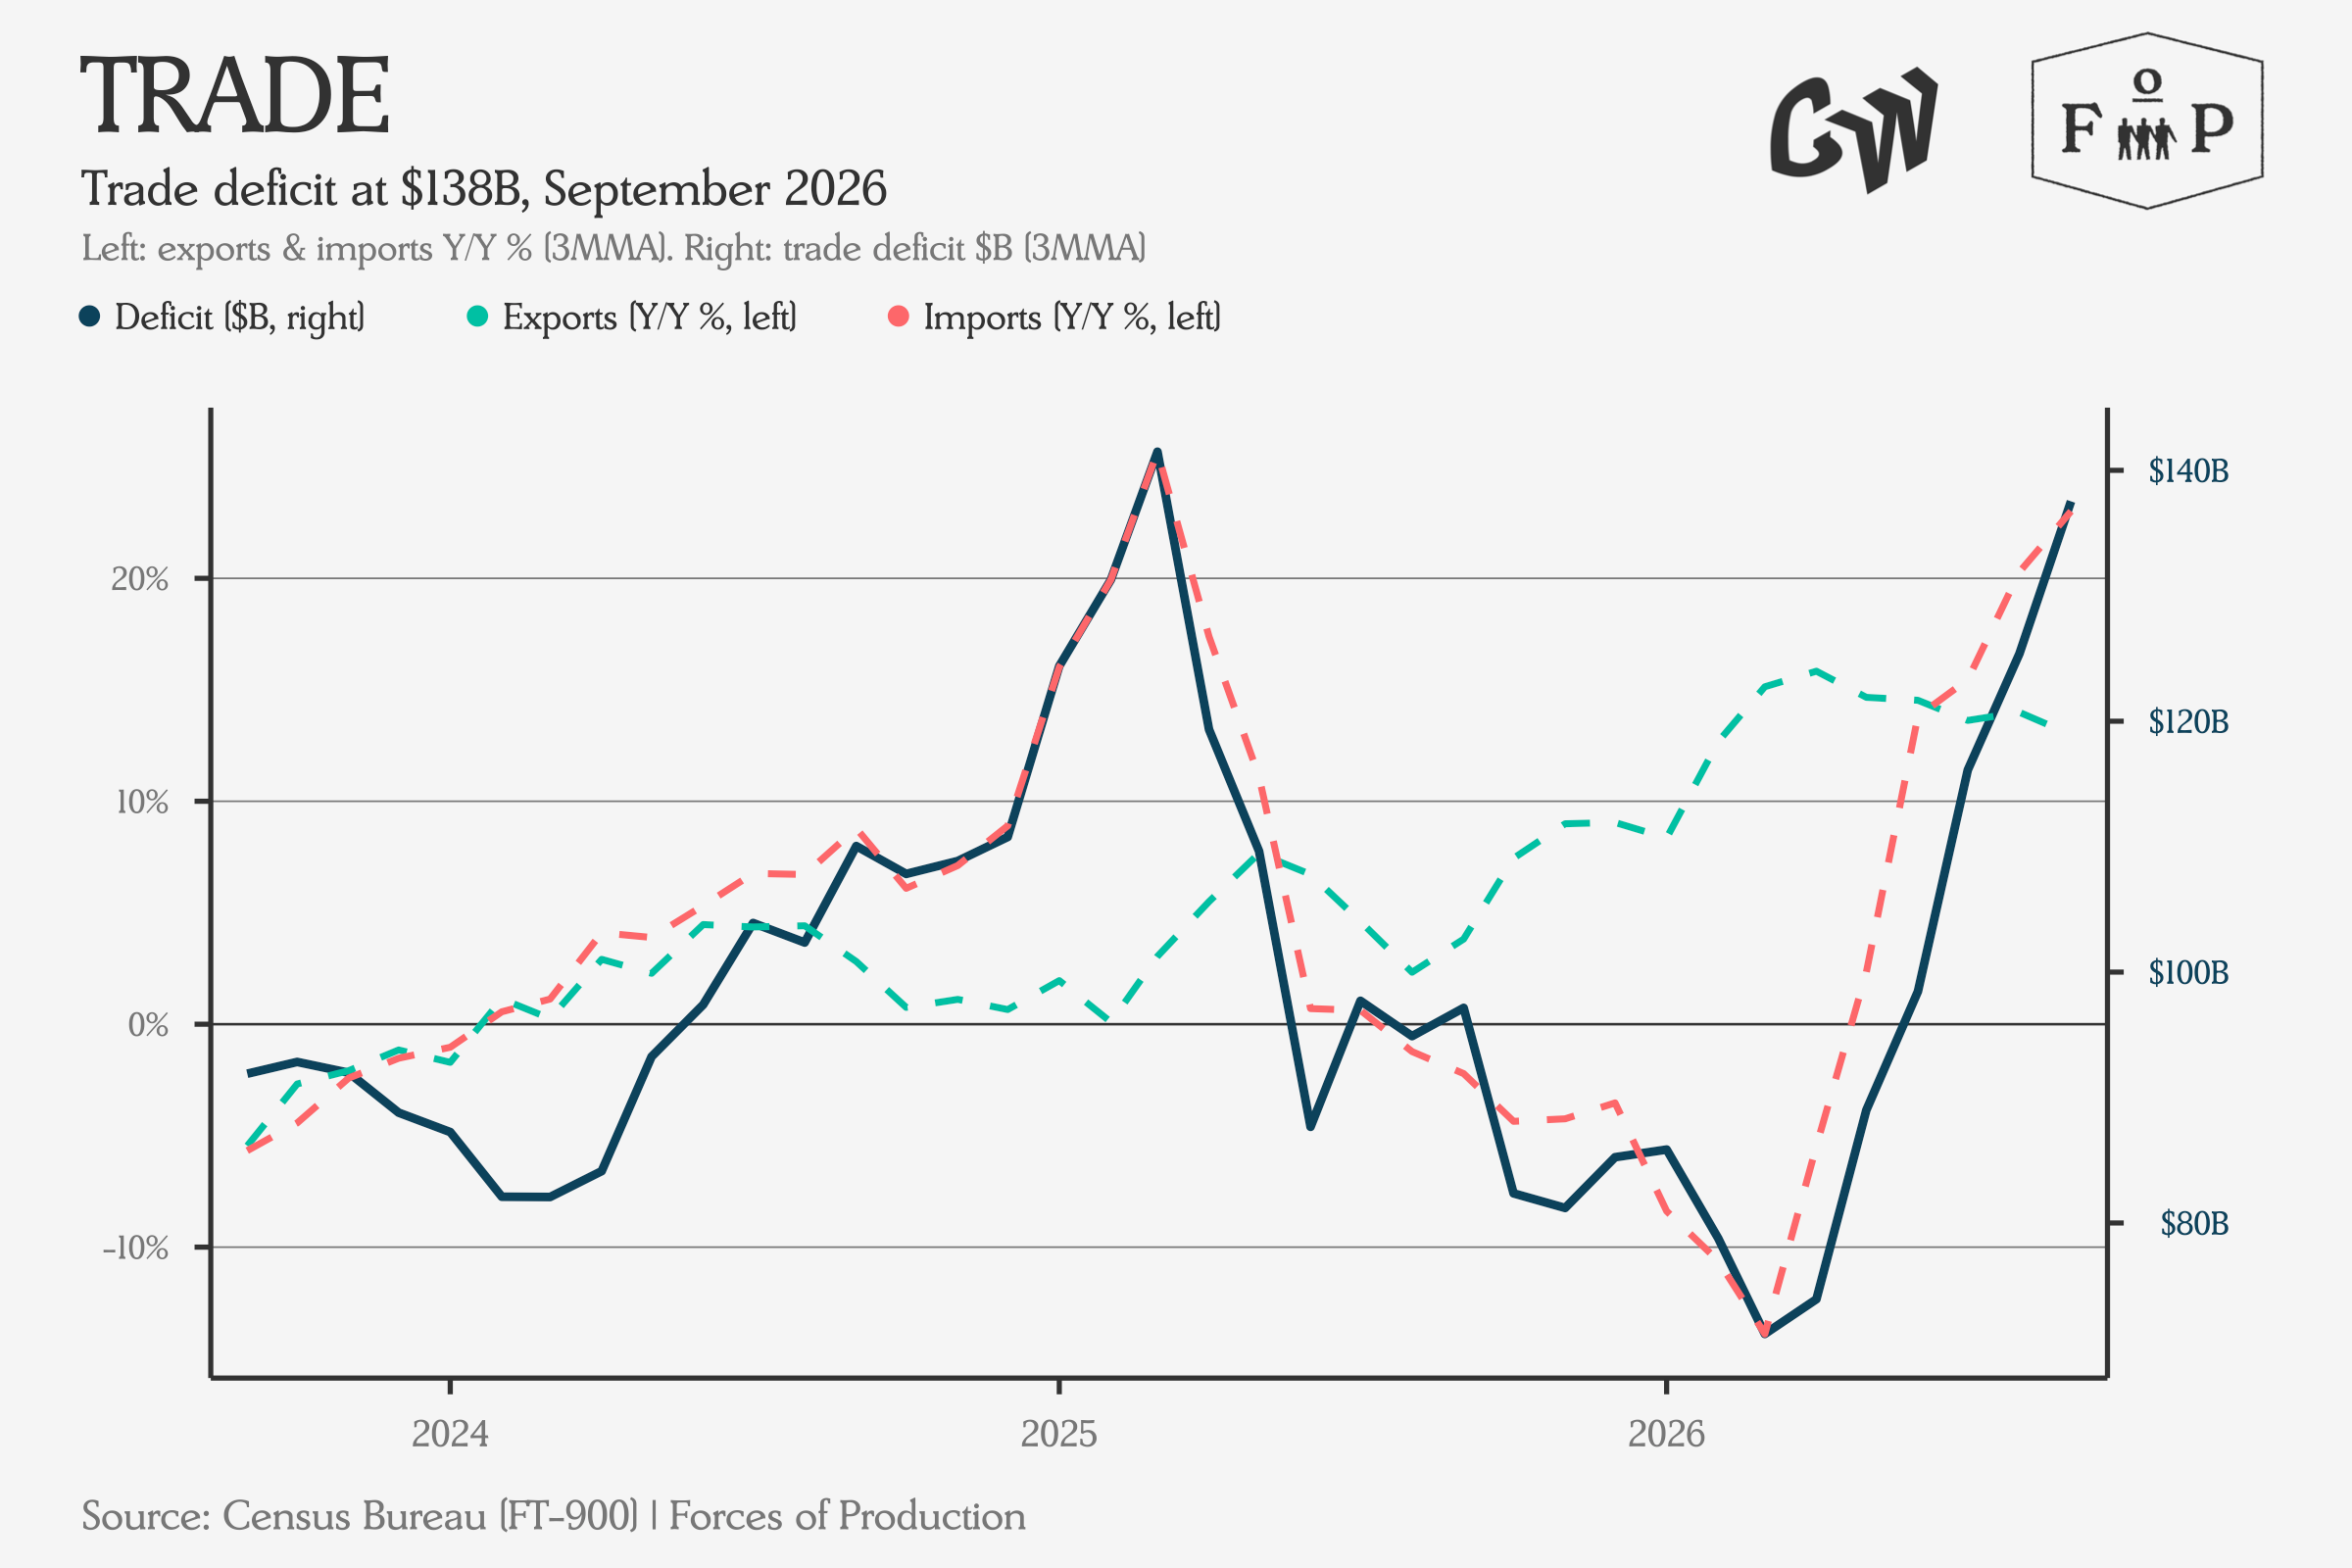
Imports continued to rise in the September data, more quickly than exports, leading to an increase in the trade deficit.
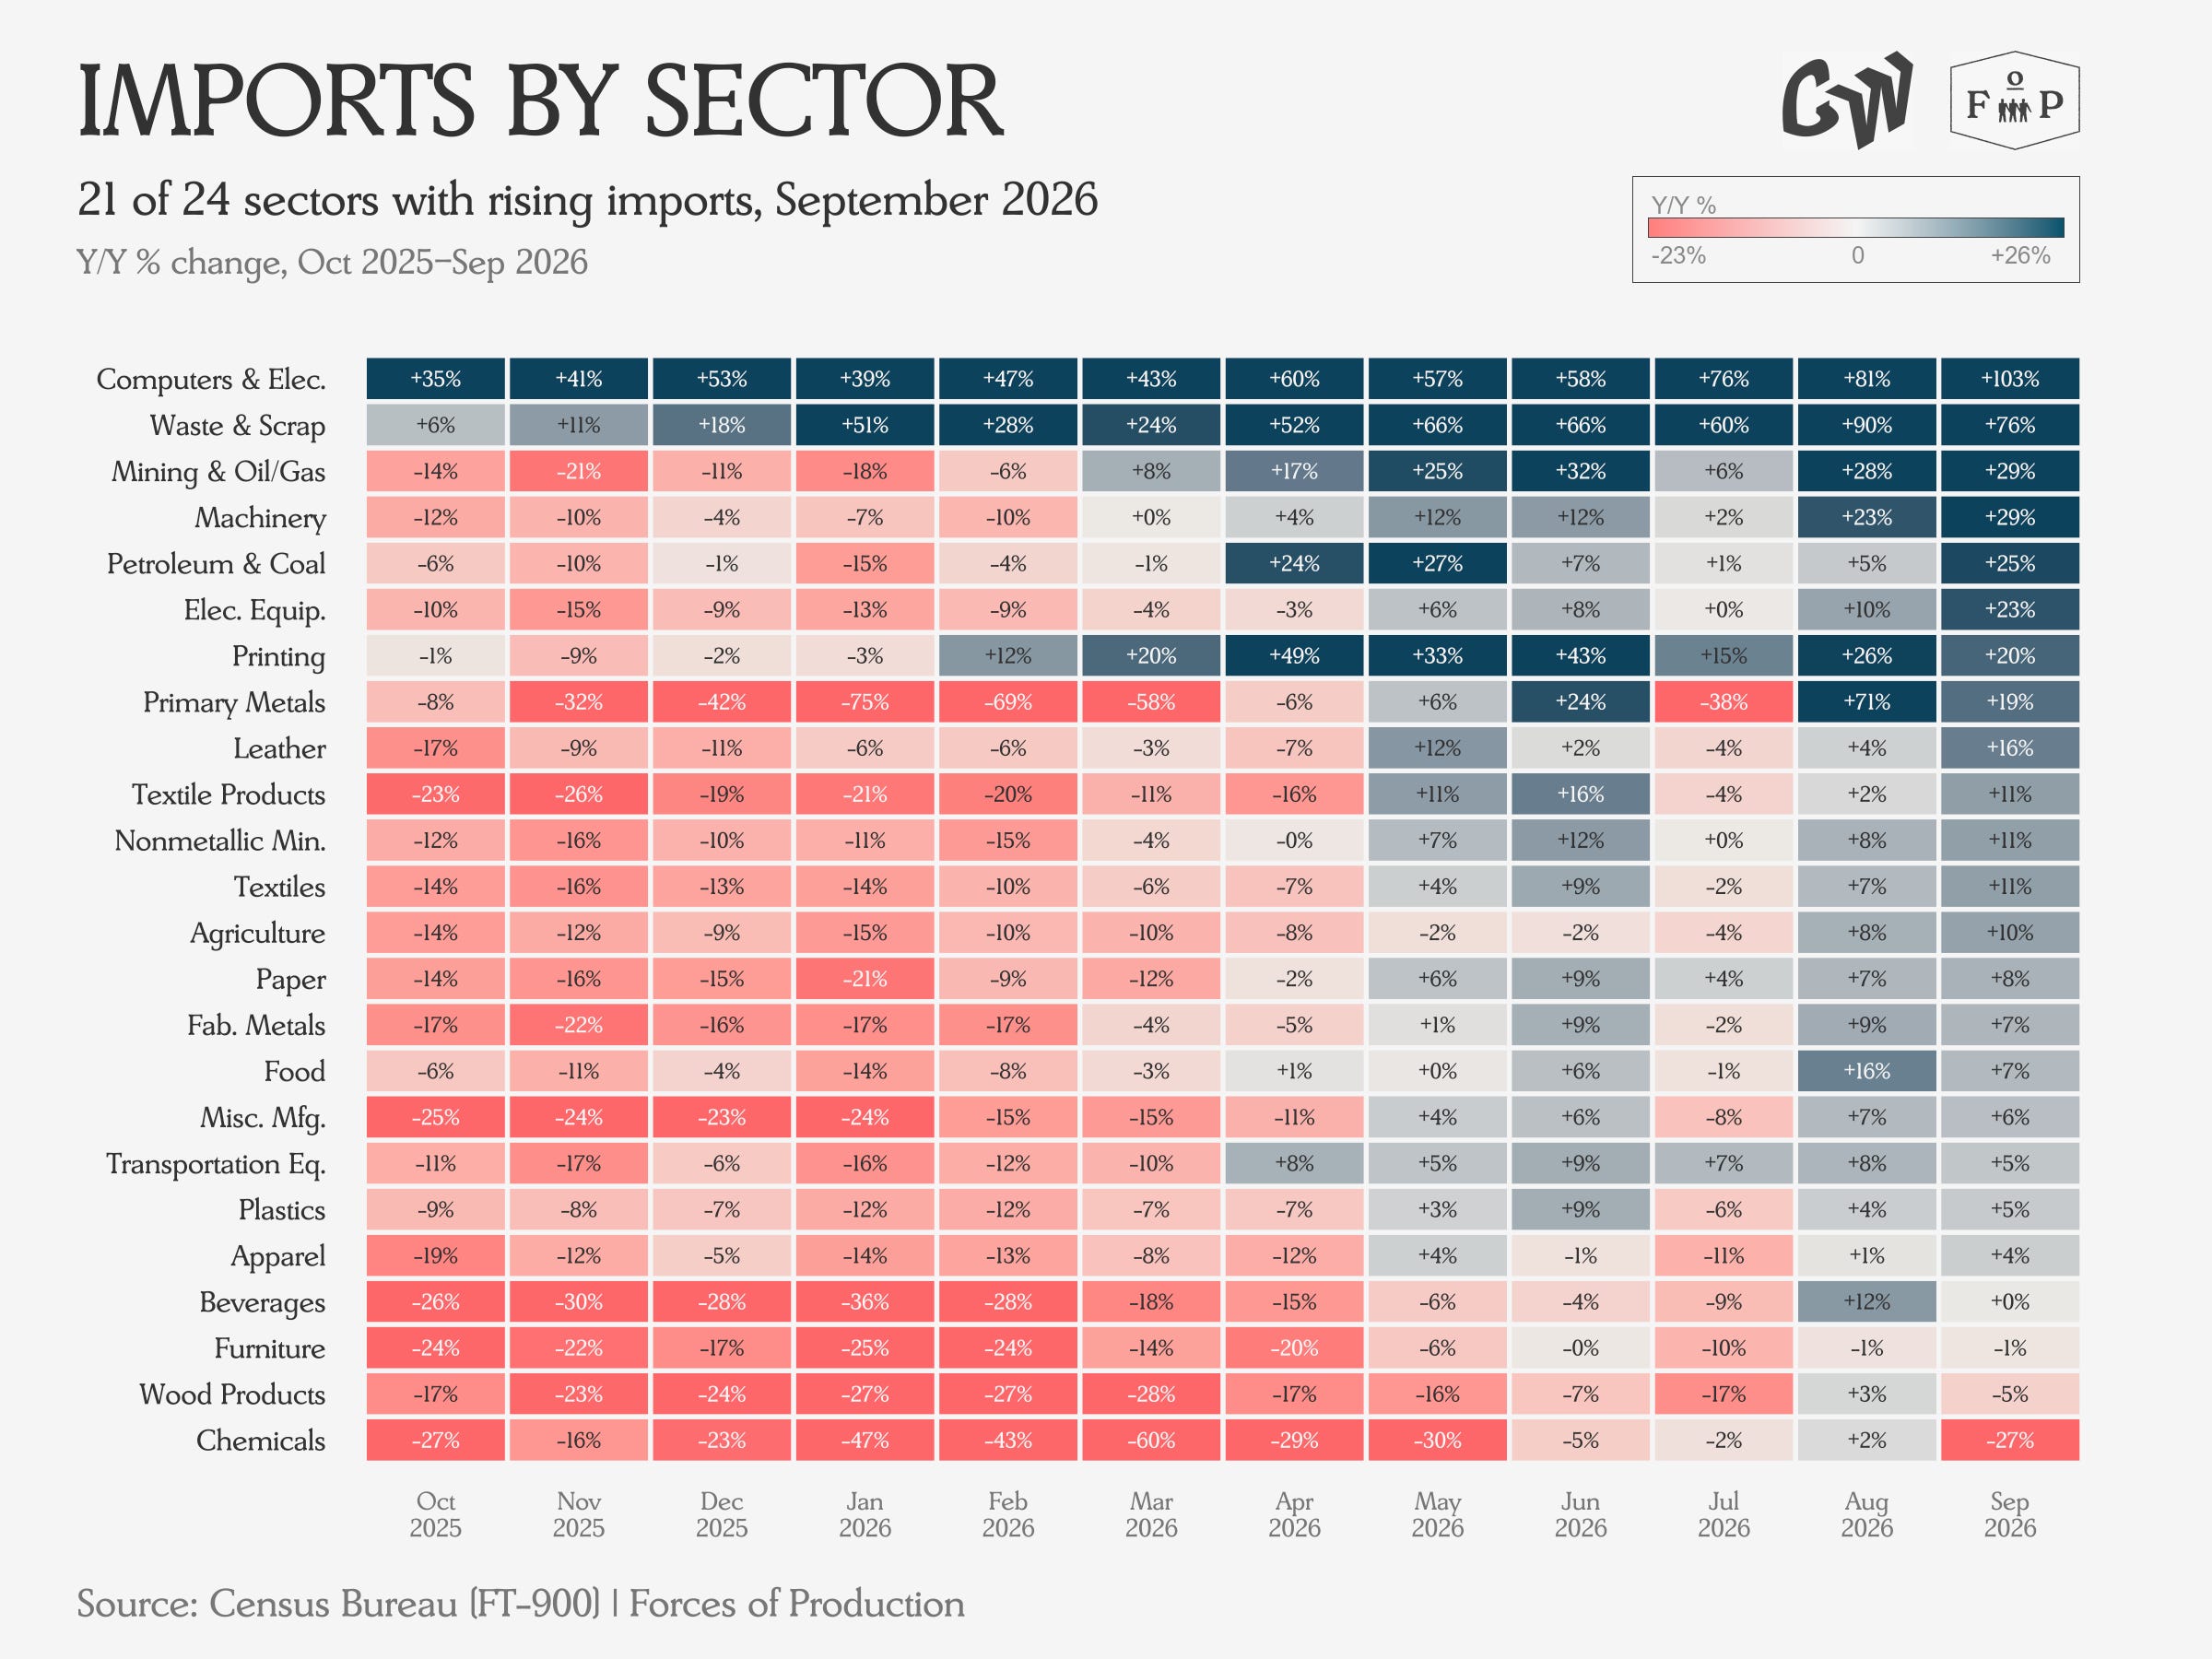
Imports of capital goods — especially Computers, Electronics and Electrical Equipment — surged in the September trade data.
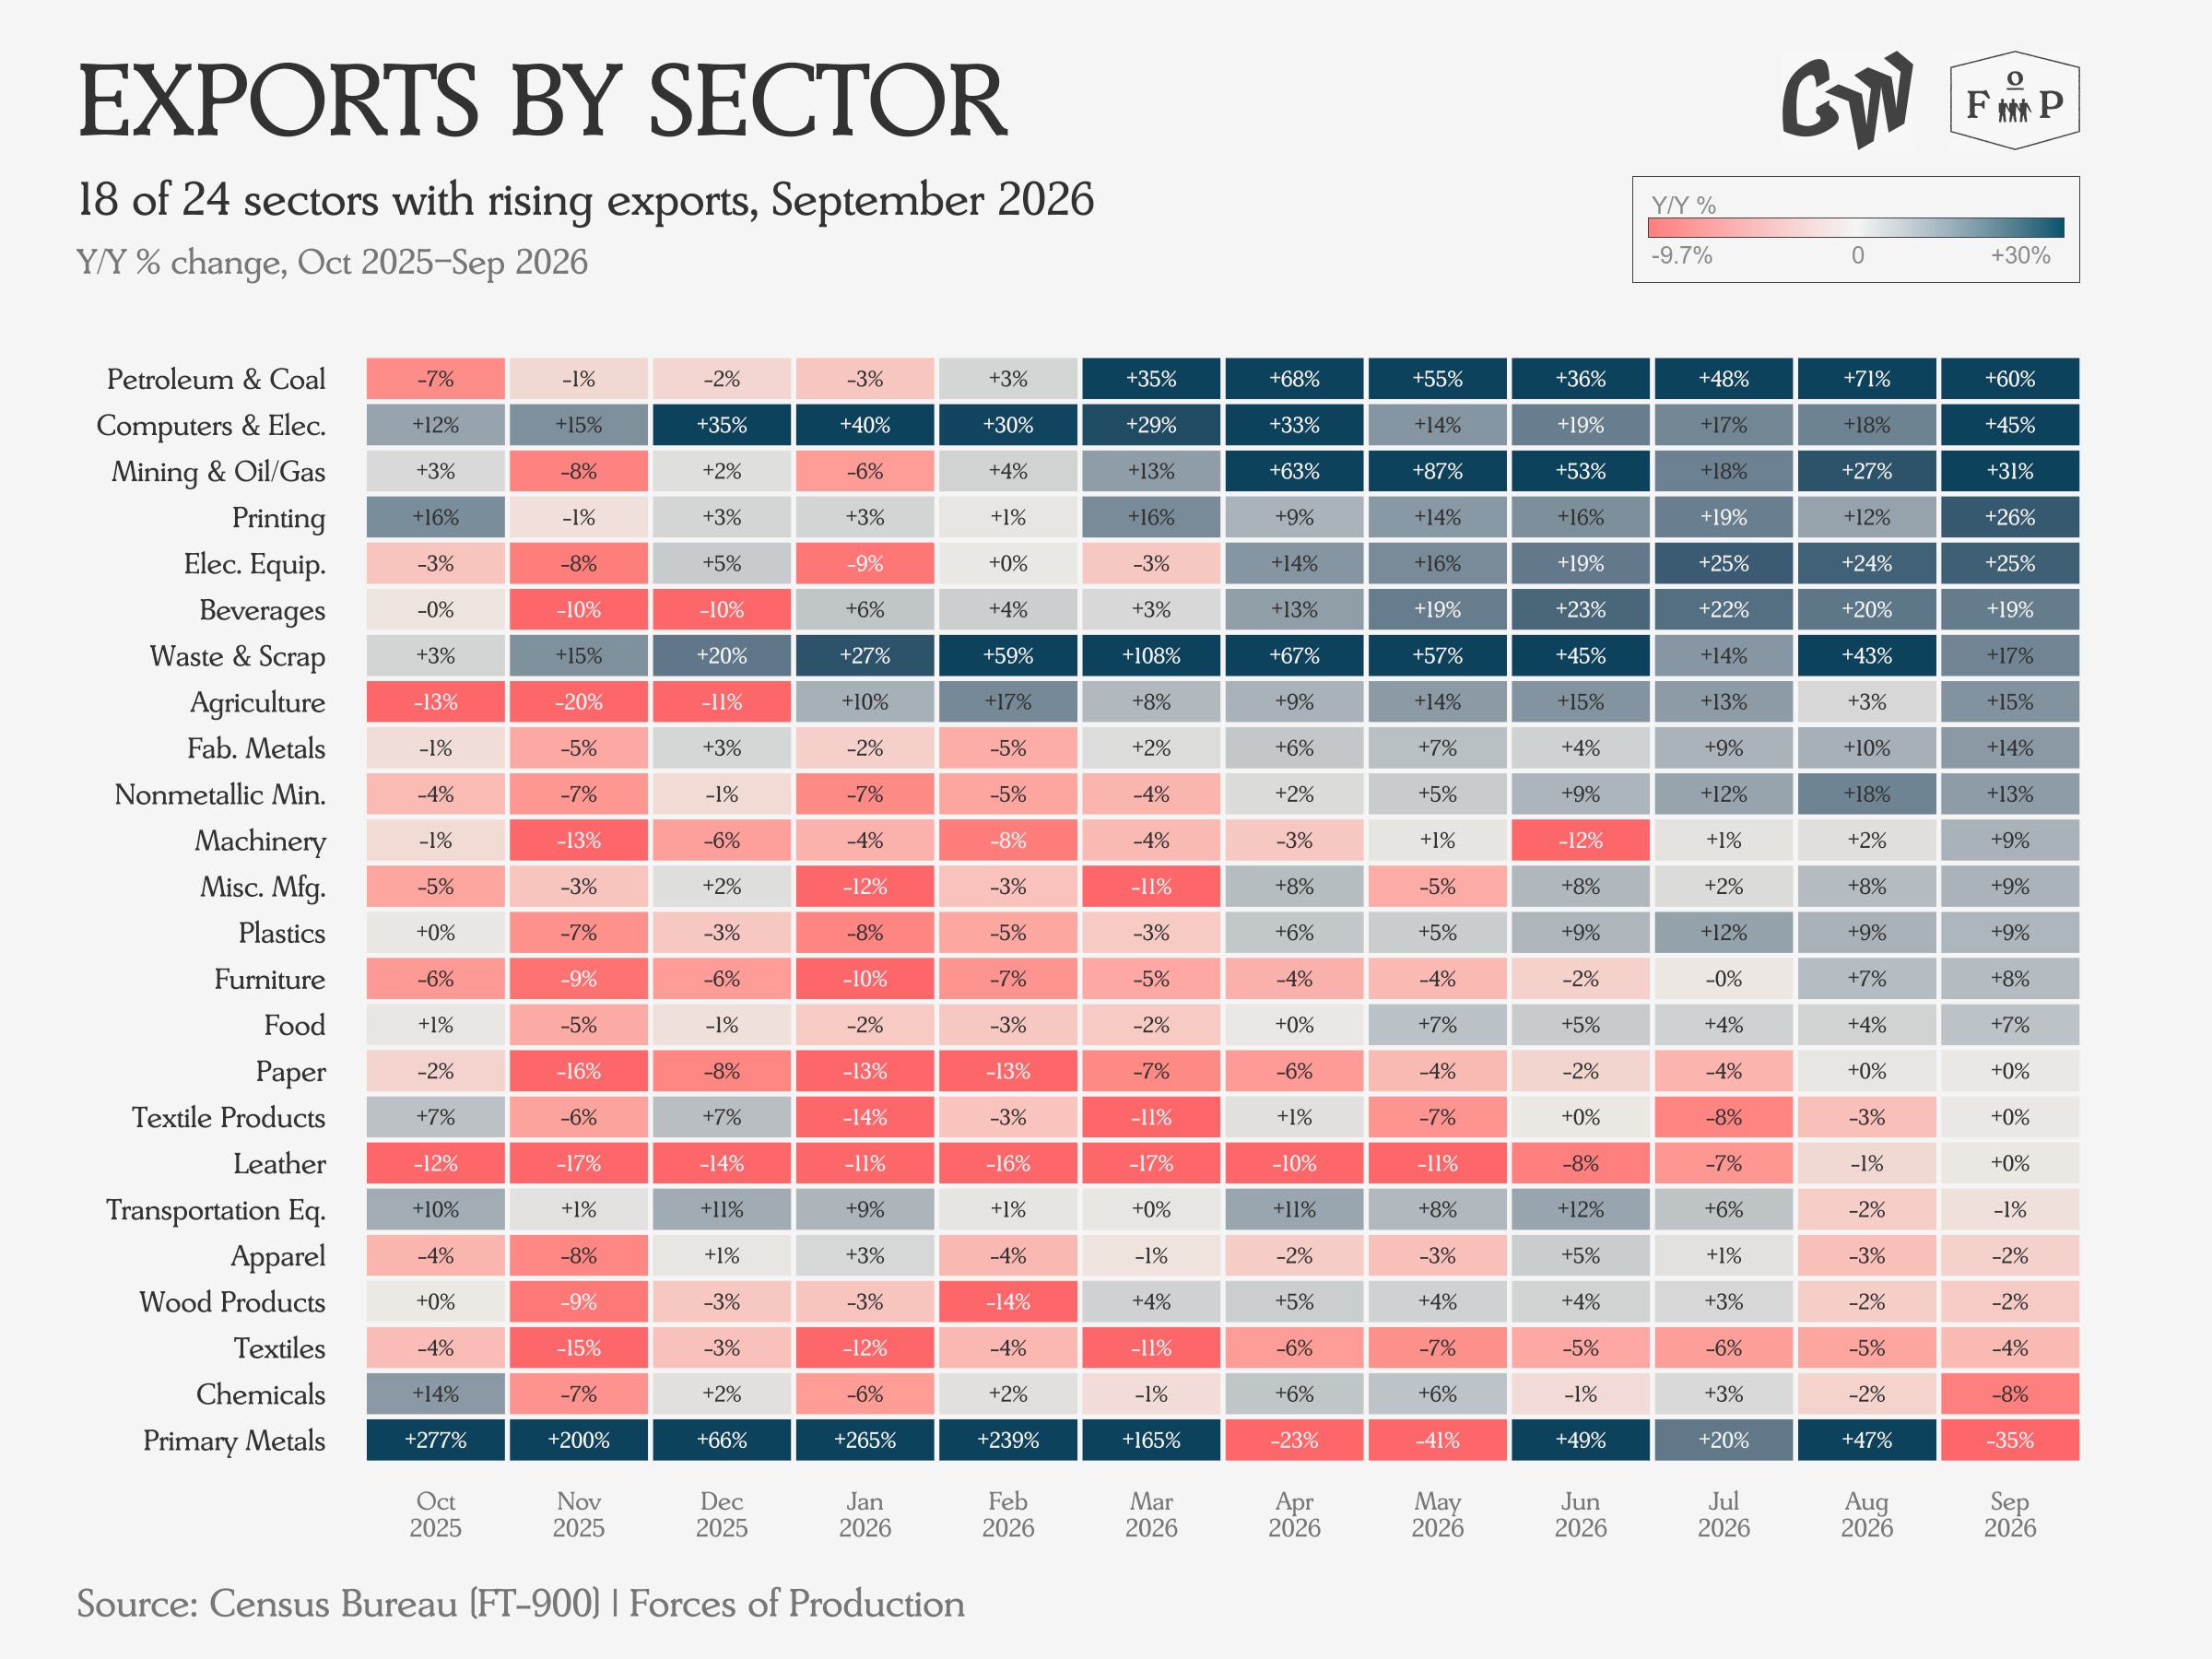
High prices for oil and refined products continue to support exports, which are holding steady or falling in a third of sectors.